INTRODUCTION
An alcohol-induced flushing response is more commonly observed in East Asian people, such as people from Korea, Japan, and Taiwan, than in Caucasian people [1]. This response is caused by the aldehyde dehydrogenase (ALDH) 2*2 variant, which is an ALDH2 enzyme involved in the metabolism of alcohol that predisposes this population to a weaker alcohol metabolic capability, causing facial flushing as a result of acetaldehyde accumulation in the body [2,3].
Among Korean male drinkers, flushers, people who experience an alcohol-induced flushing response, have a higher risk of metabolic syndrome and hypertension than non-flushers, even with less alcohol consumption [4,5]. It has also been reported that flushers have an increased risk of coronary spastic angina and esophageal, pharyngolaryngeal, and bladder cancer. Hence, the clinical importance of an alcohol-induced flushing response is presently emphasized in various fields [6-8].
According to several studies, obesity plays a critical role in increasing the risk of hypertension, cardiovascular diseases, and cancers and in increasing cancer mortality rate [9-11].
Furthermore, several previous studies evaluating the effects of alcohol drinking and obesity in metabolic diseases, cardiovascular diseases, and cancers have been conducted. In Korea, a significant number of individuals are considered flushers considering their genetic features. However, most previous studies have not considered the alcohol-induced flushing response as a variable, and determining a previous study that assessed the association between alcohol drinking and obesity based on the alcohol-induced flushing response is considered difficult.
This study aims to examine the association between alcohol consumption and the risk of pre- or type 2 diabetes mellitus (T2DM) by alcohol-induced flushing response, particularly based on their body mass index (BMI).
METHODS
1. Study Design
This was a retrospective and cross-sectional study that was conducted in compliance with the Declaration of Helsinki. And this study was approved waiver of informed consent by the Ethics Committee of Chungnam National University Hospital (Institutional Review Board approval no., 2017-10-034-001).
2. Study Population
A total of 1,030 male adults who had medical checkups from October 2016 to March 2017 at a health examination center in Daejeon were selected. Individuals with the following characteristics were excluded in the study: individuals who were taking medicine after being diagnosed with diabetes mellitus and taking medicine for hypertension and hyperlipidemia that would likely affect their present lifestyle; individuals who were diagnosed with malignant tumors, cardiovascular diseases, pancreatitis, chronic hepatitis, chronic kidney disease, or pernicious anemia that would likely affect their fasting blood glucose and hemoglobin A1c (HbA1c) levels; individuals aged greater than 65 years; and individuals who responded with ŌĆ£I donŌĆÖt knowŌĆØ when asked whether they had facial flushing.
3. Data Collection
Basic data including the study subjectsŌĆÖ past and present medical histories, medication histories, and lifestyle, including their history of alcohol drinking from their medical records that were obtained while they were having their general medical checkups, were collected. Their heights and weights were determined through body measurement, and their BMI was calculated by dividing their weight (kg) by their height (m) squared. Based on the BMI Standard of the Asia-Pacific Region, subjects with BMI <23 kg/m2 were assigned in the normal-weight group, those with BMI Ōēź23 kg/m2 but <25 kg/m2 were assigned in the overweight group, and those with BMI Ōēź25 kg/m2 were assigned in the obese group [12]. Considering that only a few subjects (n=12) with BMI <18.5 kg/m2 were assigned in the low-weight group, performing an additional analysis was considered difficult. Therefore, in this study, these subjects were included in the normal-weight group.
To determine whether the subjects experienced an alcohol-induced flushing response, the following question was asked: ŌĆ£Do or did you experience flushing in the face immediately after drinking a glass of drink: always, sometimes, or never?ŌĆØ ŌĆ£Always,ŌĆØ ŌĆ£sometimes,ŌĆØ and ŌĆ£neverŌĆØ were used so that the study subjects could easily respond. Subjects who responded either ŌĆ£alwaysŌĆØ or ŌĆ£sometimesŌĆØ were considered as flushers, while those who responded ŌĆ£neverŌĆØ were considered as non-flushers. Subjects who responded ŌĆ£sometimesŌĆØ were considered as flushers because the sensitivity and specificity in identifying ALDH2*2/2*2 from ALDH2*1/2*2 as inactive ALDH2 genotypes were 96.1% and 79.0%, respectively [13].
Regarding the subjectsŌĆÖ history of alcohol drinking, the amount of alcohol that they consumed at a time and the frequency of drinks they had per week were assessed. Based on the National Institute on Alcohol Abuse and Alcoholism standard in the United States, a standard drink contains 14 g of alcohol [14]. This 14 g of alcohol can vary depending on the type of alcoholic beverage and would be 90 mL of 20% soju (a quarter of a soju bottle), the most popular Korean rice liquor, 12 ounces of beer (a can of beer), 45 mL of hard liquor (a hard-liquor glass), 150 mL of wine (a wine glass), and 300 mL of 6% makgeolli (a bowl), a traditional Korean rice liquor. The weekly average alcohol intake was calculated by multiplying the number of drinks the subjects had per week by the amount of alcohol they consumed at a time.
Regarding the subjectsŌĆÖ smoking status, those who had never smoked before the medical checkup were classified as non-smokers, those who had smoked before but had not smoked for the past month were classified as past smokers, and those who were still smoking while taking the medical checkup or had stopped smoking less than a month ago were classified as present smokers. Based on the standard of the American College of Sports Medicine, subjects who performed moderate exercise for over 30 minutes at a time 5 times a week or high-intensity exercise for over 20 minutes at a time 3 times a week were assigned in the regular-exercise group, those who performed exercise but did not meet the regular exercise standard were assigned in the irregular-exercise group, and the rest of the subjects were assigned in the non-exercise group [15]. Regarding the subjectsŌĆÖ dietary habits, those who had three meals a day were assigned in the regular-eating group and those who had fewer than three meals a day were assigned in the irregular-eating group.
4. Definition of Pre- or Type 2 Diabetes Mellitus
This study used the examination results of the general medical checkup for the blood test values, including fasting blood glucose and HbA1c. Pre- or T2DM was diagnosed based on the diabetes diagnostic criteria of the American Diabetes Association [16]. Pre- or T2DM was determined when HbA1c and fasting blood glucose levels were Ōēź5.7% and Ōēź100 mg/dL, respectively.
5. Statistical Analysis
After dividing all flushers and non-flushers into three groups, the normal-weight group, overweight group, and obese group, this study compared the flushersŌĆÖ and non-flushersŌĆÖ general characteristics, body measurements, and blood test results with those of the non-drinkers. Analysis of variance was used to analyze the continuous variables, and a chi-square test was used to analyze the categorical variables such as the years of smoking, exercise habits, and dietary habits.
After dividing all flushers and non-flushers into three weight groups and dividing their weekly average alcohol intake into three categories (Ōēż4 drinks, >4 and Ōēż8 drinks, and >8 drinks), this study compared the association between alcohol intake and the risk of pre- or T2DM in the flushers and non-flushers and non-drinkers through binary logistic regression analysis. Model 1 presents the results with no modifications; model 2 presents the results with changes in age and BMI, which were highly associated with T2DM; and model 3 presents the results with changes to the total cholesterol level, smoking status, exercise status, and diet status, which may affect the risk of T2DM, including the results of model 2. The statistical level of significance was set as P-value <0.05, and all the statistic values were processed using the PASW SPSS ver. 18.0 (SPSS Inc., Chicago, IL, USA).
RESULTS
1. Characteristics of the Study Subjects
Of the 1,030 study subjects, there were 158 non-drinkers, 354 flushers, and 508 non-flushers. There were 47 non-drinkers, 98 flushers, and 137 non-flushers in the normal-weight group and 46 non-drinkers, 94 flushers, and 152 non-flushers in the overweight group. There were 65 non-drinkers, 172 flushers, and 219 non-flushers in the obese group.
The average alcohol intake per week was higher in the non-flushers than in the flushers, and the corresponding gamma-glutamyltransferase level was higher in the non-flushers than that in the flushers. However, the proportion of pre - or T2DM was higher in the flushers than in the non-flushers by each BMI group (Table 1).
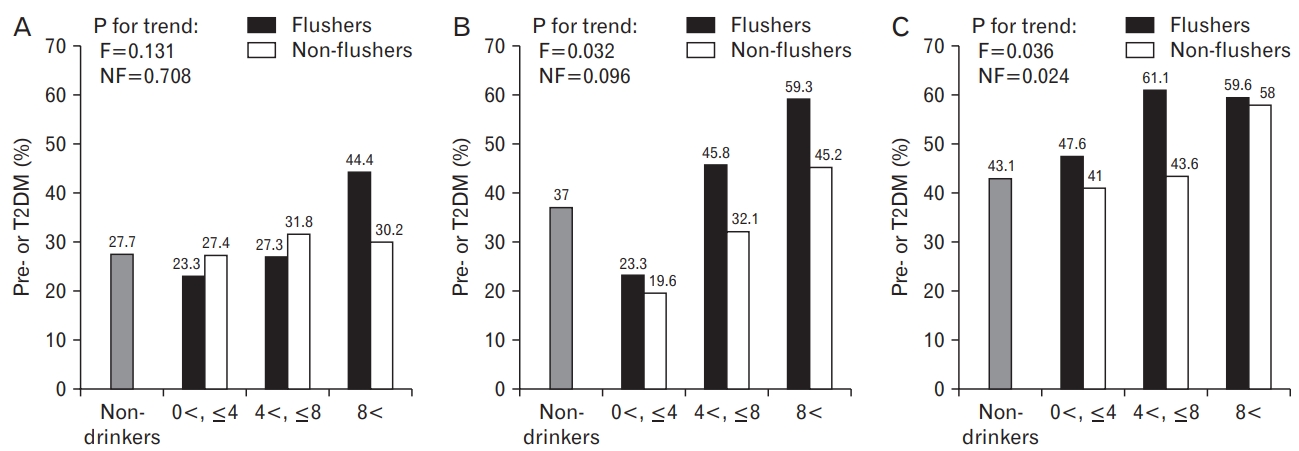
2. Distributions of Pre- or Type 2 Diabetes Mellitus according to Alcohol Intake by Facial Flushing
In the normal-weight group, when the weekly average alcohol intake was fewer than 4 drinks, the proportions of pre- or T2DM were 23.3% in the flushers and 27.4% in the non-flushers. When more than 4 drinks and fewer than 8 drinks of alcohol were consumed on average per week, the flushers and the non-flushers had the proportions of 27.3% and 31.8%, respectively. Moreover, when consuming more than 8 drinks of alcohol, the proportions were 44.4% and 30.2% for the flushers and the non-flushers, respectively.
In the overweight group, when the weekly average alcohol intake was fewer than 4 drinks, the proportions of pre- or T2DM were 23.3% in the flushers and 19.6% in the non-flushers. When consuming more than 4 drinks and fewer than 8 drinks of alcohol on average per week, the flushers and the non-flushers had the proportions of 45.8% and 32.1%, respectively. Furthermore, when consuming more than 8 drinks of alcohol, the proportions were 59.3% and 45.2% for the flushers and the non-flushers, respectively.
In the obese group, when the weekly average alcohol intake was fewer than 4 drinks, the proportions of pre- or T2DM were 47.6% in the flushers and 41.0% in the non-flushers. When consuming more than 4 drinks and fewer than 8 drinks of alcohol on average per week, the flushers and the non-flushers had the proportions of 61.1% and 43.6%, respectively. Moreover, when consuming more than 8 drinks of alcohol, the proportions were 59.6% and 58.0% for the flushers and the non-flushers, respectively.
There was no statistically significant difference between the drinking group and the non-drinkers by each BMI group. However, in the overweight group, the proportion of pre- or T2DM increased as the average alcohol intake per week increased in the flushers (P for trend=0.032). Moreover, in the obese group, the proportion increased as the average alcohol intake per week increased in both the flushers (P for trend=0.036) and the non-flushers (P for trend=0.024) (Figure 1).
3. Logistic Regression Analysis on the Effect of Facial Flushing on the Risk of Pre- or Type 2 Diabetes Mellitus Based on the Weekly Average Alcohol Intake
In the normal-weight flushers, when their weekly average alcohol intake was fewer than 4 drinks, the odds ratios (95% confidence interval) were 0.80 (0.33ŌĆō1.91), 0.94 (0.36ŌĆō2.43), and 0.92 (0.34ŌĆō2.48) for models 1, 2, and 3, respectively. When the weekly average alcohol intake was more than 4 drinks and fewer than 8 drinks, the odds ratios were 0.98 (0.23ŌĆō4.28), 0.88 (0.19ŌĆō4.11), and 0.87 (0.17ŌĆō4.34) for models 1, 2, and 3, respectively. There was no statistically significant difference in the risk of pre- or T2DM between the flushers and the non-flushers and the non-drinkers. However, when the weekly average alcohol intake was more than 8 drinks, the odds ratio of model 3 was 3.43 (1.06ŌĆō 11.07), and a statistically significant difference was observed in the risk of pre- or T2DM between the flushers and the non-flushers and the non-drinkers.
In the normal-weight non-flushers, when the weekly average alcohol intake was fewer than 4 drinks, the odds ratios were 0.99 (0.42ŌĆō2.31), 1.41 (0.57ŌĆō3.51), and 1.30 (0.51ŌĆō3.33) for models 1, 2, and 3, respectively. When the weekly average alcohol intake was more than 4 drinks and fewer than 8 drinks, the odds ratios were 1.22 (0.41ŌĆō3.67), 1.91 (0.58ŌĆō6.30), and 1.91 (0.55ŌĆō6.68) for models 1, 2, and 3, respectively. When the weekly average alcohol intake was more than 8 drinks, the odds ratios were 1.13 (0.48ŌĆō2.69), 1.56 (0.62ŌĆō3.93), and 1.55 (0.56ŌĆō4.31) for models 1, 2, and 3, respectively. Thus, no statically significant difference in the risk of pre- or T2DM between the flushers and the non-flushers and the non-drinkers, regardless of the weekly average alcohol intake, was observed (Table 2).
In the overweight flushers, when the weekly average alcohol intake was fewer than 4 drinks, the odds ratios were 0.52 (0.21ŌĆō1.31), 0.67 (0.26ŌĆō1.77), and 0.69 (0.25ŌĆō1.88) for models 1, 2, and 3, respectively. All the odds ratios were relatively low, but there was no statistically significant difference between the flushers and the non-drinkers in the risk of pre- or T2DM. When the weekly average alcohol intake was more than 4 drinks and fewer than 8 drinks, the odds ratios were 1.44 (0.53ŌĆō3.93), 1.80 (0.64ŌĆō5.10), and 2.04 (0.69ŌĆō6.04) for models 1, 2, and 3, respectively. Although all of these odds ratios were relatively higher than those of non-drinkers, there was no statistically significant difference between the flushers and the non-drinkers in the risk of pre- or T2DM. However, when the weekly average alcohol intake was more than 8 drinks, the odds ratios were 2.48 (0.94ŌĆō6.57), 3.52 (1.23ŌĆō10.06), and 4.94 (1.56ŌĆō15.67) for models 1, 2, and 3, respectively. All of these odds ratios were relatively higher than those of the non-drinkers in the risk of pre- or T2DM. The results of models 2 and 3 were statistically significant.
However, in the overweight non-flushers, when the weekly average alcohol intake was fewer than 4 drinks, the odds ratios were 0.42 (0.17ŌĆō1.04), 0.57 (0.22ŌĆō1.49), and 0.79 (0.29ŌĆō2.20) for models 1, 2, and 3, respectively, but these were not statistically significant. When the weekly average alcohol intake was more than 4 drinks and fewer than 8 drinks, the odds ratios were 0.81 (0.30ŌĆō2.18), 1.14 (0.40ŌĆō3.23), and 1.19 (0.39ŌĆō3.60) for models 1, 2, and 3, respectively, but these were not statistically significant. However, when the weekly average alcohol intake was more than 8 drinks, the odds ratios were 1.41 (0.66ŌĆō3.00), 1.83 (0.82ŌĆō4.09), and 1.86 (0.80ŌĆō4.29) for models 1, 2, and 3, respectively. Although all of these odds ratios were relatively high, these results were not statistically significant (Table 3).
In the obese flushers, when the weekly average alcohol intake was fewer than 4 drinks, the odds ratios were 1.20 (0.63ŌĆō2.30), 1.42 (0.72ŌĆō2.80), and 1.38 (0.70ŌĆō2.75) for models 1, 2, and 3, respectively. All of these odds ratios were relatively high, but these were not statistically significant. However, when the weekly average alcohol intake was more than 4 drinks and fewer than 8 drinks, the odds ratios were 2.08 (0.91ŌĆō4.77), 2.63 (1.10ŌĆō6.31), and 2.64 (1.10ŌĆō6.36) for models 1, 2, and 3, respectively. Specifically, models 2 and 3 showed statistically significant difference. When the weekly average alcohol intake was more than 8 drinks, the odds ratios were 1.95 (0.93ŌĆō4.09), 2.41 (1.11ŌĆō5.24), and 2.42 (1.11ŌĆō5.27) for models 1, 2, and 3, respectively, with models 2 and 3 showing statistically significant difference.
In the obese non-flushers, when the weekly average alcohol intake was fewer than 4 drinks, the odds ratios were 0.92 (0.45ŌĆō1.86), 1.28 (0.61ŌĆō2.69), and 1.31 (0.62ŌĆō2.79) for models 1, 2, and 3, respectively. When the weekly average alcohol intake was more than 4 drinks and fewer than 8 drinks, the odds ratios were 1.02 (0.46ŌĆō2.28), 1.21 (0.53ŌĆō2.79), and 1.26 (0.53ŌĆō2.96) for models 1, 2, and 3, respectively. All odds ratios were relatively higher for the risk of pre- or T2DM in the non-flushers than those in the non-drinkers, but these were not statistically significant. However, when the weekly average alcohol intake was more than 8 drinks, the odds ratios were 1.82 (0.99ŌĆō3.36), 2.36 (1.24ŌĆō4.52), and 2.72 (1.39ŌĆō5.30) for models 1, 2, and 3, respectively, in the non-flushers. Models 2 and 3 showed statistically significant results (Table 4).
DISCUSSION
After dividing all the study subjects into the normal-weight group, overweight group, and obese group, this study examined the changes in the risk of pre- or T2DM according to the weekly average alcohol intake depending on the alcohol-induced flushing response. Thus, when obese non-flushers consumed more than 8 drinks of alcohol on average per week, they had a higher risk of pre- or T2DM than the non-drinkers. In contrast, it was found that obese flushers had an increased risk of pre- or T2DM even when consuming a relatively low amount of alcohol (>4 drinks/wk).
This study has the following results. First, the difference in the proportion of pre- or T2DM according to BMI in the non-drinkers is confirmed in this study. The proportions of pre- or T2DM were 27.7%, 37.0%, and 43.1% in the normal-weight group, overweight group, and obese group, respectively, indicating that the heavier the male adults are in weight, the higher the proportion of pre- or T2DM becomes. These results seem to indirectly support the data from the International Diabetes Federation [17], which demonstrated that almost half of all diabetic patients (48.6%) were diagnosed with obesity, which causes insulin resistance and hyperinsulinemia through their inflammatory responses, consequently increasing their risk of T2DM [18]. Additionally, obesity promotes intracellular pathway that causes insulin resistance inside the body and leads to a decrease in the function of the mitochondrion, ultimately lowering the function of pancreatic beta cells and increasing their resistance against insulin. As such, the results of this study seem to indirectly support the theory that obesity increases the risk of T2DM [19].
Second, excessive drinking increases the risk of pre- or T2DM. In the obese non-flushers, when their weekly average alcohol intake was more than 8 drinks, their risk of pre- or T2DM was higher than for the non-drinkers. According to a meta-analysis, excessive drinking in male adults increases the relative risk of T2DM regardless of obesity [20]. Moreover, according to a Swedish study, when male adults aged 35ŌĆō56 years consume over 5 g of alcohol per day, the risk of T2DM may increase [21]. Based on their study results and the results of this study, excessive drinking seems to increase the risk of pre- or T2DM. However, some study results have found that excessive drinking is not associated with the risk of T2DM [22] because excessive drinkers had other underlying diseases caused by excessive drinking in several cases, such as liver cirrhosis, and had stopped drinking to treat underlying diseases, which may have been one of the main reasons why there was no difference between excessive drinkers and non-drinkers for the risk of T2DM.
Third, the risk of pre- or T2DM by drinking may differ depending on the alcohol-induced flushing response. In both the normal-weight and overweight groups, there was no significant difference between the non-flushers and the non-drinkers regarding the risk of pre- or T2DM. However, when the weekly average alcohol intake was more than 8 drinks for the flushers, the risk of pre- or T2DM was higher in the flushers than that in the non-drinkers; these differences between the flushers and the non-drinkers were also found in other studies. According to a previous study, when consuming the same amount of alcohol (more than 12 drinks and fewer than 20 drinks), the flushers had higher insulin resistance than the non-drinkers, but there was no significant difference between the non-flushers and the non-drinkers regarding insulin resistance [23]. According to another study, when drinking alcohol excessively, the flushers had higher HbA1c level than the non-drinkers, while the non-flushers had a decreased HbA1c level [24]. A difference in the process of glucose metabolism due to the alcoholinduced flushing response was observed possibly because during alcohol drinking, acetaldehyde is accumulated in the body, causing more oxidative stress reactions and hepatotoxicity [25].
Finally, obese flushers had a higher risk of pre- or T2DM, even when consuming little alcohol (over 4 drinks), than the non-flushers and non-drinkers. According to a previous study, when consuming as little alcohol as one or 2 drinks per day, Korean obese male adults may have an increased prevalence of impaired fasting plasma glucose or T2DM [26]. In relation to obesity and diabetes, adipose tissue plays an important role in breaking down fat and increasing insulin reactivity by producing free fatty acids. When these adipose tissues expand, hypoxia of the local tissues, infiltration of the inflammatory cells, and deformation of the intracellular pathway occur. Consequently, with obesity, free oxygen radicals suppress the signal transduction of insulin receptors [27]. According to another previous study, since inactive ALDH2 causes more oxidative stress responses, mice with inactive ALDH2 accumulate more beta amyloids through oxidative stress responses including free oxygen radicals, resulting in an increased risk of AlzheimerŌĆÖs disease [28]. Considering these results, the hypothesis that an excess of adipose tissues induces more free oxygen radicals in the flushers with obesity is considered logical. Hence, acetaldehyde accumulation from alcohol is observed in the obese flushers, leading to more oxidative stress responses in the body when drinking alcohol, increasing the concentration of blood glucose or insulin resistance, even leading to an increased risk of pre- or T2DM.
This study has few limitations. First, this study is a cross-sectional study. Second, it is a single-center study. Third, instead of ALDH2 genotyping, this study uses a questionnaire to assess the presence of alcohol-induced facial flushing response in the study subjects. Fourth, the present study did not perform the oral glucose tolerance test in assessing the risk of pre- or T2DM. Finally, this study did not include female study subjects.
Nevertheless, the results of this study are important in determining whether normal-weight and overweight male adults with alcohol-induced flushing response have an increased risk of pre- or T2DM when they consume more than 8 drinks of alcohol on average per week. Moreover, obese male flushers have a higher risk of pre- or T2DM when they consume more than 4 drinks of alcohol on average per week than the non-drinkers.