INTRODUCTION
Sacopenia is the loss of muscle mass with age, which is known to be related to decreased muscle strength, low physical activity, and increased mortality.1,2) In a previous study, sarcopenia increased the risk of having three or more disabilities on the instrumental activities of daily living scale, one or more balance abnormalities, using a cane or walker, and falls.3) Several studies have reported that the prevalence of sarcopenia was 4% to 64%.4-7) The great range in prevalence is attributed to the fact that the definition of sarcopenia has not yet been firmly established, and the respective techniques used for the measurement of lean mass and the reference population were different. Aging is related to several anatomical changes including increased frailty, disability, and falls, as well as body composition changes, including decrease in muscle and bone mass.8,9) Observational studies have reported that muscle mass begins to decrease at approximately 1% per year following the fourth decade of life.9,10)
Low bone mineral density (BMD) and fracture risk are increasing with the aging of populations all over the world.10,11) In the US, 30% of men aged 50 years and older have femur neck osteopenia, and 2% have femur neck osteoporosis.12) Osteoporosis in men is an underrecognized and undertreated condition. Osteoporotic fractures in men are associated with higher mortality and morbidity relative to women.13) Undoubtedly, sarcopenia and osteoporosis will be a major problem in healthcare, imposing a great financial burden.
The genesis of both sarcopenia and osteoporosis is multifactorial. These causal factors include hormonal changes, low level of physical activity, low intake of dietary protein, and chronic inflammation.14-17) These common etiology may be responsible for a positive relation between osteoporosis and sarcopenia, and it can be assumed that sarcopenia is a risk factor for osteoporosis, and that it is more prevalent among individuals having low BMD.
However, this hypothesis has not been proven universally. One cross sectional study reported that sarcopenia and osteoporosis have no association.18) Although there were several studies that evaluated the relationship between quality of life and osteoporosis or frail fracture, studies of the relationship between sarcopenia and quality of life are few. Consequently, the purpose of this study was to identify the association between sarcopenia and BMD, as well as the relationship between sarcopenia and quality of life in Korean men.
METHODS
1. Study Subjects
The Korea National Health and Nutrition Examination Survey (KNHANES) is a nationwide, cross-sectional health survey. KNHANES IV was conducted by the Division of Chronic Disease Surveillance, Korea Centers for Disease Control and Prevention, from 2007-2009. A total of 10,533 KNHANES IV sampled subjects were screened, for a response rate of 82.8% in 2009. All participants in this survey gave informed consent. This study analyzed data from 1,397 male subjects aged 50 years or older among those who participated in the survey between January 2009 and December 2009, after excluding 83 incomplete respondents on the EuroQol-5 dimension (EQ-5D), 66 subjects who did not have adequate blood samples, and 181 subjects who did not conduct dual energy X-ray absorptiometry (DEXA) measurements of BMD.
2. Lifestyle Questionnaire and Anthropometric Measurements
Self-reported questionnaires were used to assess demographic characteristics and life style factors in participants. Dietary intake including calcium was assessed using a 24-hour recall method. Regular exercise was defined as exercise on a regular basis for more than 20 minutes at a time and more than three times per week. Smoking status was categorized as current smoker vs. nonsmoker. Alcohol consumption was classified according to the reported amount of drinks consumed on average per week. Alcohol drinking was defined as consumption of one or more drinks per drinking day at least one per month. Education level was categorized as <6 years, 6.9 years, 9.12 years, and >12 years. Household income was evaluated by equivalised gross household income per month, calculated by total household income per month/√number of family members. Participants' weight and height were measured according to standard procedures. Height was measured to the nearest 0.1 cm with the subject standing barefoot. Body weight was measured to the nearest 0.1 kg on a balanced scale with the subject wearing a lightweight gown or underwear. Body mass index (BMI) was calculated by dividing body weight (kg) by height (m2). Waist circumference was measured to the nearest 0.1 cm at the narrowest point between the lowest rib and the uppermost lateral border of the right iliac crest.
3. Body Composition Analysis and Definition of Sarcopenia, Osteopenia, and Osteoporosis
Total and regional BMD (g/cm2) and total and regional lean mass were measured by DEXA (DISCOVERY-W fanbeam densitometer; Hologic, Bedford, MA, USA) using standard procedures. The stability of DEXA measurements was determined by a daily calibration with a phantom supplied from the manufacturer. The within-day coefficients of variation (%) for duplicated measurements in 30 adults ranged from 0.84 to 2.29 among four examiners.19) Sarcopenia was defined as proposed by Baumgartner with appedicular lean mass (aLM) obtained as the sum of lean mass in arms and legs,3) assuming that all nonfat and nonbone tissue was skeletal muscle divided by the squared height (ht2); aLM/ht2. The cutoff point for our study subjects was 6.93 kg/m2, equivalent to two standard deviations below a young reference population. BMD was classified by the World Health Organization criteria based on the T score of the lumbar spine and/or femoral neck and/or total hip as follows: normal (T score > -1.0 SD), osteopenia (-1.0 ≥ T score > -2.5 SD), and osteoporosis (T score ≤ -2.5 SD).
4. Measurement of Health-Related Quality of Life
The EuroQol was used to evaluate health-related quality of life (HRQoL). The EQ-5D recorded the level of self-reported problems according to five dimensions (mobility, self-care, usual activities, pain/discomfort, and anxiety/depression).20,21) Each of the dimensions was assessed based on a single question with three response levels (no problems, some problems, and extreme problems). In this paper, three levels of answers were classified into two groups (problem absent/problem present). The problem group included subjects who responded 'some problem' and 'extreme problem' among three levels of severity. Using a combination of these items, a single health index score was calculated using the Korea valuation set developed by the Korea Centers for Disease Control and Prevention.22) Scores of the EQ-5D index range from -0.171 to 1, where 1 indicates no problems in any of the five dimensions, zero indicates death, and negative values indicate a health status worse than death.
5. Statistical Analysis
Statistical analyses were performed using SPSS ver. 18.0 (SPSS Inc., Chicago, IL, USA) which incorporates sample weights and adjusts analyses for the complex sample design of the survey. The participants' characteristics and EQ-5D index were compared according to sarcopenia status using independent-sample student's t-tests for continuous measures and chi-square tests for categorical measures. The odds ratios (ORs) and 95% confidence interval (CI) for sarcopenia according to BMD (normal, osteopenia, and osteoporosis) and those for problems of individual components of health-related quality of life according to sarcopenia were estimated using multivariate logistic regression models adjusted for age, BMI, calcium intake, regular exercise, smoking, alcohol, and education. Total EQ-5D index was calculated using the analysis of covariance test after adjustment for covariants. P < 0.05 was accepted as significant.
RESULTS
1. Basic Characteristics of the Study Subjects
Basic characteristics of the study subjects are presented in Table 1. Subjects with sarcopenia were older and had lower BMI, waist circumference, and total body fat mass. Total energy and calcium intake in subjects with sarcopenia were lower than those without sarcopenia. They were more likely to smoke; however, they were also less likely to drink alcohol. The T-score of L-spine, femur neck, and total femur were lower in subjects with sarcopenia than those without sarcopenia. Prevalence of osteopenia and osteoporosis was higher in subjects with sarcopenia than those without sarcopenia.
2. Score of EQ-5D Index and Individual Components of EQ-5D Descriptive System in Study Subjects
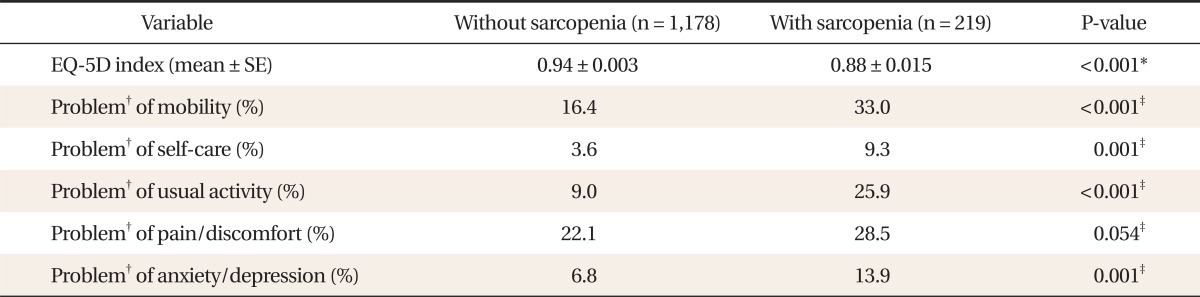
Table 2 showed the score of the EQ-5D index and individual components of the EQ-5D descriptive system. The score of the EQ-5D index was significantly lower in subjects with sarcopenia than those without sarcopenia. Subjects with sarcopenia showed a significantly higher proportion of problems in all items of the EQ-5D descriptive system of HRQoL (mobility, self-care, usual activity, pain & discomfort, anxiety & depression) than those without sarcopenia.
3. Prevalence and Odds Ratios for Sarcopenia according to Bone Mineral Density
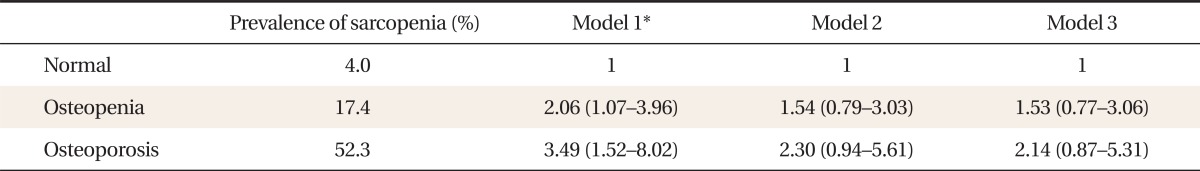
Table 3 shows the prevalence and ORs for sarcopenia according to BMD. The prevalence of sarcopenia increased as BMD decreased as follows: normal 4.0%, osteopenia 17.4%, and osteoporosis 52.3%, respectively. After adjustment for age and BMI, the ORs (95% CI) for having sarcopenia in the osteopenic and osteoporotic group were 2.06 (1.07-3.96) and 3.49 (1.52-8.02), respectively (P for trend < 0.001).
4. Adjusted Score and Odds Ratios for Individual Components of EQ-5D Descriptive System according to Presence of Sarcopenia
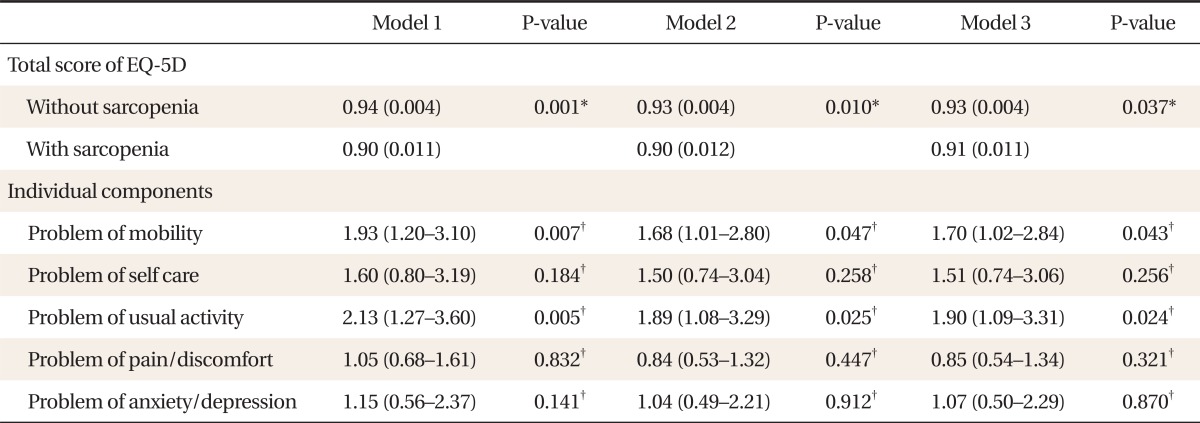
Table 4 shows the adjusted score and ORs for individual components of the EQ-5D descriptive system according to presence of sarcopenia. After adjustment, the total score of the EQ-5D index was significantly lower in sarcopenic subjects. The ORs (95% CI) for having problems of mobility and usual activity of the EQ-5D descriptive system were 1.70 (1.02-2.84) and 1.90 (1.09-3.31), respectively, after adjusting for age, BMI, calcium intake, regular exercise, smoking, alcohol, and education (P for trend < 0.001).
DISCUSSION
This study demonstrated that the risk for sarcopenia increased as BMD decreased, and the subjects with sarcopenia were at risk for decreased health-related quality of life. Several studies have shown the relationship between BMD and sarcopenia. A previous study showed that lower BMD in pre/postmenopausal women was related to a greater risk of sarcopenia, and the same results were found after adjustment for diet, physical activity, and hormone replacement therapy.23) According to a study of 313 women with hip fracture, subjects with sarcopenia had a higher risk of osteoporosis.24) Their data showed significant association between sarcopenia and osteoporosis in a large sample of hip fracture women. Other studies have demonstrated a positive correlation among appendicular muscle mass and BMD, and decreased bending strength and lower cortical bones.25,26) Our data suggests that decreased BMD may be associated with sarcopenia in men aged 50 or over. Sarcopenia is a marker of falling, and bone loss indirectly influences the risk of fracture because it causes impaired balance and falls.27) Therefore, combining low BMD and low muscle mass could indicate higher fracture risk. The genesis of osteoporosis and sarcopenia is multifactoral and complicated. Interestingly, several factors that play a role in osteoporosis are thought to causing sarcopenia.
These causal factors include low intake of dietary protein, low physical activity, hormonal change, and chronic inflammation causing catabolic stimulation.14-17) In our study, we could not find any difference between subjects in consumption of dietary protein and exercise. Because this study is a cross-sectional study, there were limitations in interpreting the relationship between dietary intake or exercise status and sarcopenia. Smoking rate was higher in subjects with sarcopenia than those without sarcopenia in our study. A recent study proposed that cigarette smoking might induce skeletal muscle protein breakdown.28) In this study, subjects with sarcopenia showed a lower rate of alcohol consumption than those without sarcopenia. However, a decrease in lean body mass is commonly observed in alcohol abusers, and it is estimated that 40% to 60% of all adult abusers exhibit skeletal muscle myopathy.29) The muscle wasting and myopathy associated with chronic alcohol abuse is due to an imbalance in protein metabolism.30) Previous studies reported that sex hormones-testosterone, estrogens, and dehydroepiandrosterone sulphate (DHEAS)-exert an important role in the age-related onset of sarcopenia.31) The decline in DHEAS may have a role in the age-related dysregulation of testosterone in men in whom testosterone levels decrease by 1% per year, and bioavailable testosterone decreases by 2% per year from age 30. Although this study could not demonstrate hormonal influence on sarcopenia, a previous study showed that combined age-associated decline in sex hormone levels has a strong impact on mortality and osteometabolic diseases.32) During the aging process, loss of muscle strength and mass cause microarchitecture changes in bone and a decrease in BMD. These common etiologies may account for the positive association between sarcopenia and osteoporosis.
Our study showed that subjects with sarcopenia had lower HRQoL than those without sarcopenia. Moreover, subjects with sarcopenia had significantly more problems with mobility and usual activity in the EQ-5D. Our study suggests that sarcopenia may have a greater influence on dimensions of physical functioning of HRQoL rather than social functioning or mental health. Loss of muscle mass and decrease in muscle strength through sarcopenia may induce discomfort during movement and usual activity. Another study reported that sarcopenic obesity was associated with decreased physical function,33) and thus it has been identified as an important cause of frailty among the elderly.34,35) A recent study assessed the relationship between HRQoL (using by SF-36) and sarco-osteopenia that newly defined by BMD, muscle mass and grip length. Subjects with the limitation of activity related with sarcopenia showed lower HRQoL.36) Several prospective studies have demonstrated that a high degree of physical activity has positive effects on muscle strength, and sarcopenia; and vice versa, a low level of physical activity is related to decline in muscle strength and mass.37,38) Therefore, it seemed that sarcopenia affects mobility and usual activity related to physical activity from among factors in HRQoL.
A previous study reported that sarcopenia is thought to impose an economic burden on healthcare services because it increases the risk of physical disability in elderly subjects.39) The association between osteoporosis and sarcopenia suggests that a further increase in healthcare expenses may be associated with sarcopenia, given relevant costs due to frailty fractures that are suggested to be more common among subjects with sarcopenia. Our study supports an economical approach to preventing sarcopenia and decreased BMD in elderly people concurrently.
This study has some limitations. First, our study could not infer a cause-and effect relationship between sarcopenia and BMD and HRQoL. Also, it is difficult to know which sarcopenia and low HRQoL precede or coincide. A prospective approach is needed when considering whether sarcopenia is a cause of low HRQoL. Second, as we measured lifestyle factors using questionnaires, we cannot exclude the possibility of inaccuracies. Dietary intake, exercise, smoking, and alcohol consumption were measured from responses to a single question, and participants may not have answered it precisely. Third, the DEXA scan has some limitations in BMD evaluation in elderly men, like spine osteoarthritis and aortic calcification that may cause underestimation of the real prevalence of low BMD. However, this study might be the first study to evaluate the association between sarcopenia and BMD and HRQoL using data from a large representative sample of Korean men.
In conclusion, our study demonstrated the risk for sarcopenia increased as BMD decreased in Korean men. In addition, sarcopenic subjects tend to suffer from poor quality of life, especially in mobility and usual activity. Attention and evaluation for sarcopenia are needed in subjects showing low BMD to prevent and manage poor quality of life.