INTRODUCTION
Obesity is increasing world-wide and the World Health Organization has already declared obesity a global epidemic that constitutes a major health problem.1) Obesity is an important risk factor for cardiometabolic disease including type 2 diabetes, dyslipidemia, hypertension, cardiovascular disease (CVD) and metabolic syndrome (MS). MS is the most useful and widely accepted description of the metabolic cluster which is related to cardiovascular risk factors and diabetes.2)
Total body fat (indicated by body mass index [BMI]) or central obesity (indicated by waist circumference [WC]) was the most widespread index to diagnose obesity.3) However, different regional fat depots have different effects on lipid and glucose metabolism and many devices were invented to measure body fat distribution. Recent studies have focused on understanding the mechanisms of how specific adipose tissue depots or regional fat distribution patterns impact cardiometabolic risk.4,5) A small number of studies have also demonstrated that greater fat mass distributed in appendicular sites (e.g., legs), which is indicative more of a gynoid body shape, appears to be beneficial or protective against subclinical atherosclerosis or CVD as compared with central obesity.5)
Dual-energy X-ray absorptiometry (DEXA), computed tomography (CT) and magnetic resonance imaging (MRI) are very accurate and sensitive to measure body fat composition.6) DEXA can non-invasively show total, trunk, arms or legs fat mass excluding bone mineral content. In addition, it is more readily accessible, inexpensive and rapid than CT or MRI and it carries a low radiation exposure.7)
The primary purpose of this study is to examine the relationship between body fat patterns as measured by DEXA and metabolic risk factors. The secondary purpose is to disclose whether there is any difference between groups with and without MS.
METHODS
1. Study Subjects
The study participants were patients over 19 years old who visited a general hospital from June 2009 to January 2012. Participants with any malignancy, chronic liver disease or endocrine diseases which could influence their weight were excluded from the study.
2. Measurements
Body weight and height were measured to the nearest 0.1 kg and 0.1 cm with an automated scale. BMI was calculated by Quetelet index (kg/m2). WC was measured with a flexible tape at the mid-level between the lower ribs and the iliac crest while participants were standing on their feet. Systolic blood pressure (SBP) and diastolic blood pressure (DBP) were measured by automatic sphygmomanometer after the participants rested for at least 10 minutes.
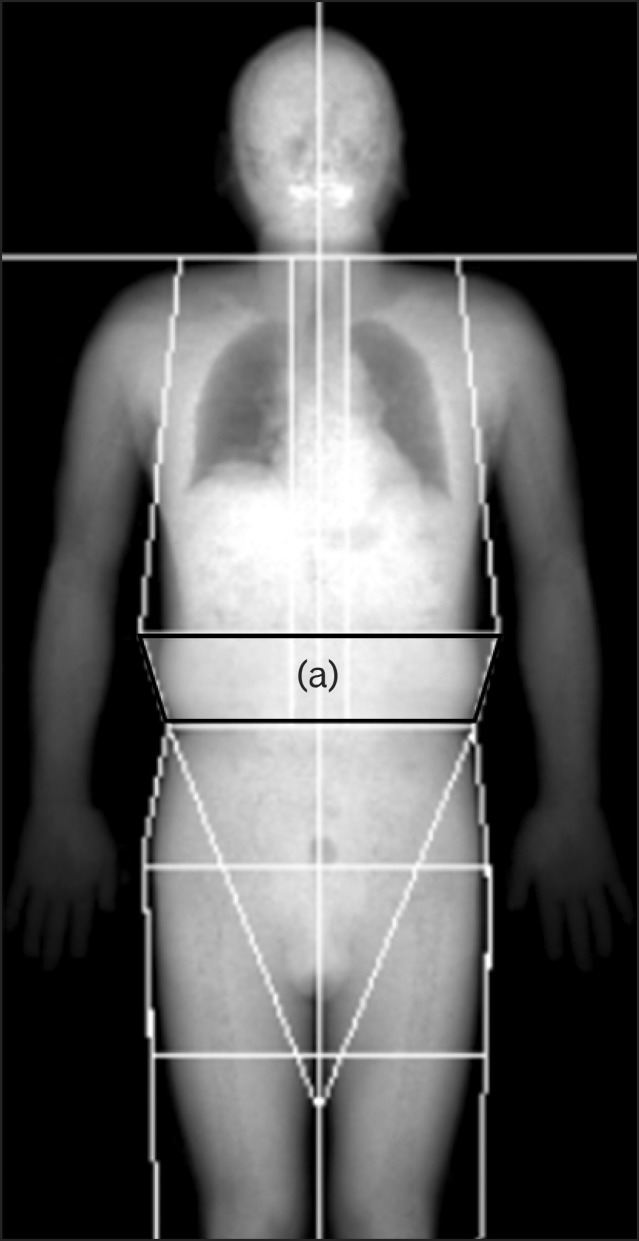
A whole body DEXA scan was performed for each participant in the supine position to measure total and regional body fat mass (g) and total body fat percentage (%) using DEXA ver. 13 (Lunar IDXA; GE healthcare Korea, Seoul, Korea). Measurement of regional fat mass is seen in Figure 1. Site of android fat was determined by 3 borderlines: the lower border defined as the horizontal line connecting both iliac crests, the upper border defined as 20% above the lower borderline to the horizontal line of the chin, and the lateral border line as lateral margins of the waist.
Regional body fat percentage (%) was calculated by regional fat mass (g) divided by total fat mass (g). By using measured regional and total body fat mass (g), android fat mass/total fat mass (%) and appendicular fat mass/total fat mass (%) were calculated.
For evaluation of metabolic risks, blood samples were obtained after 12 hours fasting to measure serum glucose, hemoglobin A1c (HbA1c), total cholesterol, triglyceride (TG), low density lipoprotein (LDL) cholesterol, high density lipoprotein (HDL) cholesterol and insulin. Homeostasis model assessment of insulin resistance (HOMA-IR) was calculated using the following formula: HOMA-IR = fasting insulin (┬ĄU/mL) ├Ś fasting glucose (mg/dL) / 405.8)
MS was defined according to criteria established in the American Heart Association/National Heart, Lung, and Blood Institute.9) Participants with three or more of the following 5 criteria were defined as having MS: central obesity, elevated TG (Ōēź150 mg/dL or on medication for elevated TG), low serum HDL cholesterol (men < 40 mg/dL, women < 50 mg/dL or on medication for reduced HDL cholesterol), blood pressure Ōēź 130/85 mm Hg or on antihypertensive drug treatment, fasting glucose Ōēź 100 mg/dL or on drug treatment for elevated glucose). Central obesity was defined according to the Korean Society for the Study of Obesity (Ōēź90 cm for men, Ōēź85 cm for women).10)
3. Statistical Analysis
The participants were divided into two groups, with and without MS. Differences in variables between the two groups were investigated by using an independent t-test or chi-square test. Logarithmic transformation was used to analyze variables of insulin and HOMA-IR. Partial correlation analyses adjusting for age, sex, and smoking history were performed to determine the relationship between metabolic parameters and total or regional fat percentage. In addition, we investigated whether there is any difference in these relationships between groups.
All analyses were two-tailed and P < 0.05 was considered statistically significant. The statistical analyses were performed using SPSS ver. 12.0 (SPSS Inc., Chicago, IL, USA).
RESULTS
1. Baseline Characteristics
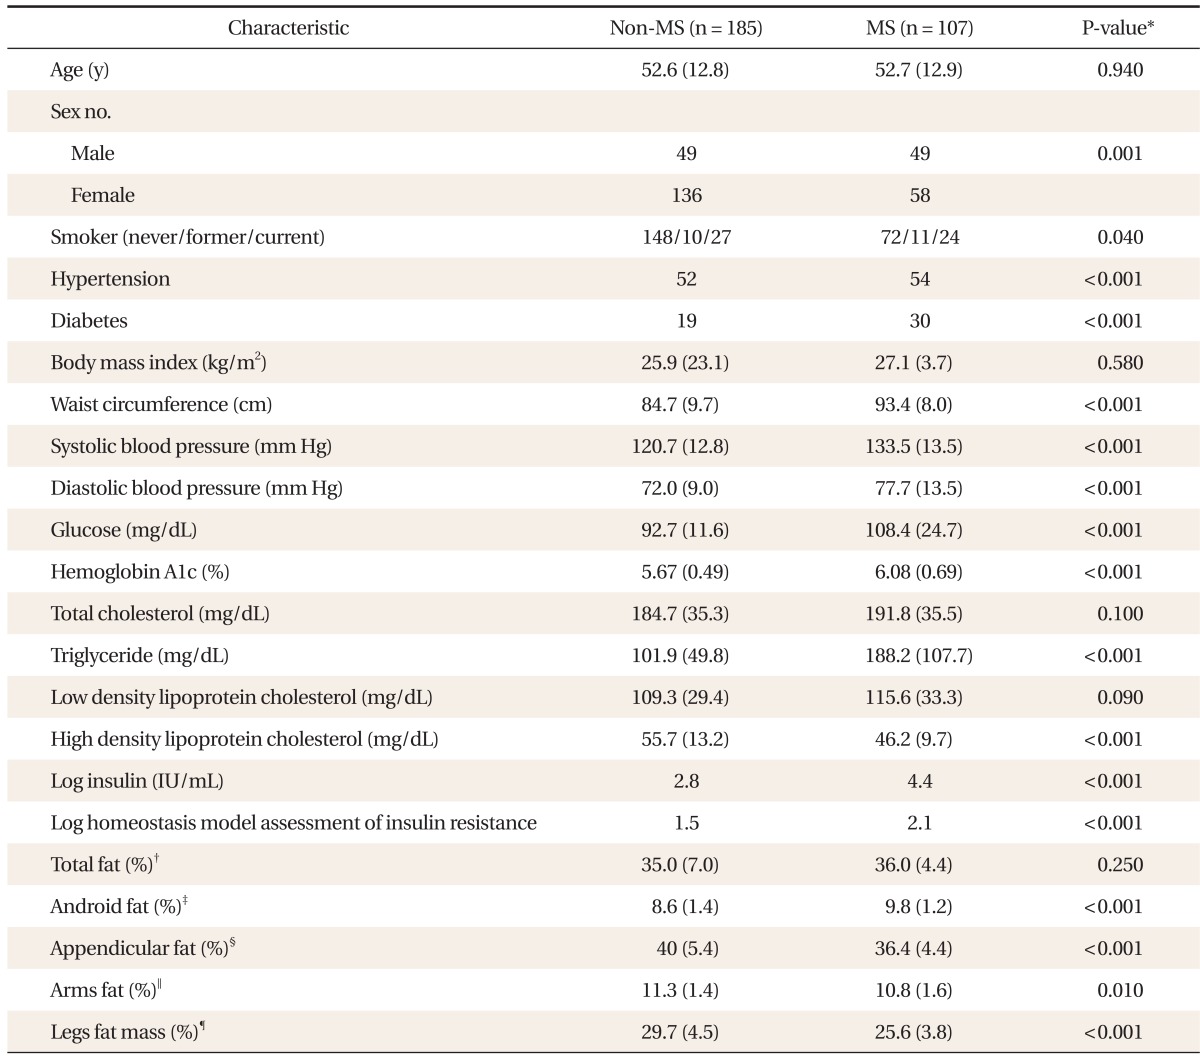
Of the total 292 participants, 107 participants (36.6%) were diagnosed with MS. BMI and total fat (%) did not show any significant difference between with and without MS. Android fat (%) was significantly higher in MS group. In contrast, arm fat (%), leg fat (%) and appendicular fat (%) were significantly lower in MS (Table 1).
2. The Correlation between Metabolic Risk and Total or Regional Fat Percentage
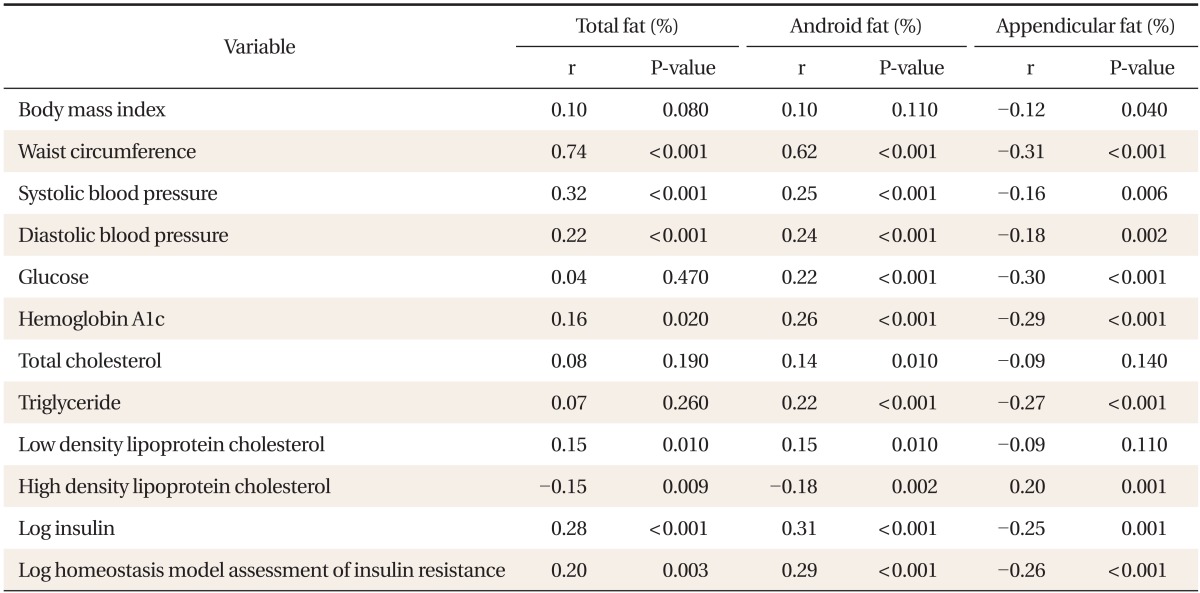
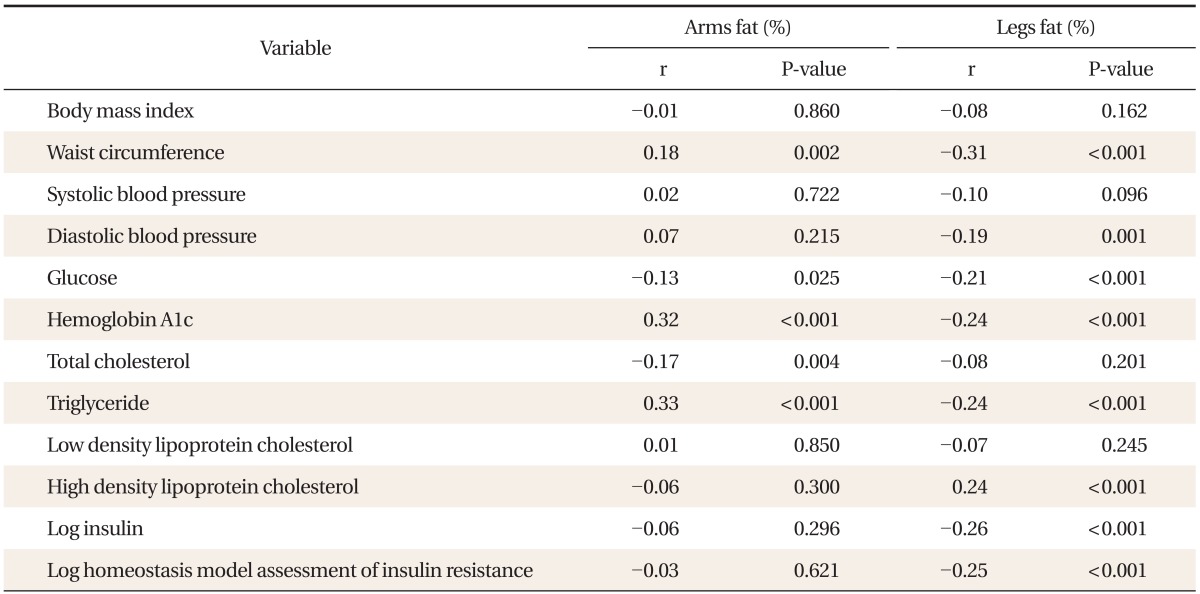
Total fat (%) was positively correlated with WC, SBP, DBP, HbA1c, LDL cholesterol, and log insulin, and negatively correlated with HDL cholesterol. Android fat (%) had a positive correlation with WC, SBP, DBP, glucose, HbA1c, TG, LDL cholesterol, and log insulin, and had a negative correlation with HDL cholesterol. Appendicular fat (%) had a negative correlation with WC, SBP, DBP, glucose, HbA1c, TG, and log insulin, and had a positive correlation with HDL cholesterol. The negative correlation between appendicular fat and metabolic risk was attributed to leg fat (%) (Tables 2, 3).
3. The Comparison of the Effect of Appendicular Fat on Metabolic Risk between with and without MS Groups
In non-MS, appendicular fat (%) was negatively correlated with WC, DBP, glucose, HbA1c, TG, LDL cholesterol, log insulin, and log HOMA-IR. However, significant association was not observed between appendicular fat (%) and metabolic risk except for SBP, glucose and log insulin in MS (Table 4).
DISCUSSION
The purpose of this study was to examine the relationship between body fat patterns as measured by DEXA and metabolic risk factors and whether there is any difference between groups with and without MS. Obesity is known to be related with type 2 diabetes, dyslipidemia, hypertension, and cardiovascular disease. It has been recently established that excess accumulation of visceral fat is positively correlated and appendicular fat is inversely correlated with metabolic risk factors.4,11,12,13,14,15,16)
In this study, android fat was a highly contributable index to MS and had a stronger correlation than total body fat. However, appendicular fat decreased the risk of MS and the protective effect of appendicular fat was mostly attributed to leg fat. These results correspond with those of previous studies.14,15,16)
Another important finding in this study is that the protective effect of appendicular fat in the non-MS group was not characteristic in the MS group. In previous studies, leg fat (especially thigh fat) had a favorable effect on metabolic risk factors.14,15,17) But previous investigators did not compare the effects of appendicular fat on metabolic risk in those who had MS versus those who did not. In this study, we suppose that the protective effect of leg fat on metabolic disturbance may change after developing MS.
Goodpaster et al.18) partitioned the mid-thigh area measured by CT into 3 components: subcutaneous adipose tissue (SCAT), adipose tissue beneath the fascia, and adipose tissue infiltrating muscle groups (IMAT). IMAT was significantly related to insulin resistance. They assumed that adipose tissue interspersed in and around skeletal muscle might impair muscle blood flow, reduce insulin diffusion capacity, or increase local concentrations of fatty acids. Our results support the hypothesis that when MS occurs, leg fat accumulates as IMAT rather than SCAT and loses the favorable effect on lipid and glucose metabolism.
Another mechanism is possible. Subcutaneous adipose tissue under healthy conditions sequesters non-esterified fatty acids released from adipose tissue and dietary sources.19) However, under certain pathological conditions such as obesity, there is a down-regulation of lipid storage to subcutaneous depots resulting from a maladaptive response to postprandial increase in fatty acids.20) This may cause the development of ectopic lipid deposits (e.g., liver, skeletal muscles, and pancreas) known to be adversely associated with both hepatic and peripheral insulin sensitivity.19,20,21) Other evidences also suggest that adipose tissue infiltration in skeletal muscle is associated with greater circulating inflammatory markers and may contribute to insulin resistance and other cardiometabolic risk factors.22,23)
Our results also show that android fat and appendicular fat are significant contributors to MS, whereas BMI and total body fat percentage are not different whether MS is present or not. Although measuring WC is a very simple and good method that represents central obesity, it is important to measure waist-hip ratio (WHR) together. An increase of WHR may be due to not only to higher WC but also lower hip circumference. A less thigh fat was noted in both men and women with increased visceral fat.24) Larger hip circumference represents more leg fat mass and leg lean mass.11) A recent meta-analysis confirms that WHR is superior to WC to discriminate obesity-related cardiometabolic risk.25) Only measuring WC did not allow detection of the decrease of hip circumference or leg fat which might influence metabolic risk.
This study did not identify the protective effect of lean body mass against MS that was reported in previous studies.26,27)
Our study has a few limitations. First, DEXA cannot separate subcutaneous fat from intramuscular fat in each region of body. And measurements on obese participants are more prone to error than those on non-obese participants because of the overlapping site of the regional fat measurement.28) But several studies show that trunk fat amount measured by DEXA correlated significantly with visceral abdominal fat measured by CT and reflected most of the risks.13,29) Second, we did not adjust for exercise, alcohol drinking, nutrition or physical activity, which may affect metabolic risk factors. Further research is needed to include large participant groups and investigate the correlation between sectioned leg fat and metabolic risk factors.
In spite of limitations, our study has some strengths. There were few studies that tried to identify the effect of appendicular fat in Asians including Koreans. We analyzed the effect of appendicular fat on the metabolic risk factors between groups with MS and without MS and found that the protective effect of appendicular fat decreased in the group with MS.
In conclusion, android fat and appendicular fat were associated with MS in this study. And the protective effect of appendicular fat against metabolic risk factors in non-MS was not characteristic in MS. These results suppose that the metabolic influence of adipose tissue is not homogeneous across regions or over the course of MS.