INTRODUCTION
Cardiovascular disease (CVD) is the second-leading cause of deaths at the rate of 48,185 per 100,000 (19.5%) in Korea.1) The rate of population with risk factors of CVD (i.e., hypertension, diabetes mellitus, obesity, etc.) was increased to 65.9% among Korean adults above twenty.2) The American Heart Association (AHA) defined seven health metrics (smoking, body mass index, physical activity, health diet, total cholesterol, blood pressure, and fasting plasma glucose) in 2010,3) and several studies published trends in cardiovascular metrics of United States adults.4-7)
In Korea, the prevalence of four cardiovascular risk factors (hypertension, hypercholesterolemia, diabetes, and smoking status) in adults was studied by the Korea Medical Insurance Corporation study in 1998.8) But there is insufficient research on the prevalence and trends of the seven cardiovascular metrics in South Korea in the 2000s. It can be expected that grasping the trends of the newest cardiovascular metrics is the key to reducing CVD mortality.
Korean Centers for Disease Control and Prevention have conducted a series of national surveys regarding the health and nutrition of the Korean population, called the Korean National Health and Nutrition Examination Survey (KNHANES) since 1998. This study examined each trend in seven cardiovascular health metrics of the population in 2005, 2007, 2008, and 2009 using the KNHANES database. We tried to interpret the trend and to suggest a strategy of cardiovascular health promotion based on it.
METHODS
1. Korean National Health and Nutrition Examination Survey
The KNHANES is a cross-sectional, stratified, and multi-stage survey of representative samples of the non-institutionalized Korean population taken since 1998. It comprises a health interview survey, health behavior survey, medical examination, and nutrition survey. For trends in cardiovascular health metrics, we used data from KNHANES III 2005 (n = 34,145), and KNHANES IV 2007 (n = 4,594), 2008 (n = 9,744), and 2009 (n = 10,533).
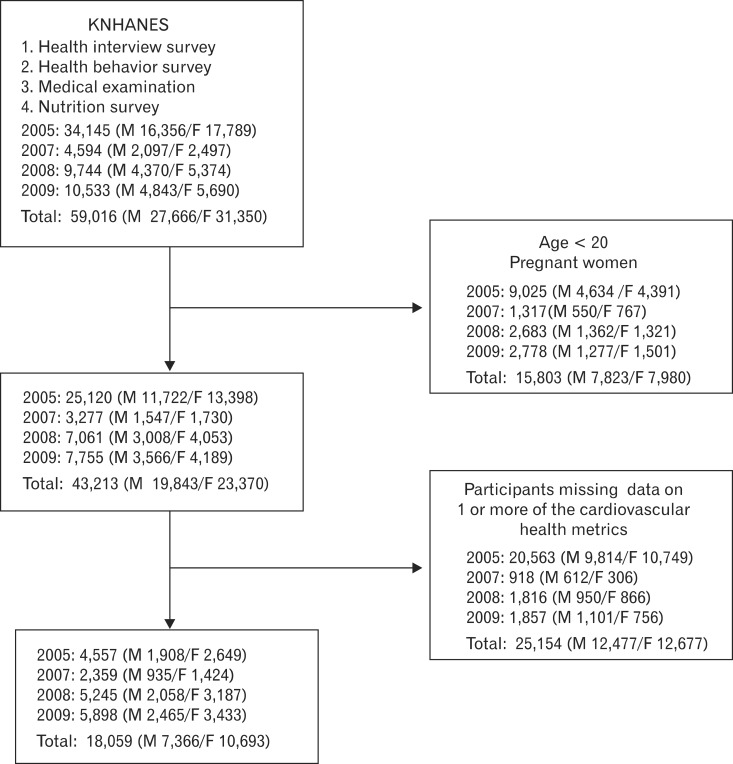
Figure 1 shows the flow of the number of subjects. The participants of KNHANES were supposed to respond to 4 examinations (health interview survey, health behavioral survey, medical examination, and nutritional survey). Age, sex, current disease, and its medication were included in the health interview survey, and smoking and physical activity were questioned in the health behavioral survey. Blood pressure, body mass index, fasting blood glucose, and total serum cholesterol was measured during a medical examination, and healthy diet under the nutritional survey. Non-pregnant subjects 20 years or older were selected for this study and we count the number of participants responding to each cardiovascular health metric and use this data for analysis of trends. The participants who have all information on the seven health metrics were included for analysis of the sum of the health metrics. In this study, KNHANES I and KNHANES II were excluded because they had quite different questionnaires in the health behavior survey from the recent KNHANES.
2. Definition of Cardiovascular Health Metrics
The AHA defined ideal, intermediate, and poor cardiovascular health metrics for adults.3) Data from KNHANES III and IV includes the health metrics information, and the data was arranged according to the health metrics defined by AHA with modifications of body mass index, physical activity, and healthy diet.
The subgroup of smoking status is classified as never-smoking group, former-smoking group, and current-smoking group. The smoker was defined as a participant who has smoked over 100 cigarettes. The AHA definition of ideal smoking status includes never-smokers and former smokers who had not smoked for at least 12 months.3) KNHANES III included information from the time of quitting smoking and it was reflected in ideal smoking status. However, the time of quitting smoking is not described in the questionnaire from KNHANES IV. We classified 'never,' 'former,' and 'current' categories as 'ideal,' 'intermediate,' and 'poor' status, respectively in KNHNES IV. Smoking score is classified as either ideal (never and former: quit at least 12 months ago [1 point]), or poor (current smoking and former: quit within 12 months [0 point]) in KNHANES III, and as ideal (never [1 point]) or poor (former or current smoking [0 point]) in KNHANES IV.
Physical activity was converted into numerical values with calculation of metabolic equivalents (METs, min/wk) by utilizing sum of activities per week and its duration time. The physical activity questionnaire of KNHANES consists of duration and the number per week of vigorous activities, moderate activities, and walking. The total METs (min/wk) is the sum of vigorous METs (min/wk) multiplied by 8, moderate METs (min/wk) multiplied by 4, and walking METs (min/wk) multiplied by 3.3.9) We defined the subjects as physically active (ideal [high] category) if their vigorous activity on at least 3 days achieved a minimum total physical activity of at least 1,500 METs (min/wk) or 7 or more of any combination of walking and moderate or vigorous activities achieving a minimum total physical activity of at least 3,000 METs (min/wk).9) The intermediate category is defined as 3 or more days of vigorous activity of at least 20 minutes per day, 5 or more days of moderate activity and/or walking of at least 30 minutes per day, or 5 or more days of any day combination of walking, moderate or vigorous activities achieving a minimum total physical activity of at least 600 METs (min/wk).9) Those individuals who did not meet criteria for intermediate or vigorous category were considered to have a low physical activity level.9) For calculation of health metrics, the intermediate physical activity group and low physical activity group were merged with the poor group.
The healthy diet score of AHA is calculated by summing the following items, allotting 1 point each: eating fruits and vegetables(Ōēź4.5 cups/d), fish (Ōēźtwo 3.5-oz servings/wk), fiber-rich whole grains(Ōēźthree 1-oz equivalent servings/d), sodium (<1,500 mg/d), and sugar-sweetened beverages (<36 oz/wk).3) However, it is difficult to estimate the healthy diet score based on the food frequency questionnaire (FFQ) of KNHANES. Nutritional data of KNHANES includes total daily calories and each nutrition fact (i.e., daily protein, daily carbohydrates, daily fat, etc.) individually converted from FFQ. According to the guideline for the DASH (Dietary Approaches to Stop Hypertension) diet,10) we set up the new healthy diet score modified by the Korean diet guidelines for dyslipidemia:11) total daily fat consumption < 35% of total calories, total daily protein consumption > 15% of total calories, total daily carbohydrate consumption < 55%, total daily sodium consumption < 2,300 mg, and total daily fiber consumption > 20 g. Although AHA defines a healthy diet as meeting the above on 4 out of 5 points, we dichotomized the healthy diet score as fewer than 2 vs. 2 or more. A healthy diet score was defined as 2 points or greater owing to the paucity of the participants with a score of 3 or greater (range, 12.4% to 15.2%). Such a healthy diet score system was applied similarly in a previous study.4)
The values of fasting plasma glucose and total serum cholesterol were available as part of the medical examination of KNHANES participants. We classified subgroups of fasting plasma glucose level as an ideal group (fasting plasma glucose < 100 mg/dL), intermediate group (100 mg/dL Ōēż fasting plasma glucose < 126 mg/dL), and poor group (fasting plasma glucose Ōēź 126 mg/dL). Similarly, we classified subgroups of serum total cholesterol level as an ideal group (total serum cholesterol < 200 mg/dL), intermediate group (200 mg/dL Ōēż total serum cholesterol < 240 mg/dL), and poor group (total serum cholesterol Ōēź 240 mg/dL). The participants who take lipid-lowering medication were excluded among the ideal group.
The participants for KNHANES III, IV's blood pressure was taken and we used the mean blood pressure of the three measurements. We classified subgroups of blood pressure into an ideal group (systolic blood pressure < 120 mm Hg and diastolic blood pressure < 80 mm Hg), intermediate group (120 mm Hg Ōēż systolic blood pressure < 140 mm Hg or 80 Ōēż diastolic blood pressure < 90 mm Hg), and poor group (systolic blood pressure Ōēź 140 mm Hg or diastolic blood pressure Ōēź 90 mm Hg). The participants who take antihypertensive medication were excluded among the ideal group.
Although ideal body mass index was defined as < 25 kg/m2 by AHA,3) we redefined ideal body mass index as < 23 kg/m2 based on the opinion that for many Asian populations, body mass index Ōēź 23 kg/m2 represents increased cardiovascular risk.12) We classified subgroups of fasting plasma glucose level as an ideal group (body mass index < 23 kg/m2), intermediate group (23 kg/m2 Ōēż body mass index < 25 kg/m2), and poor group (body mass index Ōēź 25 kg/m2).
We built up a cardiovascular health metrics score (sum of 7 cardiovascular health metrics) by recoding the 7 metrics as dichotomous variables granting 1 point for the ideal category vs. 0 points for the other categories for physical activity, body mass index, total serum cholesterol, blood pressure, and fasting blood glucose. A healthy diet score is classified as (Ōēź2 components [0 point] vs. <2 [1 point]).
All participants were classified as meeting 0, 1, 2, 3, 4, 5, 6, or 7 cardiovascular health metrics. For this score, we excluded participants missing data on 1 or more of the cardiovascular health metrics.
3. Statistical Analysis
KNHANES is a dataset organized by using complex sampling design, and we estimated prevalence of each health metric adjusted by weight of the sample in each year in order to minimize selection bias. We calculated prevalence of each metric of KNHANES III (2005), KNHANES IV (2007), KNHANES IV (2008), and KNHANES IV (2009) by Taylor-linearized variance estimation. Predictive probability of each metric was analyzed by logistic regression with adjustment for age, sex, and residential district. And the predictive probability curve was depicted for tangible trends in each metric divided into male and female chronologically with P for trends calculated by logistic regression. Mean of health metric sum for each year was calculated by analysis of covariance, adjusted for age, sex, and residential district, and its P for trend was tested by linear regression. Data were analyzed using Stata SE ver. 12.1 (Stata Co., College Station, TX, USA) and P < 0.05 was considered statistically significant.
RESULTS
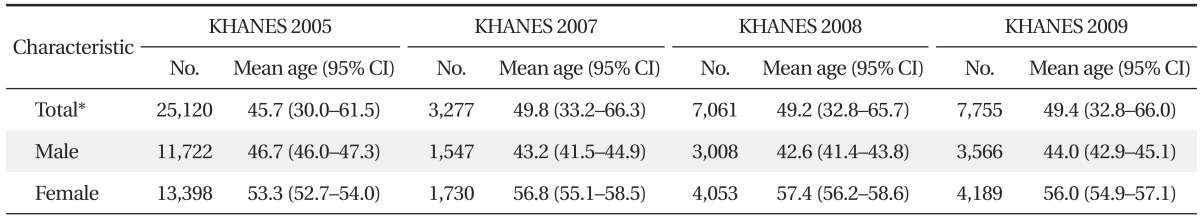
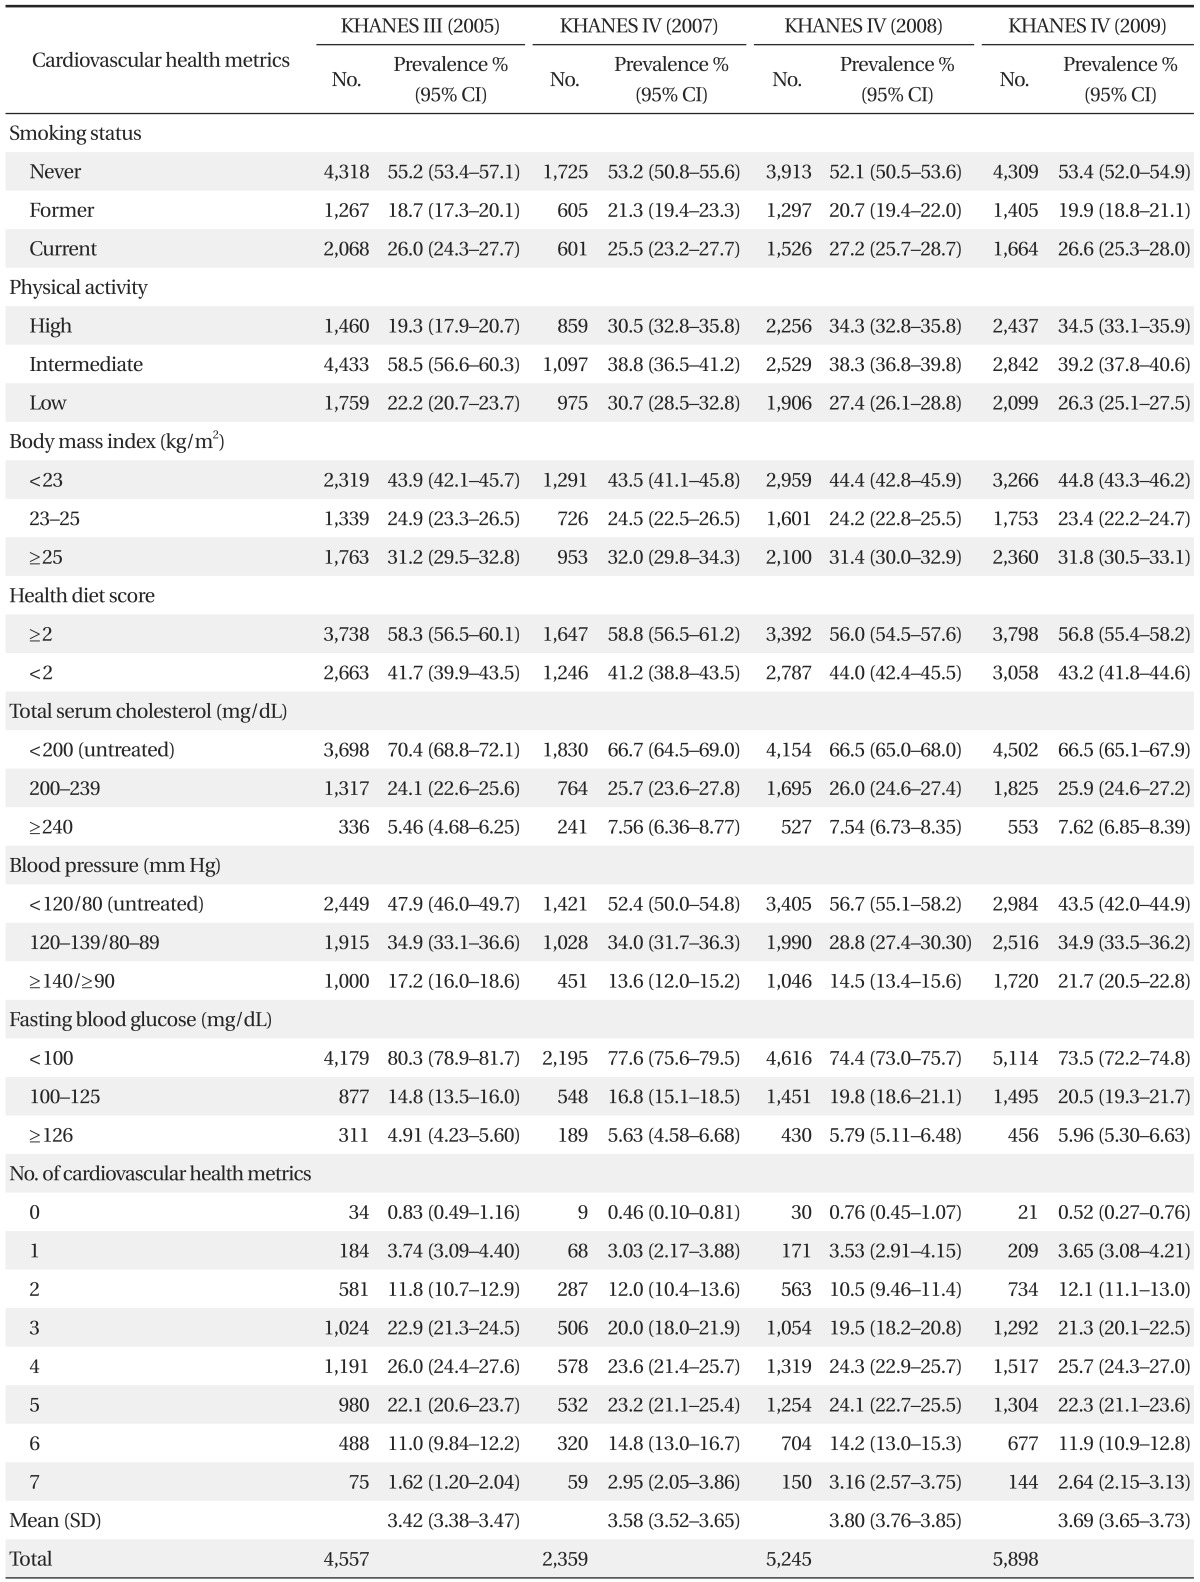
General descriptive characteristics of the study participants are reported in Table 1. As shown in Table 2, the prevalence of a healthy diet slightly declined from 58.3% (95% confidence interval [CI], 56.5% to 60.1%) in KNHANES III (2005) to 56.8% (95% CI, 55.4% to 58.2%) in KNHANES IV (2009). The prevalence of ideal fasting blood glucose and ideal total serum cholesterol declined from 80.3% (95% CI, 78.9% to 81.7%) in NHANES III (2005) to 73.5% (95% CI, 72.2% to 74.8%) in KNHANES IV (2009), and from 70.4% (95% CI, 68.8% to 72.1%) in NHANES III (2005) to 66.5% (95% CI, 65.1% to 67.9%) in KNHANES IV (2009), respectively. The prevalence of desirable physical activity increased from 19.3% (95% CI, 17.9% to 20.7%) in KNHANES III (2005) to 34.5% (95% CI, 33.1% to 35.9%) in KNHANES IV (2009). The prevalence of ideal blood pressure increased from KNHANES III (2005) to KNHANES IV (2008) and acutely in KNHANES IV (2009). The prevalence of smoking standing body mass index remained unchanged. About 3% of participants met all 7 cardiovascular health metrics and about 4% of participants met 1 or no cardiovascular health metrics in each KNHANES.
Figure 2 shows the predictive probability curve for each health metric divided into male and female participants and the trend of total health metrics summed over 2005 to 2009. Predictive probability in this study means a fraction of 1-point people in each health metric, and high predictive probability means a better health metric score and health status. Health status of smoking, body mass index, blood pressure, and fasting blood glucose in females is superior to that in males. On the other hand, healthy status of physical activity is better in males. Curve of healthy diet and total serum cholesterol shows similar trends between males and females.
The health metric score of smoking in males went on improving in 2007 but has been sluggish since then (P-value for trends < 0.001). Physical activity status showed an improving curve both in males and females (P-value for trends < 0.001). Health diet status looks like a downslope both in males and females with significance only in males (P-value for trends = 0.002). Body mass index went better in females (P-value for trends = 0.03) while remaining unchanged in males.
The curve of fasting blood glucose showed deterioration both in males and females (P-value for trends < 0.001) while total serum cholesterol was stagnant. Blood pressure showed an up-slope until 2008 but an acutely down-slope in 2009 for both males and females (P-value for trends < 0.001). The total score of health metrics were close to 4 and didn't show significant change through the years.
DISCUSSION
In this study, we tried to show trends of cardiovascular health metrics using data of nationally representative samples. Although we made an effort to apply AHA's definition to our study, some metrics (i.e., smoking, physical activity, healthy diet) were redefined owing to limitations of the questionnaire. However, we applied them to evidence-based criteria that were close to AHA' s definition. We expect the development of public health services by gaining a greater understanding of the current state of Korean cardiovascular health metrics.
The prevalence of smoking was found to be decreasing in this study. Because former smokers who quit smoking over 12 months ago were left out in KNHANES IV (2007, 2008, and 2009), unlike KNHANES III (2005), the number of nonsmoker was underestimated. KT&G (Korean Tobacco & Ginseng) was privatized in 2001 and the price of cigarettes has been rising steadily. The government established the New Health Plan 2010 including major tasks of public services against smoking in 2003 and non-smoking areas have been extended.13) These national projects against smoking have been progressing vigorously and individual smoking habits might be influenced by such policies.
Physical activity improved both in males and females significantly. This favorable phenomenon came from expansion of public sports facilities. Public sports facilities have increased in number rapidly since 2003. The number of public sports facilities was 13,968 in 2009 compared to 8,717 in 2005, and the area of sports facilities per capita was 2.88 m2 in 2009 compared to 1.92 m2 in 2005.14)
The healthy diet score shows deteriorating trends in males (P-value for trends = 0.002). The diet pattern of Korea is classified under two patterns: traditional and modified. The traditional pattern consists of rice, vegetables, Kimchi, and seaweed while the modified pattern consists of noodles, bread, pizza, hamburgers, fruits, and fish. The traditional pattern has tended to dominate so far, but the modified pattern has increased among young urban people.15) The changed pattern such as high fat content was related to the unhealthy dietary change.
Body mass index has improved in females while being stationary in males. In another study with KNHANES, decrease of body mass index in females is caused by growth of the underweight fraction (body mass index < 18.5 kg/m2) in females aged 30 to 49 years.16) This is not a healthy shift because all-cause mortality was lowest in women with a body mass index of 23.0 to 24.9 and women with a body mass index of less than 18.5 had increased all-cause mortality.17) Although the curve of body mass index moved to 1 in this study, it was considered as deterioration with respect to all-cause mortality.
The proportion of unhealthy fasting blood glucose showed a steadily upward trend. The prevalence of type 2 diabetes has increased steadily in Korea since 197018) and this phenomenon can be considered an extension of this trend. This trend is common in Asian people who experienced hardship when their countries were developing.19) Stresses during the intrauterine period lead to later susceptibility to diabetes through alteration in expression of the genome with DNA codes intact, a process called epigenetics.20)
Total serum cholesterol was stationary both in males and females. However, the prevalence of dyslipidemia and metabolic syndrome has grown up at this time.21-23) Dyslipidemia was defined as total serum cholesterol Ōēź 240 mg/dL or high density lipoprotein (HDL) cholesterol < 40 mg/dL or triglyceride Ōēź 200 mg/dL or low density lipoprotein (LDL) cholesterol Ōēź 160 mg/dL and the lipid profile of metabolic syndrome was defined as triglyceride Ōēź 150 mg/dL and HDL cholesterol < 40 mg/dL (in male) and <50 mg/dL (in female). While total cholesterol was unchanged, its profile worsened. Populations with low HDL cholesterol increased in particular.21)
For decades, the prevalence of hypertension has been stable or reduced in developed countries, whereas it has increased in developing countries.24) Although the curve sloped downward steeply in 2009, blood pressure showed an increasing tendency for a higher healthy score. There is another study that showed that the prevalence and incidence of hypertension in Korea had a downward tendency from 2003 to 2008.25) However, the sudden increase in 2009 cannot be explained and it should be studied and discussed in the future.
Sum of the health metrics did not show a significant tendency (P-value for trends = 0.127). But this was caused not by a lack of change in each metric but by mutual discrepancy among health metrics. As demonstrated by the increasing trend in the physical activity score, the public health policy is a very important factor for improving cardiovascular health metrics. The policies encouraging physical activity and healthy diet can make overall cardiovascular health metrics better with an ongoing national screening program.
Our study has several limitations. First, although KNHANES selected nationally representative samples of Korean adults, blood sampling was done only in part of the participants and it might limit the ability to estimate the exact prevalence of cardiovascular health metrics in the overall Korean population. Second, as previously stated, the discrepancy in the questionnaires for smoking and physical activity between KNHANES III and KNHANES IV exists. And the criteria for healthy diet are arbitrary and they do not correspond with the AHA definition of a healthy diet completely. However, to our knowledge, Korean diet guideline for dyslipidemia is the only available guideline that can be applied to the existing KNHANES data, and also relevant in terms of cardiovascular health metrics. Third, this study did not include data of KNHANES I (1998) and KNHANES II (2001) due to inconsistent questionnaires. As a result, we studied short-term data gathered over about 5 years and it did not reflect a long-term tendency. Fourth, KNHANES does not have the cardiovascular events and mortality data of the same participants. It is impossible to know how the trends in health metrics have affected CVD incidence and mortality.
In conclusion, we studied trends in 7 cardiovascular health metrics using KNHNES III and IV. The sum of each metric had been stationary but each metric showed various trends. We suggest that the long-term trends should be investigated when the data from KNHANES V, VI become available.