INTRODUCTION
Prediabetes is a strong risk factor of diabetes mellitus and cardiovascular diseases, and its incidence has been increasing in recent decades. Thus, many ongoing studies have evaluated risk factors associated with type 2 diabetes (diabetes). One risk factor identified in multimodal studies on favorite drinks was coffee intake. A study on the active components of coffee reported that chlorogenic acid, a strong antioxidant, might help regulate blood sugar levels and decrease the risk of diabetes. Chlorogenic acid inhibits intestinal glucose absorption and improves insulin sensitivity. However, few studies have been conducted on these active components.1) Several studies and meta-analyses that analyzed the risk of diabetes and cardiovascular diseases have reported the beneficial effect of coffee intake.2) Studies on the effect of coffee on cardiovascular diseases and lipid metabolism have also been conducted in South Korea. Similarly, studies on the effect of coffee preparation and consumption on blood lipid concentrations,3) green coffee bean consumption on low density lipoprotein cholesterol oxidation inhibition, and glycogenesis reduction in overweight or obese women4) have also been reported. However, studies on the effect of coffee intake on diabetes progression are scarce.
In addition to the results of domestic and international studies on coffee intake, results from a large-scale prospective cohort study conducted in the United States were reported in April 2014. The results showed that participants who consumed one cup or more of black coffee per day had the lowest risk of diabetes progression, while those that drank less coffee had the highest risk of progression during the observation period.5) Contrarily, a European study reported in May 2015 that coffee increased the risk of developing impaired fasting glucose in participants cytochrome P450 1A2 polymorphisms and hypertension.6)
However, studies on the effect of coffee on diabetes progression in Koreans are rare. This study analyzed the amount and method of coffee consumption in prediabetic patients who required active lifestyle modifications in order to assess the effects of coffee intake on glycated hemoglobin (HbA1c) levels.
METHODS
1. Study Subjects
This study utilized data from individuals undergoing health checkups at a single medical institution (health examination center of Gangneung Asan Hospital) from April 22, 2003 to June 30, 2014 (n=6,246). Based on the prediabetes definition as HbA1c levels between 5.7%ŌĆō6.4%, 5,528 patients were categorized as prediabetic in the first examination.7,8) Patients previously diagnosed with diabetes, who had a history of diabetes medication use, or who had only one measurement were excluded from the study. Finally, a total of 3,497 patients were included in the analysis. Observation was terminated for patients with baseline HbA1c levels at or above 6.5%. In addition, for non-diabetic cases, the last measurement was recorded as the final observation.
2. Blood and Anthropometric Tests, Social History Investigation, and Variables
Blood tests were performed after a fasting period starting at midnight of the night before. In all health examinations, the subjects wore the same hospital gowns and underwent measurements with the same method and same equipment by a designated examiner assigned to a specific area. Height was measured during full inhalation, with the subjects in bare feet or wearing only thin socks and standing on a horizontal surface with the heels, buttocks, back, and the back of the head lined up against a vertical surface. Measurements were taken from the top of the head and recorded to one decimal place. Weight and height were measured to one decimal place using a scale attached to a horizontal surface. Body mass index (BMI) was calculated as weight divided by the square of the height. Waist circumference was measured with the patient wearing a hospital gown and looking straight ahead, with both arms down. The tape measure was positioned parallel to the thinnest point, and the measurement was recorded to one decimal place. Blood pressure was taken manually after 30 minutes of rest by an examination center nurse; the same sphygmomanometer and stethoscope were used for all study participants. If the systolic pressure was 140 mm Hg or higher, or the diastolic pressure was 80 mm Hg or lower, the blood pressure measurement was repeated 30 minutes later and the new measurement recorded. Social history, including alcohol consumption, smoking status, and physical activity, was assessed based on responses to a self-administered questionnaire.
Variables were selected and divided into subgroups according to standard type 2 diabetes screening test criteria9,10) as well as a study on the prediction of diabetes in Koreans that used data from the national health nutritional analysis.11) Korean criteria were used when the criteria differed from the American version. Diagnostic standards were based on HbA1c levels. According to American Diabetes Association criteria, prediabetic patients were defined as those with HbA1c levels of 5.7%ŌĆō6.4%; 5.7%ŌĆō5.8% indicated low risk, 5.9%ŌĆō6.0% indicated moderate risk, and 6.1%ŌĆō6.4% indicated high risk. HbA1c levels of 6.5% or higher were considered to be indicative of overt diabetes.
The patients were also divided according to smoking status: smokers and non-smokers, including ex-smokers. Group 1 included men with waist circumferences <90 cm and women with waist circumferences <85 cm; group 2 included men with waist circumferences Ōēź90 cm and women with waist circumferences Ōēź85 cm. The subjects were also divided according to blood pressure, including: diastolic blood pressure <90 mm Hg and systolic blood pressure <140 mm Hg, and diastolic blood pressure Ōēź90 mm Hg and systolic pressure Ōēź140 mm Hg. Alcohol consumption was divided as follows, with 13 g of alcohol defined as one glass: <13 g per week, 13ŌĆō64 g per week, and Ōēź65 g per week. BMIs were divided into > or <25 kg/m2 and Ōēź25 kg/m2. Triglyceride and high density lipoprotein (HDL) cholesterol levels were divided into < and Ōēź250 mg/dL and < and Ōēź35 mg/dL, respectively. Age, sex, personal history of hypertension, familial history of hypertension and diabetes, and physical activity were also recorded. The questionnaire used in our hospital defined physical activity as light (office work, <2 hours of walking per day, or small amount of housework), normal (manufacturing, service industry, or 2ŌĆō4 hours of walking per day, or large amount of housework), and heavy (farming, fishing, engineering, or construction work). The subjects self-reported their activity levels.
3. Frequency and Method of Coffee Consumption
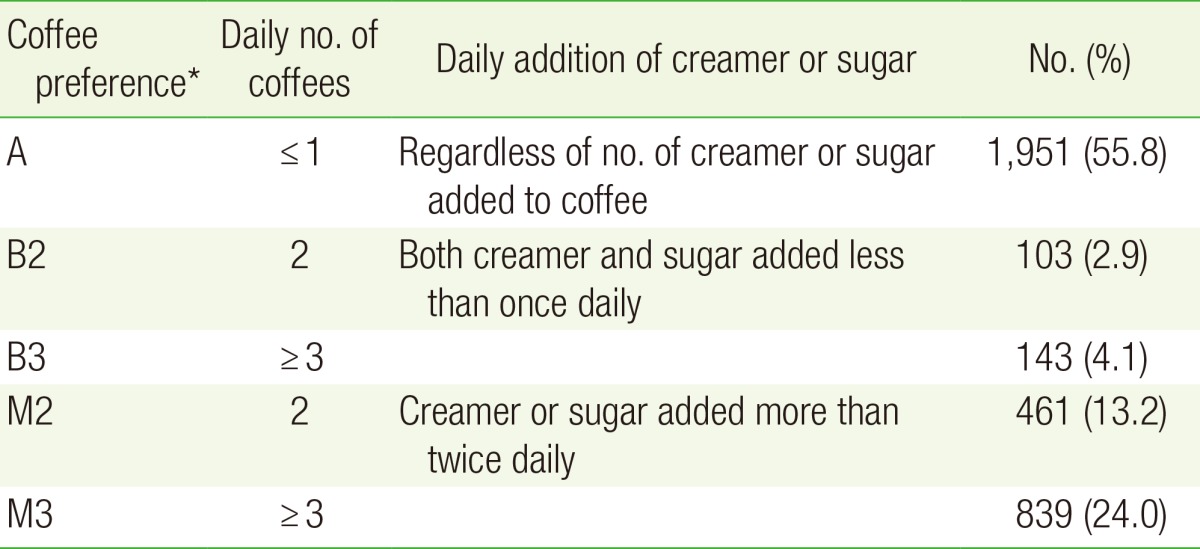
The nutritional questionnaire in this study was a food frequency questionnaire. The consumption frequencies of black coffee and coffee with sugar and creamer were self-reported by the participants. Subgroups were further divided according to the consumption frequency of black coffee and coffee with sugar and creamer as well as the method of coffee consumption (Table 1). The consumption frequencies of black coffee and coffee with sugar and creamer were divided into more than three times per day, twice a day, once a day, five to six times per week, three to four times per week, one or two times per week, two or three times per month, and once or less per month. Subjects who reported drinking coffee Ōēż5 or six times per week, as well as those who drank coffee once a day were placed in the 'once or less a day' group. The frequency of coffee consumption and preparation method were defined as follows.
First, the frequency of coffee consumption, regardless of the number of times sugar and creamer were added, were divided into the 'once or less a day' (1), 'twice a day' (2), and 'Ōēźthree times per day' groups (3). Second, the methods of coffee consumption were defined as follows: non-drinkers were defined as subjects who drank coffee once or less per day (A), regardless of the number times that sugar and creamer were added; the 'black coffee preferred twice a day' group: those who drank black coffee Ōēźtwo times a day, with sugar or creamer added once or less (B2); the 'black coffee preferred three times per day' group: those who drank black coffee Ōēźthree times per day with sugar or creamer addition added Ōēżone time (B3); the 'mixed coffee preferred twice a day' group: those who drank a coffee mixed with creamer and sugar Ōēźtwo times per day with sugar or creamer added Ōēźtwo times (M2); and the 'mixed coffee preferred three times per day' group: those who drank mixed coffee Ōēźthree times per day with sugar or creamer added Ōēźtwo times (M3).
4. Statistical Analysis
SPSS Statistics for Windows ver. 17.0 (SPSS Inc., Chicago, IL, USA) was used for statistical analysis. Among 3,497 subjects with baseline HbA1c levels between 5.7% and 6.4%, those with subsequent levels Ōēź6.5% were allocated to the diabetes progression group, while those with lower values in the final measurement were allocated to the diabetes non-progression group. Cross-tabulation analysis was performed to analyze the effect of coffee consumption frequency, method, and other variables on diabetes progression. The analyzed variables included sex, age, waist circumference, systolic and diastolic blood pressures, alcohol consumption, smoking status, amount of physical activity, frequency of sugar and creamer consumption, BMI, triglyceride level, and HDL cholesterol levels. The trend test approximation was also measured for coffee consumption frequency, an ordinal variable, by using linear-by-linear association.
Kaplan-Meier survival analysis was performed for diabetes progression according to coffee consumption frequency and preparation. The variables that significantly affected diabetes progression and the known risk factors identified by previous publications were designated as confounding factors in the cross-tabulation analysis, while Cox proportional hazard analysis was used for correction.
RESULTS
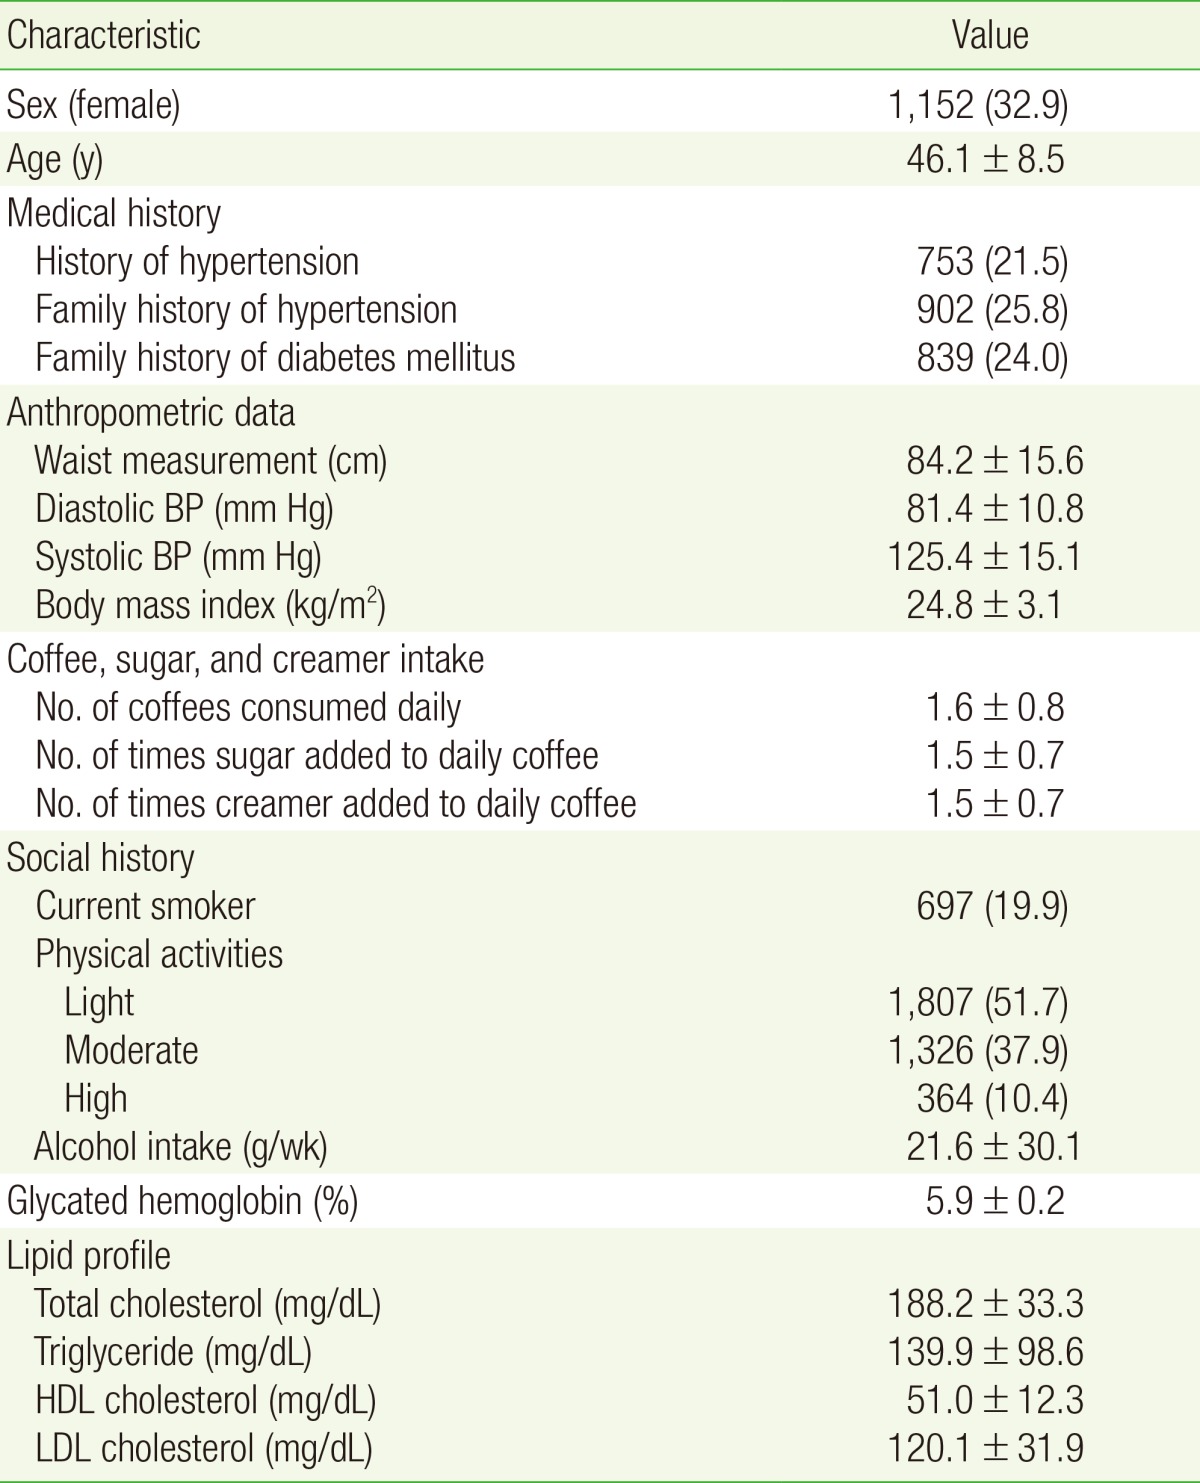
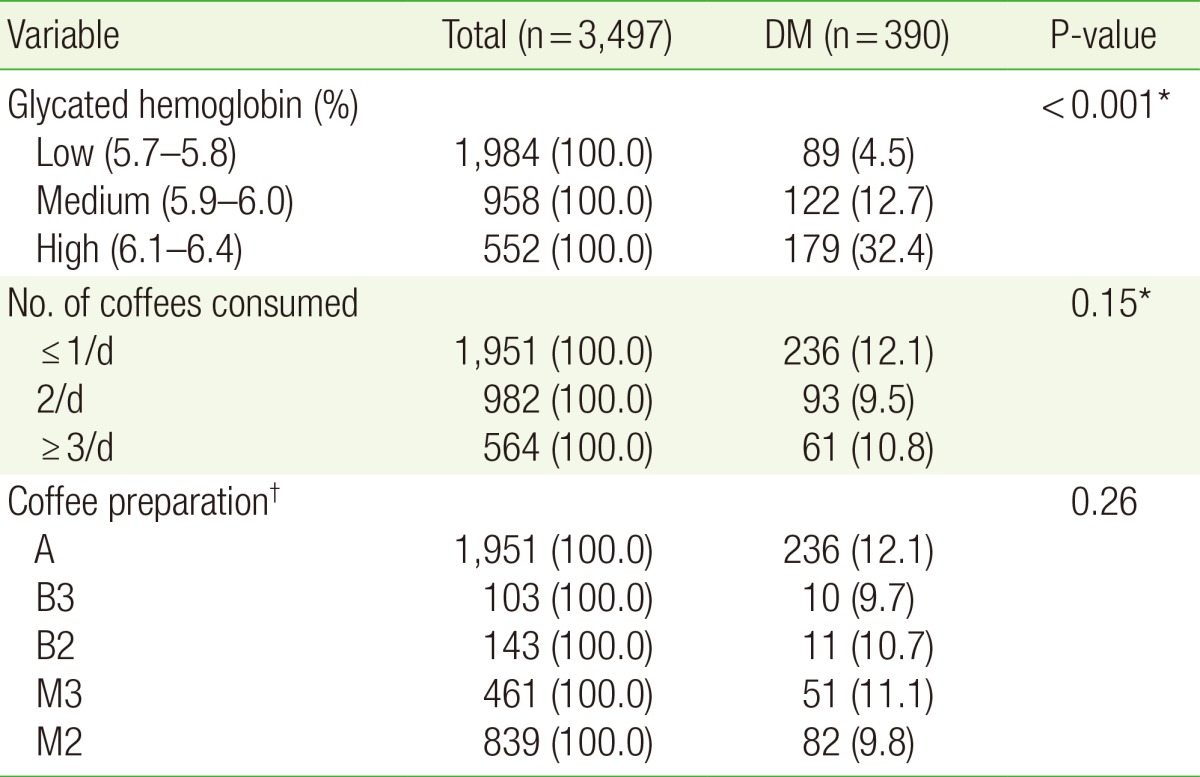
The observation period (mean┬▒standard deviation) was 3.7┬▒2.3 years. The characteristics and baseline values of the 3,497 subjects are shown in Table 2. The mean frequency of coffee consumption 1.6┬▒0.8 times per day, and the mean number of sugar and creamer additions per day was 1.5┬▒0.7 times for both. Of the subjects, 1,951 (55.8%) drank coffee once or less a day, 982 (28.1%) drank coffee twice a day, and 564 (16.1%) drank coffee Ōēź3 times per day.
Cross-tabulation analysis revealed that 390 subjects (11.1%) progressed to diabetes, including 89 (4.5%) low-risk subjects with baseline HbA1c levels of 5.7%ŌĆō5.8%, 122 (12.7%) mid-risk subjects with HbA1c levels of 5.9%ŌĆō6.0%, and 179 (32.8%) high-risk subjects with HbA1c levels of 6.1%ŌĆō6.4%. These findings indicate that higher prediabetic risk levels were associated with higher incidence of diabetes progression. In addition, the variables known as diabetes risk factors all were significantly related to diabetes in the cross-tabulation analysis, except for family history. Diabetes progression was observed in 9.5% and 10.8% of subjects who consumed coffee twice and Ōēźthree times per day, respectively. Both values were lower than the 12.1% who consumed coffee once or less per day, although the difference was not statistically significant. Of the many methods of coffee consumption, those who preferred black coffee (B3 and B2) and those who mixed their coffee (M2 and M3) had fewer subjects who progressed to diabetes than the non-coffee preference group (A), but the difference was not significant (Table 3).
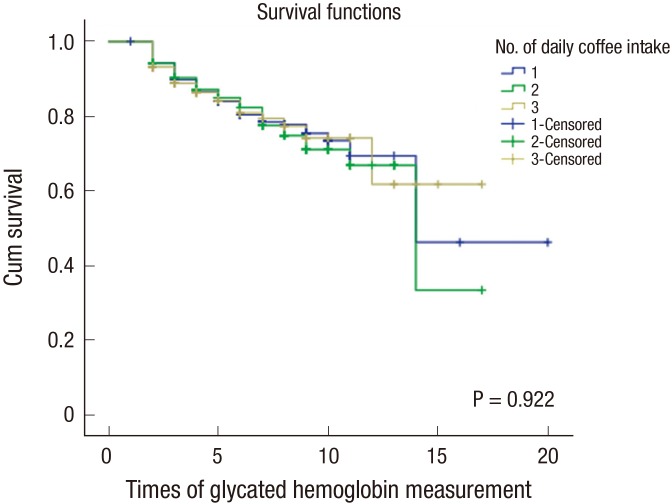
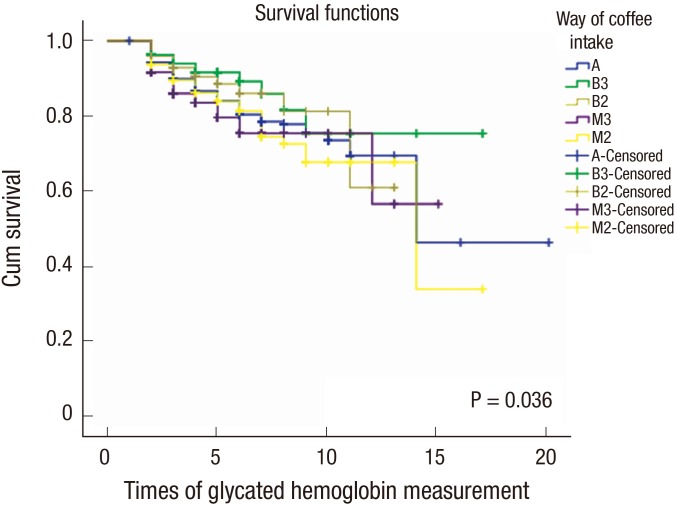
Kaplan-Meier survival analysis of the frequency of coffee consumption revealed that the probability of not progressing to diabetes (cumulative survival) was highest in the following order: Ōēźthree times per day, once or less, and twice a day (three>one>two). However, the 95% confidence intervals of these results were not statistically significant (P=0.922) (Figure 1). Among methods of coffee consumption, the probability of not progressing to diabetes was highest in those who preferred to drink black coffee three or times more per (B3); those who preferred mixed coffee mix twice a day (M2) showed a lower probability of not progressing to diabetes than the those who did not consume coffee (A). Thus, the probability of not progressing to diabetes was highest in the B3 group, followed in order of probability by B2, M3, A, and M2, a statistically significant difference (P=0.036) (Figure 2).
Log-rank analysis of the method of coffee consumption revealed that the 'non-coffee preferred' (A) and 'black coffee preferred Ōēź3 times per day' groups (B3) had a P-value of 0.069. Meanwhile, the 'once or less a day' (A) and 'coffee mix preferred Ōēźthrees times per day' group (M3) had a P-value of 0.072. While these values are not significant in the 95% confidence interval, they are significant in the 90% confidence interval. Of note, the 'black coffee preferred Ōēźthree times per day' and mixed coffee preferred groups (B3 and M3, respectively) showed a P-value of 0.010, which is significantly different from the 95% confidence interval (CI). The log-rank analyses that compared the other consumption methods did not reveal statistically significant results.
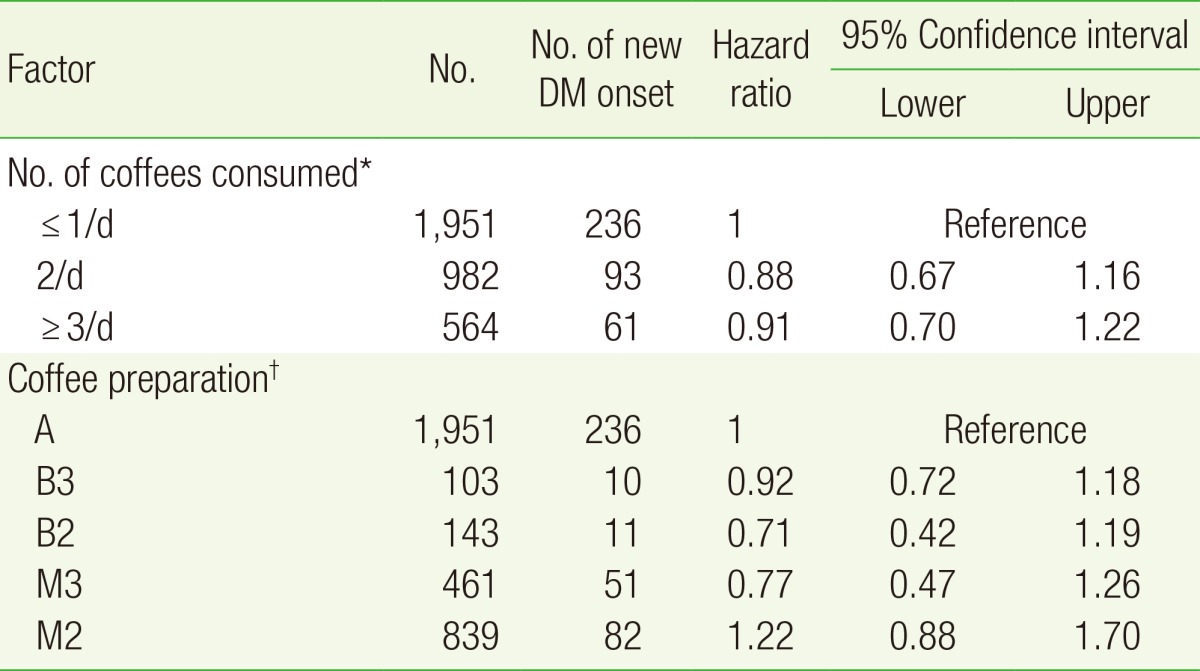
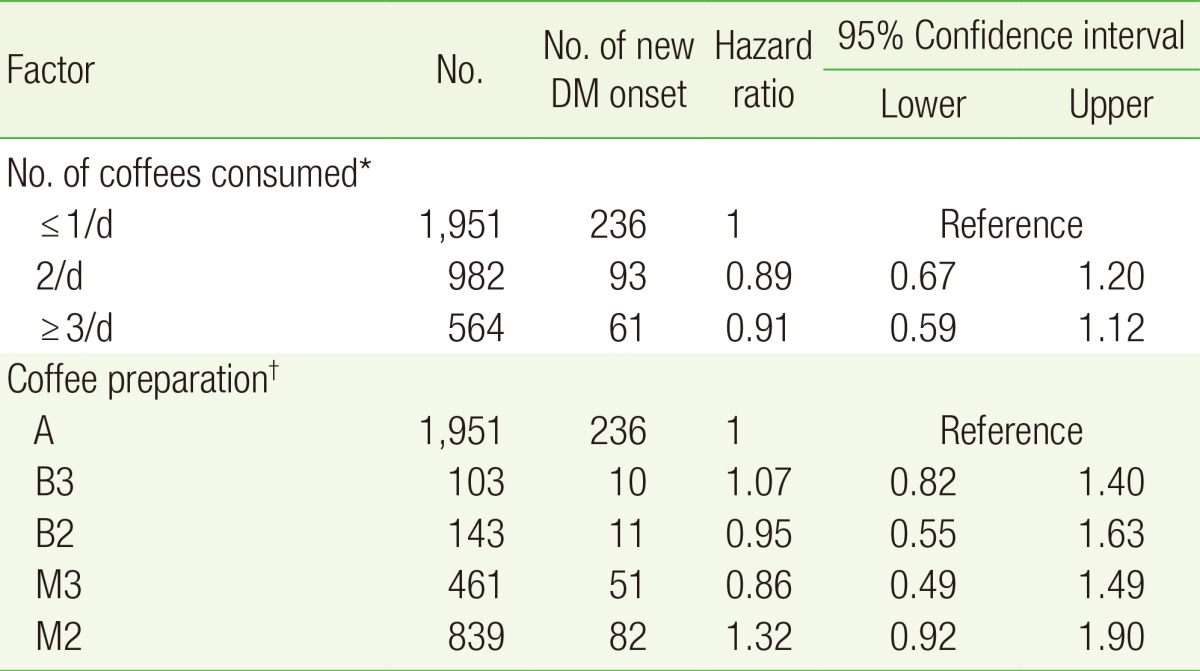
Cox proportional hazard analysis corrected for covariates of the above-mentioned frequency of coffee consumption and methods revealed that consuming coffee Ōēźtwo times a day was associated with a lower risk of diabetes progression than that associated with consuming coffee once per day or less consumption; however, the difference was not statistically significant. The hazard ratios among those who preferred black coffee preferred three times per day and twice per day were 0.92 (P=0.51; 95% CI, 0.72ŌĆō1.18) and 0.71 (P=0.19; 95% CI, 0.42ŌĆō1.19), respectively, which shows a lower risk of diabetes progression than in those who preferred coffee mixed with creamer and sugar and those who did not prefer to drink coffee, but the differences were also not statistically significant (Tables 4, 5).
DISCUSSION
The Kaplan-Meier survival analysis results in this study indicate that consumption of coffee twice or more per day with no added sugar or creamer has a preventive effect on diabetes. However, Cox analysis with correction for confounding factors, including known risk factors in prediabetic patients such as age, BMI, family history of diabetes, hypertension, HDL cholesterol level, triglyceride level, smoking status, alcohol consumption, level of physical activity, and family history of hypertension, which were statistically significant in cross-tabulation analysis, did not reveal a significant association between frequency or method of coffee consumption and diabetes progression (Tables 4, 5). The amount of physical activity was not surveyed in the questionnaire administered to patients in the health examination center of our hospital. Therefore, it was only included as a risk factor in the analysis. Future development of a tool that can quantify physical activity would be a useful addition to the questionnaire currently used in the health examination center of our hospital.
Contrary to the largeŌĆōscale cohort study conducted in the United States that analyzed risks according to changes in coffee consumption, this study performed the analysis based on the baseline measurement. Therefore, additional confirmation was necessary to determine if there were changes in the frequencies of consumption of black coffee and coffee with sugar and creamer between the first and last measurements during the observation period. A paired t-test of the last HbA1c measurement revealed that the consumption frequencies of black coffee, coffee with sugar, and coffee with creamer were 1.7┬▒0.8 (P=0.001), 1.5┬▒0.7 (P=0.912), and 1.6┬▒0.8 (P=0.763), respectively, showing almost no change from the baseline frequencies. Thus, we were able to calculate the risk based on coffee consumption frequency and preparation at the baseline measurement of HbA1c levels. However, future studies might investigate the change in risk factors and amount of coffee consumption.
With the questionnaire used in the health examination center of our hospital made it difficult to determine the actual amount of coffee that was consumed. Thus, the analysis instead considered the number of times that coffee was consumed per day. Based on the American study results, 8 oz., 1.5 cups, or about 360 mL of coffee is recommended to prevent diabetes onset. This volume amounts to about Ōēź3 cups based on the average cup size of 100ŌĆō120 mL in Korea.12,13) The subjects in this study consumed much less coffee that Europeans or Americans. Among those that consumed coffee twice or more a day, only 7% consumed black coffee, while 27% consumed coffee mixed with creamer and sugar. Of these subjects, only 4.2% consumed black coffee; 24% mixed their coffee with creamer and/or sugar Ōēźthree times per day, which is equivalent to one cup in the American study. The large differences between groups may have limited the statistical analysis findings. A randomized study with a controlled number of subjects per group is necessary to evaluate these findings.
The prophylactic effects of coffee intake on diabetes, as reported in the large-scale cohort study conducted in the United States, remain controversial.14,15,16) More studies are needed to determine whether these observations are due to the effects of chlorogenic acid alone on glucose and lipid metabolism, increased weight and waist circumference due to increased consumption of sugar and creamer, or some other mechanism of active component inhibition. Moreover, as observed in a recent European study, personal diabetes risk factors such as genotype must also be considered when determining the effect of coffee intake on glucose regulation.
In this context, this study, though only reflecting the characteristics of residents of eastern Gangwon and Gangneung, determined the coffee consumption frequencies and methods (addition of sugar and creamer) of prediabetic Korean subjects as well as their effects on diabetes progression.17,18,19) Additional studies are necessary to investigate the effects of coffee consumption and habits, including amount, method, and duration, on diabetes progression that also consider the unique characteristics of Koreans.