INTRODUCTION
Osteoporosis is a systemic skeletal disease characterized by low bone mass and microarchitectural deterioration of bone tissue.1) It has become an important health issue worldwide, as its prevalence increases with advancing age. Estimates of the prevalence of osteoporosis vary according to its definition, but the World Health Organization (WHO) has estimated that 30% of all women aged over 50 years (postmenopausal) have osteoporosis according to a definition of bone mineral density (BMD) lower than 2.5 standard deviations from the mean for young healthy adult women at any site.2)
BMD is a major determinant of the risk for bone fracture, which causes serious morbidity and mortality in the elderly.3) Among the several factors that affect bone health, body weight is one of the strongest positive predictors of bone mass.4) It increases bone mass by increasing the mechanical stress on the skeleton, thereby increasing the stimulus for osteogenesis;5) conversely, loss in body weight leads to loss in bone mass. However, how fat mass (FM) and lean mass (LM)ŌĆöthe two major components of body weightŌĆöcontribute to BMD remains debatable.
Several studies have suggested a positive association between LM and BMD in women,6,7,8) while FM has shown an inconsistent association with BMD.8,9,10,11) The subjects of previous studies have mostly been postmenopausal women or the elderly; however, research on the bone health of premenopausal women is also important, since BMD starts decreasing before menopause. Large cross-sectional studies in the Korean population have also reported inconsistent results on the association between FM and BMD.12,13,14) In addition to this inconsistency, the subjects in previous studies were not representative of the general Korean population.
The inconsistency in the association between FM and BMD might be attributable to the complex mechanisms of the effects of FM on BMD. FM is believed to have a positive effect on BMD through the mechanical loading of soft tissue. Meanwhile, FM, especially visceral fat, can affect bone health through hormonal mechanisms; however, the effect of these mechanisms on BMD requires further investigation. Recent studies on the effect of fat distribution on BMD showed an inverse association between visceral fat and BMD in women.15,16)
We hypothesized that LM would be positively associated with BMD, while FM, especially truncal FM (assuming that it contains mostly visceral fat), might show a negative association with BMD after adjusting for the mechanical loading effect. In the present study, we aimed to investigate the association between FM, classified according to its distribution in the body, and BMD in premenopausal women, on the basis of the Korea National Health and Nutrition Examination Survey (KNHANES) IV and V, which represent the general Korean population.
METHODS
1. Subjects
Our cross-sectional study included 5,531 premenopausal women aged 20 years and above, who had undergone dual-energy X-ray absorptiometry (DXA) scans between 2008 and 2011; the study used data from the KNHANES IV and V. The KNHANES, a nationwide survey representing the health and nutritional status of the non-institutionalized civilian population of Korea, consists of health interviews, nutrition surveys, and health examinations. A stratified, multistage probability sampling design was used, and sampling units were based on the geographical area, age, and sex. All subjects provided informed consent prior to their inclusion in the study.17)
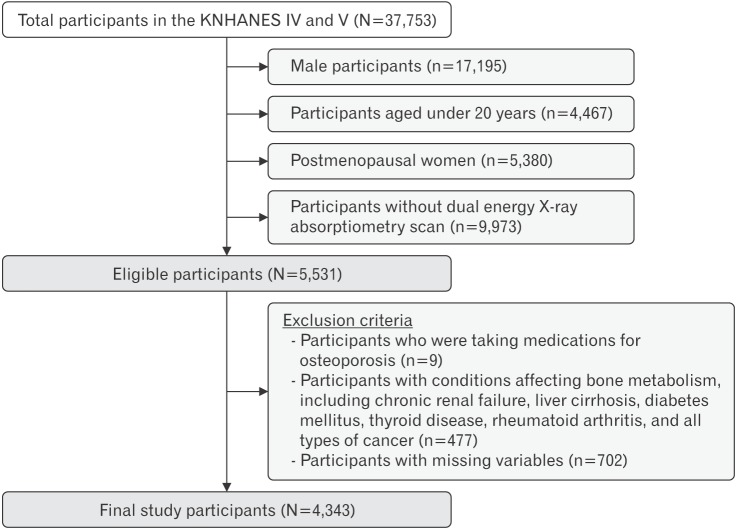
Of the 5,531 participants, we initially excluded nine subjects who reported that they were taking medication for osteoporosis. In addition, we excluded 477 participants with conditions that might affect bone metabolism, including chronic renal failure, diabetes mellitus, liver cirrhosis, rheumatoid arthritis, thyroid disease, and all types of cancer. Among the 5,045 eligible participants, we further excluded those with missing values for any of the study variables (n=702, 13.9%). A total of 4,343 women were included in our final analysis (Figure 1). Since the KNHANES is a publicly available dataset, this study did not require ethical approval of an Institutional Review Board.
2. Dual-Energy X-ray Absorptiometry Measurement of Body Composition, Bone Mineral Density Analysis, and Z-score
All participants of the present study had undergone DXA (DISCOVERY-W fan-beam densitometer; Hologic Inc., Waltham, MA, USA) to assess BMD and body composition. The KNHANES IV (2008ŌĆō2009) and V (2010ŌĆō2011) included large-scale whole-body DXA measurements, in which trained engineers generated an accurate and reliable dataset. The results of DXA were analyzed using industry-standard techniques at the Korean Society of Osteoporosis with the Hologic Discovery software ver. 13.1 (Hologic Inc.) in its default configuration.17)
Daily standardized quality control of DXA instruments was performed using a spine phantom provided by the manufacturer before the start of the study.17) For body composition analysis, total FM (TFM, kg), total LM (TLM, kg) excluding bone mass, and truncal FM (TrFM, kg) were measured, in addition to BMD (g/cm2) of the total femur, femoral neck, and lumbar spine. Non-truncal FM (nTrFM, kg) was also calculated to represent appendicular FM, by subtracting the TrFM from the FM of the subtotal body (entire body excluding the head).
The normal range of BMD among premenopausal women was defined using the Z-scores of the BMD of the total femur, femoral neck, and lumbar spine by age, sex, and race according to International Society for Clinical Densitometry guidelines.18) Since the KNHANES data represents the general Korean population, we calculated the means and standard deviations of BMD for each age and sex from all subjects included in the KNHANES IV and V, and used them as reference for assessing the Z-scores.
3. Measurement of Other Study Variables
Trained interviewers collected demographic data and information on health-related behaviors of the study participants via personal interviews. The demographic variables included age (years), highest educational level achieved (up to or less than elementary school education, middle or high school education, and college or higher education), and monthly household income (in quartiles). The equivalent household income was calculated as the total monthly household income divided by the square root of the total number of household members.17)
Information regarding health-related behavioral factors including smoking (never, past, or current smoker), alcohol consumption (non-, moderate, or heavy drinker), and physical activity (low, moderate, or high) was also obtained. Heavy drinkers were defined as subjects who consumed more than 120 g of alcohol per week, according to the KNHANES IV and V.17) Physical activity was quantified as a metabolic equivalent of task minutes (MET-minutes) per week, which was calculated using the scoring protocol of the Korean version of the International Physical Activity Questionnaire short form.19) Accordingly, physical activity levels were classified as low (<600 MET-minutes per week), moderate (Ōēź600 to <1,500 MET-minutes per week), or high (Ōēź1,500 MET minutes per week). Daily calcium intake (mg) was evaluated using the 24-hour recall method.
Blood samples were collected from each participant during the survey and were processed as follows: antecubital vein blood samples were drawn and were immediately centrifuged. Plasma total cholesterol (mg/dL), high-density lipoprotein cholesterol (mg/dL), low-density lipoprotein cholesterol (mg/dL), triglyceride (mg/dL), fasting glucose (fasting at least 12 hours, mg/dL), and fasting insulin concentrations (┬ĄIU/mL) were measured enzymatically using a Hitachi 7600 Automatic Analyzer (Hitachi, Tokyo, Japan).17) Insulin resistance was evaluated using the homeostasis model assessment for estimated insulin resistance (HOMA-IR) index (i.e., HOMA-IR=(fasting plasma glucose)├Ś(fasting plasma insulin)/405).20) Serum 25-hydroxyvitamin D concentration (ng/mL) was measured by radioimmunoassay (DiaSorin Inc., Stillwater, MN, USA), using a ╬│-counter (1470 Wizard; PerkinElmer, Wallac, Turku, Finland).17)
Anthropometric factors, including body weight and height, were obtained using standard protocols and were measured to the nearest 0.1 kg and 0.1 cm, respectively. Body mass index (BMI) was calculated as body weight in kilograms divided by the squared height in meters (kg/m2).
4. Statistical Analysis
To analyze the combined survey samples over 4 years, average sampling weights were used to generate unbiased cross-sectional estimates representative of the general Korean population. The characteristics of the study participants were presented as means┬▒standard errors for continuous variables and percentages for categorical variables. Multiple linear regression analysis was performed to assess the association between body composition (TFM, TLM, TrFM, nTrFM) and BMD of the total femur, femoral neck, and lumbar spine after adjusting for confounding variables including age, height, education level, monthly income, daily calcium intake, serum 25-hydroxyvitamin D concentration, and health-related behaviors including smoking, physical activity, and alcohol consumption (model 1). To independently evaluate the association between body composition and BMD from the possible confounding effects of body weight, multiple regression analyses were performed after additional adjustment for body weight in model 1 (model 2). In addition, to evaluate whether insulin resistance or serum cholesterol levels mediated the association between TFM and BMD, HOMA-IR and serum lipid profiles were separately added as covariates to model 2, and the results of analyses with and without these covariates were compared.
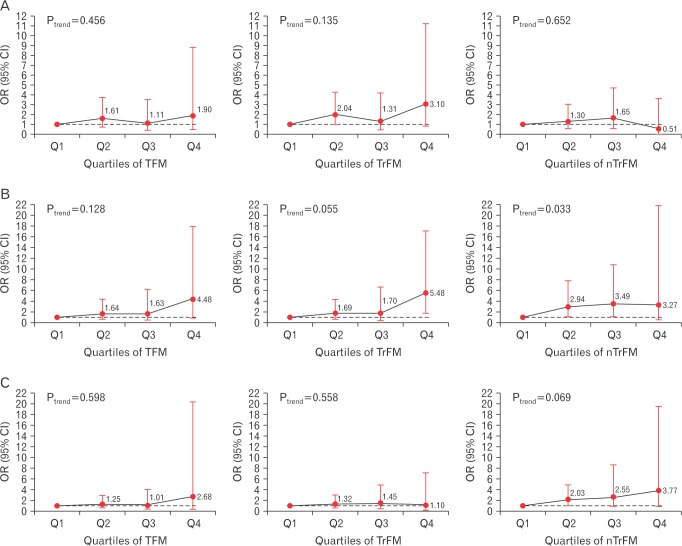
Further, we divided participants into ŌĆ£non-obeseŌĆØ (BMI <25 kg/m2) and ŌĆ£obeseŌĆØ (BMI Ōēź25 kg/m2) subgroups, and performed multiple linear regression analysis in both subgroups separately as well as after adjusting for BMI in order to verify the association between TrFM, nTrFM, and BMD according to BMI. The cutoff value of BMI for obesity was based on WHO recommendations for Asian populations.21) In addition, we performed multivariate logistic regression analyses to estimate the odds ratios (ORs) and 95% confidence intervals (CIs) for low BMD (Z-score <ŌłÆ2.0) by quartiles of TFM, TrFM, and nTrFM, using the lowest quartile as reference and adjusting for all variables included in the multiple regression model 2.
All statistical analyses were performed using STATA ver. 14.1 (Stata Corp., College Station, TX, USA), and P-values <0.05 were considered statistically significant.
RESULTS
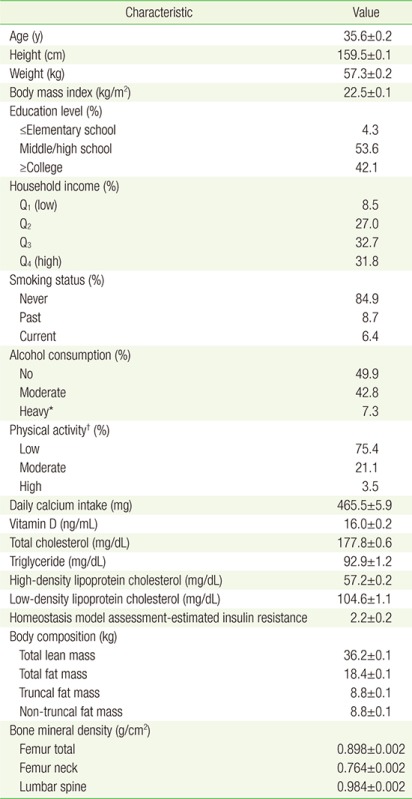
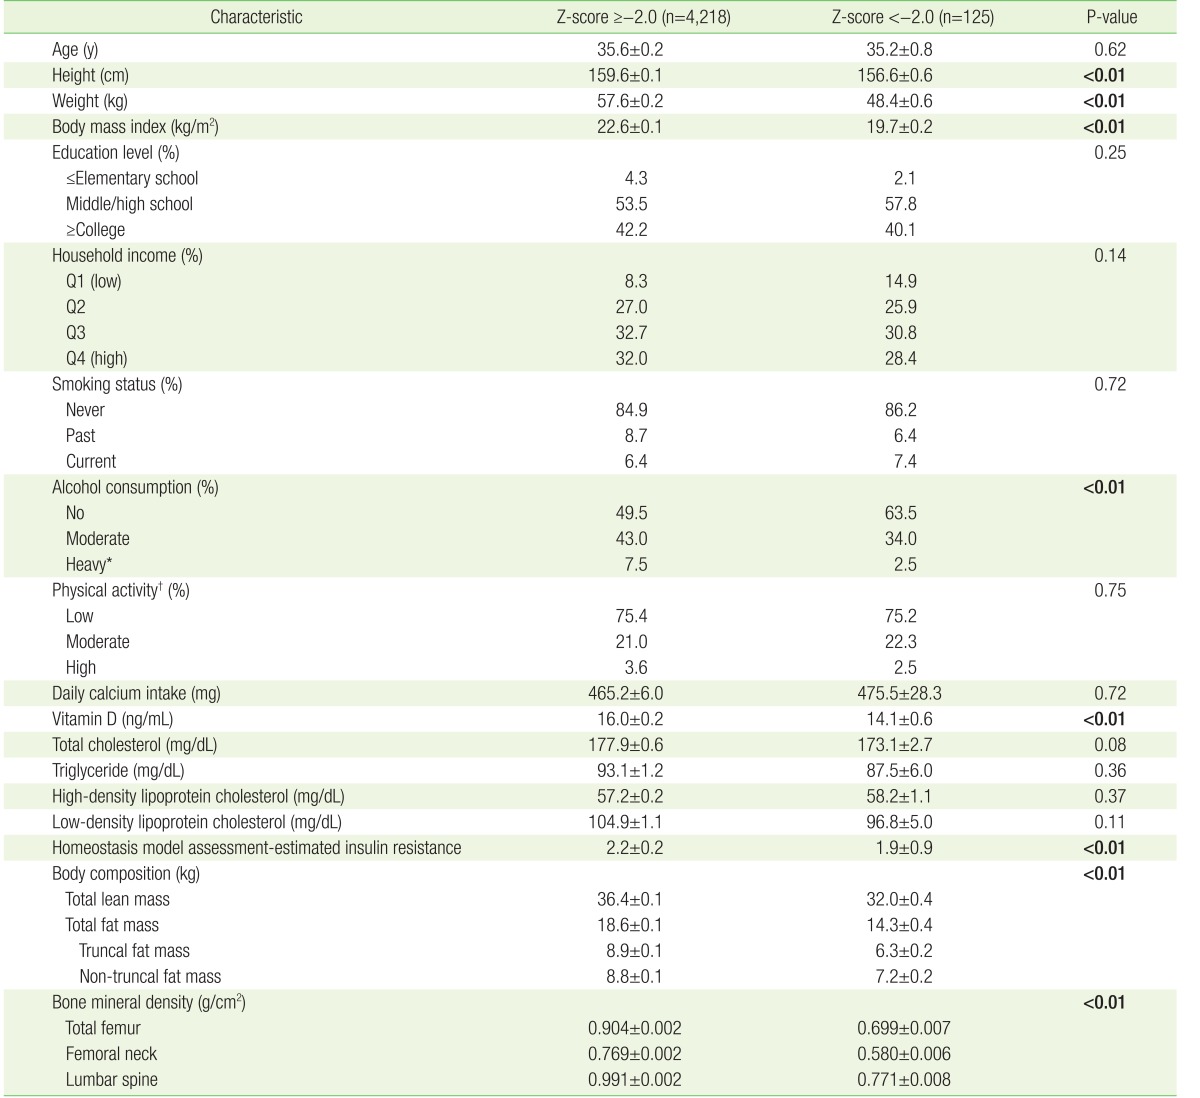
The baseline characteristics of the study participants (mean age, 35.6 years) included in the final analysis are shown in Appendix 1. Table 1 compares the characteristics of the two groups of participants divided according to their Z-scores. Overall, approximately 2.9% of the participants had Z-scores below ŌłÆ2.0 (n=125). Participants with Z-scores more than or equal to ŌłÆ2.0 were taller, heavier, and drank less alcohol than those with Z-scores below ŌłÆ2.0, and had higher serum 25-hydroxyvitamin D concentration, HOMA-IR level, and higher TLM, TFM, TrFM, and nTrFM than the corresponding values of participants with Z-scores below ŌłÆ2.0 (P<0.05).
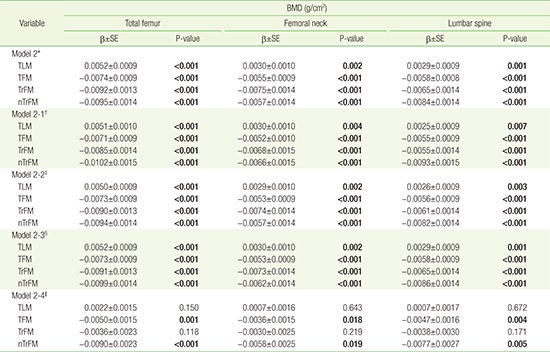
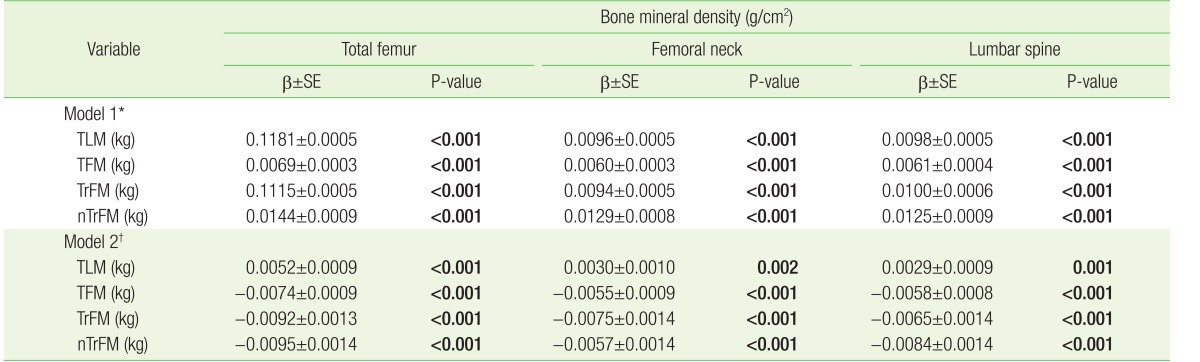
Table 2 shows the multivariate-adjusted associations between body composition (TFM, TLM, TrFM, and nTrFM) and BMD of the total femur, femoral neck, and lumbar spine. TLM was positively associated with BMD regardless of adjustment for weight. In contrast, although TFM, TrFM, and nTrFM were positively associated with BMD in model 1, the association became negative after adjusting for body weight (model 2). In addition, although the gradient of the abovementioned analysis changed after adjusting for HOMA-IR or cholesterol level, neither the direction of the association between TFM and BMD nor the statistical significance of the analysis changed (Appendix 2).
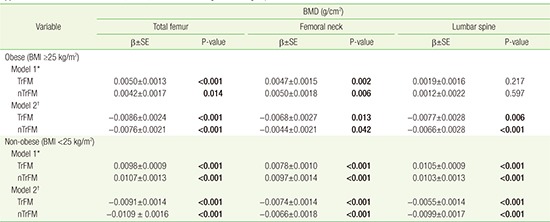
We also compared the association between TrFM, nTrFM, and BMD according to BMI subgroup, by multivariate-adjusted linear regression analysis (Appendix 3). Both TrFM and nTrFM showed an overall negative association with BMD in non-obese and obese participants, after adjusting for body weight.
No significant differences in the risk for low BMD (Z-score <ŌłÆ2.0) were observed across quartiles of TFM, TrFM, and nTrFM after adjusting for potential confounders including body weight. With regard to the parts of the body from which the BMD was measured, the risk of low BMD at the femoral neck was significantly higher in the highest quartile of TFM and TrFM compared with that in the lowest quartile. The ORs for low BMD of the femoral neck were 4.48 (95% CI, 1.11ŌĆō18.01) for TFM, 5.48 (95% CI, 1.75ŌĆō17.20) for TrFM, and 3.27 (95% CI, 0.49ŌĆō21.98) for nTrFM (Figure 2).
DISCUSSION
Our study demonstrated that in premenopausal Korean women, TLM was positively associated with BMD regardless of body weight, while TFM was inversely associated with BMD after adjusting for body weight. However, both TrFM and nTrFM, which were assumed to represent visceral and subcutaneous fat, respectively, were inversely associated with BMD.
Body weight is one of the strongest positive predictors of bone mass,4) and previous studies have suggested that LM is an important determinant of bone density in women,6,7,8) including premenopausal women.8,22) In concordance with previous studies, our study found that LM is positively associated with BMD in premenopausal Korean women. Since this relationship remained even after adjusting for body weight, we concluded that LM affects bone mas through mechanisms other than its direct loading effect on the skeleton via muscle contractions that result from physical activity.6) Genetic, environmental, and hormonal components are also involved in these mechanisms.23,24,25)
FM, on the other hand, was variably associated with BMD after adjusting for body weight. TFM, TrFM, and nTrFM were positively associated with BMD without adjusting for body weight, but were all negatively associated with BMD after adjusting for body weight, consistent with previous studies performed among the Korean population.12,13,14,26,27)
A recent meta-analysis has shown that both LM and FM are positively associated with BMD across all ages and ethnicities.28) Most studies that reported positive associations between FM and BMD assessed the association between body composition and BMD without adjusting for body weight.8,9,11,12) Since LM and FM comprise most of the body weight and are considered to work together to maintain bone mass via skeletal loading effects, collinearity likely occurs with body weight, which contributes to the inconsistent findings of previous studies.29) Although it remained controversial with regard to statistical analysis, findings from the study suggest that FM itself might have a negative effect on BMD independent of its effect on body weight, based on the observation that compared with LM, FM had a much smaller effect on BMD without adjusting for the body weight of FM, but showed the opposite result after adjusting for body weight.
The detrimental effect of FM on BMD may be attributed to several complex mechanisms of FM and types of fat tissue. Recent studies have demonstrated the differential impact of specific fat compartments on BMD, with visceral adipose tissue having detrimental effects on BMD.15,16) Fat and bone are linked by a multitude of pathways, and adiponectin, insulin, amylin, preptin, leptin, and adipocytic estrogens are all likely to be involved in this relationship.29) Since insulin resistance or lipid profiles, which are related to obesity, mediate the association between FM and bone density owing to their effects on bone mass,11,29,30) we included HOMA-IR and serum cholesterol level as covariates in our analysis. However, in our study, the association between FM and BMD did not change after adjusting for HOMA-IR or serum cholesterol levels, a finding that suggests that FM could also affect BMD through mechanisms other than insulin resistance or cholesterol metabolism.
In this study, we investigated the association between body composition and BMD in healthy premenopausal women from the KNHANES database, which represents the health and nutritional status of the general Korean population. To our knowledge, this is the largest cross-sectional study on this topic. Our study defined Z-scores, and the diagnostic criteria for low BMD for premenopausal women by age and sex; these results may be helpful in clinical settings. We also investigated whether the effect of FM on BMD differs according to fat distribution, using TrFM and nTrFM to represent visceral fat and subcutaneous fat, respectively, since direct measurement of visceral fat was not available in the KNHANES data. Contrary to our predictions, both TrFM and nTrFM were negatively associated with BMD after adjusting for body weight. Because only a small number of participants were obese in our population (n=866) and all participants were premenopausal, both TrFM and nTrFM might mainly consist of subcutaneous fat, suggesting that even subcutaneous fat (besides visceral fat) can have a detrimental effect on bone health.
Our study has several limitations. First, the cross-sectional study design limits our ability to determine the causal relationship between body composition and BMD. Second, information bias cannot be ruled out, as demographic and health-related behavioral parameters were obtained from self-reported questionnaires. Third, our study results cannot be extended to other sexes, ages, and ethnicities, as the study population and cutoff values for the study variables were specific to premenopausal Korean women. Fourth, hidden confounding factors may also affect the association between body composition and BMD.
In conclusion, the findings of our study suggest that increased LM has protective effects on bone health, while increased FM may have a detrimental effect on BMD in addition to its positive weight-bearing effect, in premenopausal Korean women. Therefore, an adequate composition of LM and FM might be important for maintaining bone health and preventing osteoporosis. Further investigation is necessary to determine whether BMD differs according to the type of fat tissue based on direct measurement of visceral fat.