INTRODUCTION
The smartphone is a mobile phone that may work as a personal computer. After the first introduction of smartphones in 2009, these devices have rapidly penetrated peopleŌĆÖs daily lives, and the rate of smartphone usage is briskly increasing worldwide. South Korea ranks as the fourth fastest nation in public smartphone distribution rate [1], and, recently, smartphone addiction is becoming a significant important social problem.
According to a 2017 survey by the Ministry of Science, ICT and Future Planning, tendency toward smartphone addiction is especially evident in teenagers [2]; 15 of 100 students in primary to high school are addicted to smartphones, and 3.5% among them are considered risky users with serious disabilities in daily life.
Given the association of a range of health problems with addiction to the internet [3-5], excessive smartphone usage might cause negative effects on peopleŌĆÖs physical and psychosocial health. However, research on the negative effects of smartphone overuse has been scarce [6-10], probably owing to the overwhelming benefits that smartphones provide in peopleŌĆÖs daily lives, such as convenience, mobility, and connectivity [11,12]. Depression could be the most important problem associated with smartphone overuse; the psychopathological model suggests that neurotransmitters related with addiction are also involved in the development of depression [13]. The prevalence of depressive disorders in adolescence has been reported to be between 15% and 20% [14]. Unlike in adults, depression in adolescents tends to be characterized by the frequent occurrence of delinquent behaviors, game addiction, and internet addiction [14,15]. Thus, researchers need to examine the relation between depression and smartphone overuse in adolescents.
The present study aimed to investigate the association between smartphone usage time and mental health in Korean adolescents, using data from a nationwide survey that recruits representative samples, after adjusting for covariates.
METHODS
1. Study Participants
We used the data from the 13th Korean Youth Risk Behavior Web-based Survey (KYRBWS) collected in 2017. The KYRBWS is a government-approved annual statistical survey (Statistics Korea, approval no., 117058) conducted by the Korea Centers for Disease Control and Prevention since 2005 to monitor priority health risk behaviors among Korean adolescents. The 2017 survey consisted of 123 questions assessing the demographic characteristics and 15 areas of health-related behaviors. Additional details on sampling methodology and survey procedures are available in the survey introduction.
The target population of the 13th KYRBWS was middle- and high-school students at the time of survey in April 2017. A stratified multistage cluster-sampling design was used for the survey to select the nationally representative samples of middle- and high-school students. Students participated in the survey voluntarily and completed the anonymous, self-administered, web-based survey during a regular class period. Among the total of 64,991 students from 400 middle schools and 400 high schools, 62,276 students participated in the survey, with a response rate of 96.7%. In the present study, we included 54,603 adolescents (27,673 female and 26,930 male) who reported their smartphone use. This study was reviewed and approved by the institutional review board of Samsung Medical Center (SMC 2018-03-096). The data used in this study did not include any identifiable personal information. Thus, the institutional review board of Samsung Medical Center did not require the acquisition of informed consent forms for the current study.
2. Study Variables
From the information collected by KYRBWS, we used the data on sociodemographic characteristics, smartphone usage pattern, and health status. Smartphone usage time was assessed separately for weekdays and weekends by the following question: ŌĆ£During the weekdays of the last 30 days, for how many hours on average did you use a smartphone in one day?ŌĆØ and ŌĆ£During the weekends of the last 30 days, for how many hours on average did you use a smartphone in one day?ŌĆØ Using the responses to the above two questions, we calculated the average duration of smartphone usage per week. Then, we classified participants into three groups according to the tertile distribution of average smartphone use time per week; low-use group (<16 hours), moderate-use group (16ŌĆō29 hours), and high-use group (Ōēź30 hours).
We also assessed problematic smartphone usage by asking the following questions: ŌĆ£Have you ever experienced conflict with family members because of your smartphone use?ŌĆØ ŌĆ£Have you ever experienced conflict with peers because of your smartphone use?ŌĆØ ŌĆ£Have you ever experienced disturbance in your school work because of smartphone use?ŌĆØ
The main outcome variables in the present study were depressive symptoms, suicide ideation, and suicide attempt. We assessed depressive symptoms using the question ŌĆ£Have you ever felt hopeless or sad for more than two weeks such that it was difficult to live an ordinary life during the last year?ŌĆØ If a participant answered ŌĆ£yesŌĆØ to the question, we categorized them in the ŌĆ£depressive symptom group.ŌĆØ We assessed suicide ideation and attempt by the questions, ŌĆ£During the last 12 months, have you ever seriously thought about suicide?ŌĆØ and ŌĆ£During the last 12 months, have you ever attempted suicide?ŌĆØ We considered the sociodemographic and health status variables as covariates based on the suggestion of a previous study that these are associated with depression or quality of life in adolescents [14]. The sociodemographic and behavioral variables were age, sex, economic status, living arrangement (living apart from family), presence of siblings, experience of school violence, school performance, alcohol drinking, smoking, and physical activity. The health status variables were self-reported health condition, sleep satisfaction, stress level, and well-being.
3. Statistical Analysis
All statistical analyses were conducted with consideration of the multistage cluster-sampling design. We performed chi-square tests for categorical variables and Student t-tests for continuous variables to examine the relation between each variable and smartphone usage time.
Odds ratios (ORs) with 95% confidence intervals (CIs) were estimated by multiple logistic regression analysis to evaluate associations between smartphone usage time and depressive symptoms after adjusting for covariates. The covariates were selected from the findings of univariate analyses in our study and previous studies [6,8,10-12,14-16].
We repeated the analysis using an age- and sex-adjusted model and three additional models. In model 1, age, sex, socioeconomic variables (economic status, presence of siblings, and living apart from family) were adjusted. Behavioral characteristics (school violence experience, drinking experience, smoking experience, and physical activity) and self-reported health status (health condition, sleep satisfaction, stress level, and well-being) were additionally adjusted in model 2.
We hypothesized that problems caused by smartphone usage may mediate the association between depressive symptoms and smartphone usage time. Thus, we further adjusted for problems that may be caused by smartphone usage (conflict with family, conflict with peers, and disturbance in school work) in model 3, in addition to the covariates included in model 2.
All statistical analyses were performed using PASW SPSS Statistics ver. 18.0 (SPSS Inc., Chicago, IL, USA). The statistical significance of each result was assessed based on P<0.05.
RESULTS
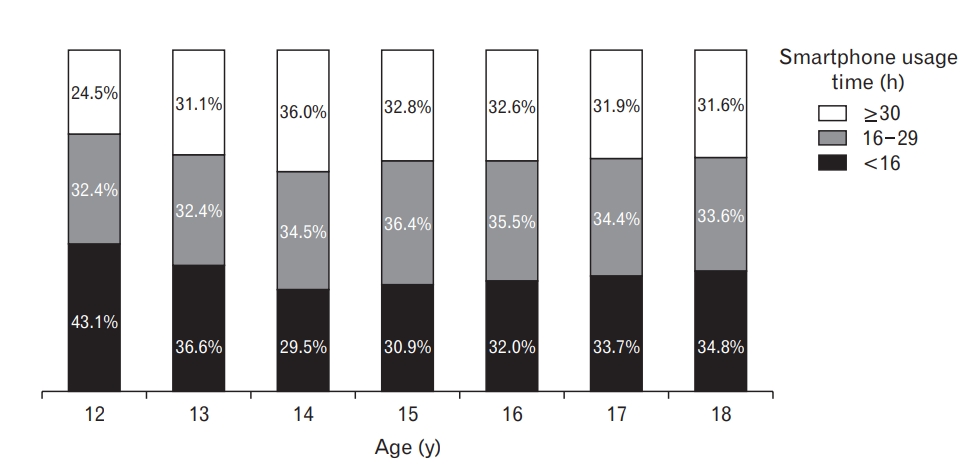
The mean (┬▒standard deviation) smartphone usage time per a week was 31.5 (┬▒24.2) hours in female students and 25.3 (┬▒21.9) hours in male students. Among the total of 54,603 participants, 25.6% of the male students and 38.4% of the female students reported using a smartphone for 30 hours and more (Figure 1). By age group, 14-year-old students had the highest proportion of high smartphone usage (Figure 2).
Table 1 shows the distribution of the sociodemographic and behavioral characteristics, as well as problems caused by smartphone use, according to smartphone usage time. The high-smartphone usage group had a higher proportion of female students compared with the low smartphone-usage group. The proportion of students who reported their economic status and school performance as belonging to the lowest quantile increased with the increase in smartphone usage time. No significant difference was observed in the proportion of students living apart from family or having experienced school violence according to smartphone usage time. The proportions of students with alcohol drinking and smoking experience were higher in the high-smartphone usage group than in the low-use group. Meanwhile, the proportion of students who reported engaging in physical activities was higher in the low-use group than in the high-use group. Problems attributed to smartphone usage, including conflict with family members or peers and disturbance in school work, increased with the increase of smartphone usage time.
Table 2 gives the self-reported health status of the participants. The proportion of students who reported their health condition as ŌĆ£very healthyŌĆØ was significantly higher in the low smartphone-use group compared with the high-use group. Compared with those in the low smartphone-use group, significantly higher proportions of students in the high-smartphone use group reported having felt depressive symptoms for more than two weeks (31.3% versus 21.0%), had a suicidal thought during the last 12 months (16.0% versus 9.8%), and attempted suicide during the last 12 months (5.1% versus 3.3%).
Table 3 shows the multivariable-adjusted association of smartphone usage time with depressive symptoms, suicidal thoughts, and suicide attempts. Smartphone usage time was positively associated with depressive symptoms, suicidal thoughts, and suicide attempts in age-and sex-adjusted analyses. After additional adjustment for behavioral characteristics and self-reported health status, the associations were attenuated but persisted (P trend <0.001). Compared with the low smartphone-use group, the moderate (OR, 1.07; 95% CI, 1.01ŌĆō1.14) and high smartphone-use groups (OR, 1.18; 95% CI, 1.10ŌĆō1.26) had a higher risk of depressive symptoms after adjusting for covariates. The ORs (95% CI) for suicidal thoughts and suicide attempts associated with high smartphone usage were 1.18 (1.08ŌĆō1.29) and 1.34 (1.11ŌĆō 1.60), respectively.
We further adjusted for problems attributed to smartphone usage to examine whether these problems played a role as mediators in the relations between smartphone usage time and depressive symptoms, suicidal thoughts, and suicide attempts. The associations remained significant with minimal change in ORs. Multivariable-adjusted analysis in each sex showed similar findings (Supplementary Table 1).
DISCUSSION
In this large-scale cross-sectional study conducted in a representative sample of Korean adolescents, we found that smartphone usage time was positively associated with depressive symptoms, suicidal thoughts, and suicide attempts. This association persisted even after adjusting for a wide range of covariates.
The present findings are consistent with previous ones: smartphone or internet overuse is associated with mental health, including depression and anxiety [6,16-18. Several explanations could be hypothesized for the association between excessive smartphone use and mental health problems. First, excessive smartphone use tends to cause sleep disturbance by keeping a person up late, thus inducing stress and depression [6]. In the present study, participants in the high-usage group were less likely to have sleep satisfaction. Second, people who use smartphones for a longer time tend to have relatively less interaction with other people and to receive lower social support, compared with those who use their smartphone less [6]. In accordance with this explanation, we found that a greater proportion of the high smartphone-usage group had a conflict with family members and peers. A lack of communication is known to result in feelings of loneliness and depressive moods in children and adolescents [14]. Smartphone usage accompanied by social problems has also been associated with various psychological and behavioral problems, such as depression, anxiety, and sleep disturbance [10,12,19]. However, the current finding that the association persisted even after adjusting for communication problems and disturbance in school work does not support the hypothesis that communication problems attributed to smartphone usage fully mediate the association between smartphone usage time and mental health problems. Third, reduced physical activity levels by smartphone usage, as found in our study, may also cause adverse effects on mental health in adolescents [20]. Lastly, to explain the biological mechanism of smartphone addiction, a study assessed the gamma-aminobutyric acid (GABA) and glutamate levels in 10 male teenagers with smartphone addiction and 19 control teenagers without smartphone addiction, using brain magnetic resonance spectroscopy [13]. This study found higher GABA level in the smartphone addiction group compared with the control group [13]. High GABA levels cause a decline in the control of neuro-signals, including cognitive and emotional control, which in turn causes sleepiness, and even anxiety and depression in serious cases [21].
The prevalence of smartphone overuse in Korean adolescents found in our study seemed to be very high; about one-third of the participants reported using a smartphone for 30 hours per week. However, we could not compare the prevalence with that in other populations owing to the lack of community studies in other countries.
In our study, the proportion of smartphone high usage was higher among female students than that among male students. Studies have reported discrepancies in smartphone usage time between the two sexes [7,8,12]. Roberts et al. [11] found that cellphone addiction is largely driven by a desire to connect socially, such as through voice calls, text messages, and social networks. Regarding the purpose of smartphone usage, men tend to use smartphones to play games, watch videos, or listen to music, whereas women tend to seek social contact, such as through messaging and social networking [6,9]. These findings suggest that women are more likely to be addicted to smartphone use compared with men.
Our study is the first large-scale research that investigated the association between smartphone usage time and depressive symptoms in Korean adolescents using a nationally representative sample. Moreover, we took into consideration a wide range of covariates that may have influenced depressive symptoms, including clinical conditions.
However, our study has a number of limitations. First, owing to the cross-sectional study design, we were unable to identify the causal relation between smartphone usage time and depressive symptoms. Second, we could not make definite diagnoses of depressive disorders because the data lacked the detailed questions needed for diagnosing clinical depression. Third, the use of data from self-reported questionnaires in analyses might have introduced recall bias. Fourth, we could not consider some covariates that probably influence the smartphone usage time of adolescents, such as time spent alone at home and parentsŌĆÖ employment status. Finally, we could not define the smartphone addiction group as in other studies because no questionnaire measuring smartphone addiction was included in the KYRBWS [6].
In conclusion, this study on Korean adolescents showed that smartphone usage time was associated with mental health problems, such as depressive symptoms, suicidal thoughts, and suicide attempts, and the associations did not seem to be mediated by the problems attributed to smartphone usage. Targeted strategies are needed to reduce the negative mental health problems in adolescents who use their smartphone excessively.