INTRODUCTION
According to the World Health Organization, osteoporosis is a systemic skeletal disease characterized by decreased bone mass and microstructural abnormalities, resulting in a fragile state due to bone weakness [1]. Bone fractures are the most serious complication of osteoporosis, and the condition itself is serious, causing death in some cases. Among hip fracture patients aged ≥50 years, 24% die within the year due to a fracture [2]. Of nearly 300,000 people with a hip fracture each year, 25% end up in nursing homes, and 50% never regain their previous function [3]. Women’s risk of fractures is equal to their combined risk of breast, uterine, and ovarian cancer [4]. Osteoporosis results in a substantial economic burden to healthcare systems, totaling more than US $17 billion. Experts predict osteoporosis will be responsible for three million fractures, resulting in $25.3 billion in costs by 2025 [5]. Osteoporosis can be prevented, diagnosed, and treated before the occurrence of fractures. All postmenopausal women can benefit from nonpharmacological interventions to reduce the risk of fracture, including a balanced diet with adequate intake of calcium and vitamin D, regular exercise, measures to prevent falls or minimize their impact, smoking cessation, and moderation of alcohol intake [6].
Among the many factors affecting bone density, the role of some nutrients, such as calcium and vitamin D [7], in bone health is obvious, but the effects of other nutrients are less well known. Some studies have reported that certain dietary factors, such as sodium, may modulate calcium metabolism. High sodium consumption can affect bone density due to a negative calcium balance, and induced hypercalciuria can play an important role in inducing osteoporosis [8]. A study that used data from 2008 to 2011 National Health and Nutrition Survey found a link between sodium intake and osteoporosis in postmenopausal women. The study showed that the prevalence of osteoporosis in the lumbar spine was significantly higher in participants who consumed ≥4,001 mg of salt than that in those who consumed ≤2,000 mg of salt. At the femoral neck, the rates were significantly higher for those who consumed ≥5,001 mg than that for those who consumed ≤4,000 mg [9]. However, studies on the effect of dietary/urinary sodium on osteoporosis are controversial [10,11]. A systematic review concluded that the association of dietary/urinary sodium with bone mineral density (BMD) demonstrated a positive association between sodium intake and the risk of osteoporosis, whereas no association was found with urinary sodium [12]. Conversely, high potassium intake is considered beneficial for the skeleton because it improves calcium and phosphorus balance, reduces bone resorption, and increases the rate of bone formation [13]. Low potassium and high sodium dietary intakes have been reported to be associated with accelerated bone resorption in both animal and population-based studies [14,15]. A recent cross-sectional study reported that urinary sodium-to-potassium (Na+/K+), but not individual values of sodium or potassium, was inversely related to BMD in the whole body, total hip, trochanter, and intertrochanter in women [16]. To the best of our knowledge, information currently available regarding the role of the dietary Na+/K+ ratio in BMD is limited. To address this issue, this community-based study aimed to determine the associations between dietary sodium, dietary potassium, and Na+/K+ ratio with BMD in women aged >50 years.
METHODS
1. Data Source and Study Participants
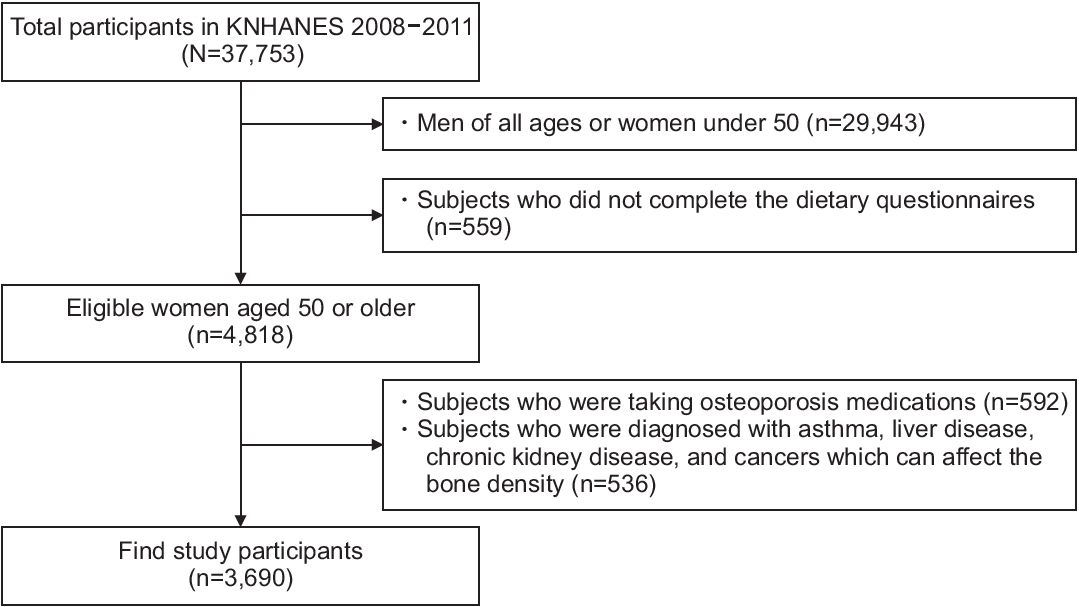
The Centers for Disease Control and Prevention has conducted the Korea National Health and Nutrition Examination Survey (KNHANES) every 3 years since 1998 to produce representative and reliable statistics on the overall health, nutritional status, and trends of the people [17]. With the 4th and 5th KNHANES (2007–2012), the participants were recruited between 2008 and 2011, as there were BMD results only in 2008–2011, with an average response rate of 75%–80%. Among the 37,753 participants who participated in the KNHANES 2008–2011, we included women aged 50 years and older who answered the dietary questionnaires and completed body composition measurements. Among these participants, we excluded those with any diseases that could affect bone density, such as asthma, liver disease, chronic kidney disease, and cancers. Finally, 3,690 participants were included in this study (Figure 1). The institutional review board of Daegu Catholic University Medical Center reviewed and approved this study (approval no., CR-21-108).
2. Bone Mineral Density Measurements
BMD (g/cm2) was measured using dual-energy X-ray absorptiometry (Hologic Discovery; Hologic Inc., Bedford, MA, USA) using the standard techniques of the Korean Society of Osteoporosis and Hologic Discovery software ver. 13.1 (Hologic Inc.). Total femur and lumbar spine BMDs were used for analysis.
3. Dietary Assessment
A 24-hour dietary recall questionnaire and 63 food-items were investigated for dietary assessment. The frequency of food consumption was based on the dietary habits of the past 1 year. We used the daily energy intake and intake of other nutrients, including sodium and potassium, which were calculated using a food frequency questionnaire. The study participants were divided into four groups according to their daily sodium intake, potassium intake, and Na+/K+ ratio.
4. Measurement of Covariates
Height and weight were measured to the nearest 0.1 cm for height and 0.1 kg for weight, respectively, using standard protocols. Body mass index (BMI) was calculated as body weight divided by the square of height in meters, as presented in the original data. Lifestyle factors were assessed using self-administered questionnaires.
Physical activity was assessed based on the frequency and intensity of exercise during the past 1 week. Low-intensity exercise was defined as walking more than 5 days per week for more than 30 minutes at a time. Moderate-to-vigorous-intensity exercise was defined as participating in moderate-intensity activities for more than 5 d/wk for more than 30 minutes at a time or participating in vigorous-intensity activities for more than 3 d/wk for more than 20 minutes at a time. Smoking status was categorized as never smoked or ever smoked. Never smokers were defined as those who had never smoked or had smoked fewer than 100 cigarettes in their lifetime. Ever-smokers were defined as those who had smoked more than 100 cigarettes in their lifetime. High-risk alcohol consumption was defined as drinking alcohol more than twice per week, with an average amount per drink ≥7 glasses for men and ≥5 glasses for women. Menopausal status was assessed based on the self-reported questionnaire.
5. Statistical Methods
We used sampling weights based on the complex sample design of the KNHANES in all analyses. Continuous variables were presented as means and standard errors, and discrete variables were presented as numbers with proportions. Since BMD, as an outcome variable, is a continuous variable, we used simple and multiple linear regression analyses. Simple linear regression analyses were performed to determine the clinical variables adjusted for multiple linear regression analyses. Study participants were classified into quartiles (lowest quartile Q1–highest quartile Q4) according to dietary Na, K, and Na/K ratios, and the association of these parameters with BMD was examined thereafter. Multiple linear regression analyses were performed to examine these associations, and the results are shown as β-coefficients. We adjusted for age, BMI, physical activity, smoking, alcohol consumption, menopausal status, serum 25-hydroxyvitamin D (25(OH)D) level, and daily intake of total energy, protein, calcium, and phosphorus [18,19]. BMD values were log-transformed to approximate normal distribution for the analyses. IBM SPSS software for Windows ver. 21.0 (IBM Corp., Armonk, NY, USA) was used for all the analyses. Statistical significance was set at P<0.05.
RESULTS
1. Baseline Characteristics of Study Population
The baseline characteristics of the 3,690 participants according to quartiles of dietary Na+/K+ ratios are shown in Table 1. There were no significant differences in age or weight, although BMI tended to increase as the dietary Na+/K+ ratio increased. Regarding BMD, both the total femur and lumbar spine BMD tended to decrease as the dietary Na+/K+ ratio increased. There were no significant differences in total energy, protein, and fat intake among the groups according to the dietary Na+/K+ ratio. However, carbohydrate, fiber, and phosphorus intake decreased as the dietary Na+/K+ ratio increased. There was no difference in calcium intake between the groups. Regarding lifestyle factors, such as smoking, alcohol consumption, and physical activity, there were no differences according to the dietary Na+/K+ ratio.
2. Associated Factors with Bone Mineral Density
Table 2 shows simple linear regression analyses of BMD and clinical variables. Height, weight, BMI, calcium, phosphorus, total energy, and protein intake were positively associated with both total femur and lumbar spine BMD. Age was negatively associated with BMD. Serum 25(OH)D was not significantly associated with both femur and lumbar spine BMD.
3. Association of Dietary Sodium, Dietary Potassium, Na+/K+ with Bone Mineral Density
Tables 3 and 4 show the adjusted association of dietary Na+ intake, K+ intake, and Na+/K+ ratio with the total femur and lumbar spine BMD. As shown in Table 3, the β-coefficient for total femur BMD in Q4 of Na+ intake was -0.012, although the difference was not statistically significant. In Q3 and Q4 of K+ intake, the β-coefficients for total femur BMD were 0.004 and 0.009, respectively, although statistical significance was not observed. However, the lumbar spine BMD significantly decreased with dietary Na+. Regarding dietary Na+, the β-coefficient (95% confidence interval) was -0.007 (-0.031 to 0.017) in Q2, -0.012 (-0.036 to 0.013) in Q3, and -0.031 (-0.058 to -0.004) in Q4 (P=0.023). This means that each group had a lower BMD by 0.7%, 1.2%, and 3.1%, respectively, compared with that of Q1 by applying the exponential function to the presented β, although statistical significance was only observed in Q4.
As shown in Table 4, there were significant negative associations among the Na+/K+ ratio, total femur BMD, and lumbar spine BMD. The β-coefficient (95% confidence interval) for total femur BMD was -0.021 (-0.037 to -0.005) in Q2, -0.009 (-0.025 to 0.007) in Q3, and -0.023 (-0.042 to -0.005) in Q4 (P=0.044). This means that each group had a lower BMD of 2.1%, 0.9%, and 2.3%, respectively, compared to that of Q1, although statistical significance was not observed in Q3. The β-coefficient (95% confidence interval) for the lumbar spine was -0.020 (-0.041 to 0.002) in Q2, -0.027 (-0.046 to -0.008) in Q3, and -0.033 (-0.055 to -0.012) in Q4 (P=0.002). This means that each group had a lower BMD of 2.0%, 2.7%, and 3.4%, respectively, compared with that of Q1, although statistical significance was not observed for Q2.
DISCUSSION
This community-based study in Korean women showed an independent and inverse association between dietary Na+/K+ ratio and BMD of the lumbar spine and total femur after adjustment for multiple covariates. Total femur BMD was significantly decreased according to dietary Na+/K+ quartiles, and lumbar spine BMD was significantly decreased according to dietary sodium and Na+/K+ quartiles. No significant association was found between dietary potassium intake and the BMD of the lumbar spine or total femur. These results showed that the total femur and lumbar spine BMD tended to decrease as the dietary Na+/K+ ratio increased.
Many studies have reported associations between the Na+/K+ ratio and risk factors related to cardiovascular disease (CVD) in the general population [20-23]. A higher urinary Na+/K+ ratio is also associated with an increased risk of subsequent CVD [24]. However, only a few studies have focused on the combined effects of sodium and potassium on bone health. One community-based cross-sectional study showed that the urinary Na+/K+ ratio was inversely associated with BMD in the whole body, total hip, trochanter, and intertrochanter, but not the individual creatinine-adjusted values of sodium or potassium in women [16]. Consistent with previous studies, our study found that the dietary Na+/K+ ratio also had stronger inverse associations with BMD, supporting the hypothesis that the combined effect of these two electrolytes plays a role in the pathogenesis of chronic disease [25].
Several studies have reported that bone rebuilding varies inversely with the sodium intake [26,27]. Sodium intake elevates urinary calcium excretion and may lead to increased bone remodeling and loss [28]. The KNHANES 2008–2011, which used dietary Na+ intake to find a relationship with osteoporosis, found that participants with a higher sodium intake (≥4,001 mg) showed a significantly higher odds ratio (OR) for developing lumbar and femoral neck osteoporosis than those with a lower intake (≤2,000 mg) in Korean menopausal women (OR, 1.59; P=0.011) [9]. A meta-analysis summarizing the relationship between dietary sodium intake and BMD and the risk of osteoporosis found a positive association between dietary sodium intake and the risk of osteoporosis (OR, 1.20; P=0.026), whereas no association was found with urinary sodium intake. Furthermore, there is no significant correlation between sodium intake and BMD [12]. Dietary sodium exhibited significant inverse associations with BMD of the lumbar spine but not with BMD of the total femur in this study.
High dietary potassium intake is beneficial for the maintenance of bone mass [15]. In a prospective cohort study of elderly postmenopausal women, participants in the highest quartile of urinary potassium excretion had a significantly higher total hip BMD at 1 and 5 years [13]. In one interventional study, participants taking potassium citrate at 60 mEq/d showed a significant increase in lumbar BMD [29]. Conversely, a study of a 2-year trial in 276 postmenopausal women, comparing intake of high-dose potassium citrate, low-dose potassium citrate, placebo, and 300 g of additional fruit and vegetables/d, showed no beneficial effect on either bone turnover or BMD. In our study, we did not find any significant association between dietary potassium intake and BMD of the lumbar spine or the total femur. These results suggest that potassium does not improve bone health alone [30].
The possible mechanism for the favorable impact of dietary minerals on bone metabolism is based on the acid-base balance hypothesis [31]. Bone minerals function as a buffer base. In Western diets, high levels of meat and grain and low levels of fruits and vegetables may cause metabolic acidosis. As age increases, systematic metabolic acidosis worsens while renal function declines. Alkaline calcium salts in the skeleton cushion the acidic pH, resulting in bone loss. Therefore, alkaline potassium salts or supplements (potassium bicarbonate or potassium citrate excluding potassium chloride) produced by the metabolism of fruits and vegetables may protect against bone resorption via pH homeostasis [32].
The current study has some limitations. First, our results cannot establish causality between the Na+/K+ ratio and BMD, owing to the cross-sectional nature of the study. Therefore, longitudinal studies are required to establish the causality between the Na+/K+ ratio and BMD or osteoporosis. Second, dietary intake of sodium, potassium, and other nutrients was evaluated via a 24-hour dietary recall questionnaire, and the frequency of 63 food-items may not correspond to the participants’ usual intake. Lastly, we could not exclude the possibility of potential confounding variables, such as calcium or vitamin D supplementation, which have previously exhibited strong influences on BMD, even if we adjusted for the relevant confounders. Despite these limitations, this is the first study to identify the association between the dietary Na+/K+ ratio and BMD in middle-aged Korean women.
Our findings reveal an independent and inverse association between the dietary Na+/K+ ratio and BMD of the lumbar spine and total femur in Korean women aged 50 years or older. The association between BMD and combined sodium and potassium was stronger than that with either dietary sodium or potassium alone. These results highlight the importance of providing a good basis for recommending reduced salt intake, balanced Na+/K+ intake, and sufficient fruit intake to prevent osteoporosis in middle-aged women.