INTRODUCTION
Dyslipidemia refers to a state of high total cholesterol, high triglyceride, high low-density lipoprotein (LDL) cholesterol, and low high-density lipoprotein (HDL) cholesterol. Low HDL cholesterol, high triglyceride, and high LDL cholesterol were the major risk factors for cardiovascular disease as well as fasting blood glucose, and these were found to be the leading causes of death from cardiovascular disease [1]. However, dyslipidemia patients tend to neglect the prevention of cardiovascular disease because there are no special symptoms[2]. Since they have lower medication compliance than patients with other chronic diseases, improving medication compliance has become a recent issue. In the case of dyslipidemia, rare differences in treatment policies throughout the country are caused by globally accepted treatment guidelines. Therefore, it is more important to improve compliance than choose the treatment policy to improve disease outcome [3]. This means that the higher the medication compliance, the better the expected disease outcome.
Patient centeredness is closely associated with medication compliance according to previous studies, and the patient experience survey is the most widely accepted method of assessing patient centeredness [4]. This is meaningful in that patient experience is evaluated from the patient’s point of view. Capturing the patients’ perspective of health care is becoming increasingly important as health systems strive to be more responsive to the needs of the people using their services [5]. In 2015, patient experience which was used by the Organization for Economic Cooperation and Development Health Care Quality Indicators were surveyed in the Korea National Health and Nutrition Examination Survey (KNHANES) in Korea [6,7].
We hypothesized that patient-centered care with good patient experience was associated with higher medication compliance. Those who have had a positive patient experience with their doctors would adhere to their medication better than those who did not. Therefore, we conducted an analysis to examine the association between patient experience and medication compliance of patients with dyslipidemia using national data from the KNHANES.
METHODS
1. Research Design
In accordance with the procedures provided by the Korea Disease Control and Prevention Agency (KDCA), the original data request form and use plan summary were submitted through the KNHANES homepage (http://knhanes.cdc.go.kr). We obtained approval from the KDCA to use the original data.
2. Research Subjects
Of the 7,380 subjects surveyed through the KNHANES in 2015, 1,333 children and adolescents were excluded. Out of the 6,047 subjects aged 19 or older, 817 subjects who did not answer the question “Have you been diagnosed with dyslipidemia by a doctor?” were excluded. Among the 5,230 subjects, 4,353 had not been diagnosed with dyslipidemia while 877 had been diagnosed with the disease, of which 113 were excluded because their information on the patient experience survey was missing. Finally, based on the question, “Are you currently taking medication to lower blood cholesterol levels?” the remaining 764 subjects were divided into the compliant group with 497 subjects, and the non-compliant group with 267 subjects.
3. Outcomes
1) Medication compliance
Medication compliance, which is similar to medication adherence, refers to the act of conforming to the recommendations made by the provider with respect to timing, dosage, and frequency of taking medication [8]. On the other hand, medication non-compliance refers to the act of inappropriately taking medicine or not following the recommendations made by the physician with respect to timing, dosage, and frequency of taking the medication [9]. Previous studies on medication compliance defined compliance as taking over 80% of pills per month. Accordingly, we divided the subjects into groups based on compliance and non-compliance as follows: Subjects who answered “daily taking” to the question, “Do you currently take medication to lower your blood cholesterol?” in the KNHANES were considered to be “compliance.” Subjects were considered as “non-compliance” if they answered “more than 20 days a month,” “more than 15 days a month,” “less than 15 days a month,” or “not at all” to the question. Compliance has been defined in the same way in previous studies using the KNHANES [10,11].
2) Patient experience
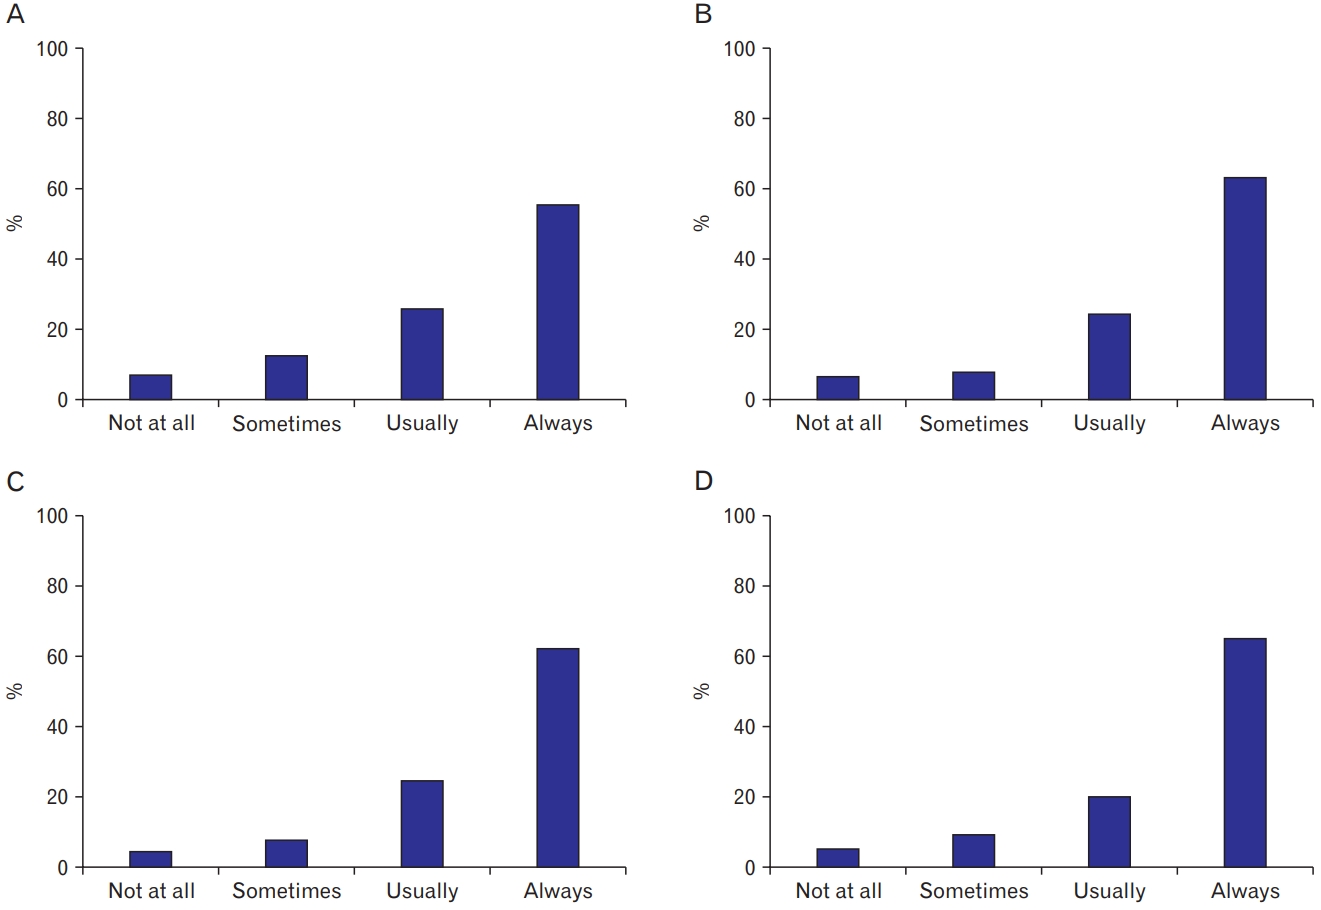
There are four indicators of patient experience with doctors in the KNHANES 2015 [5]. They indicate whether a doctor spends enough time consulting with a patient, provides an easy-to-understand explanation to a patient, gives a patient the opportunity to ask questions or raise concerns, or involves a patient in making decisions about care or treatment. For each indicator, we divided the subjects into two groups: “positive patient experience” and “negative patient experience.” Subjects who answered “always” or “usually” were considered as having had a positive patient experience. Those who answered “sometimes” or “not at all” were considered as having had negative patient experiences.
3) Measurement of covariates
The covariates included age, sex, body mass index (BMI), marital status, education level, occupation, household income level, smoking, alcohol consumption, total energy intake, and comorbid conditions. Body weight and height were measured by well-trained examiners, and BMI was calculated as weight divided by the square of height (kg/m2). Marital status was categorized into five groups: unmarried, married, separated, widowed, and divorced. Education level was divided into four groups: below elementary school level, middle school graduate, high school graduate, and university or post-graduate degree level. Occupation was categorized into seven groups: managers, clerical workers, service workers, agricultural workers, fishery workers, craft workers, elementary workers, and unemployed. Household income levels were divided into quartiles.
The medical histories of comorbid conditions (i.e., stroke, cardiovascular disease, diabetes, chronic kidney disease, chronic obstructive pulmonary disease, liver disease, and cancer) and health-related behaviors such as smoking status and alcohol consumption, were gathered using a self-reported questionnaire. Smoking status was categorized as never smoked, ex-smoker, or current smoker. Alcohol drinking was divided into two groups: those who are currently drinking and those who have abstained from drinking in the last year. Daily total energy intake was assessed using a single 24-hour recall method.
4. Data Analysis
The KNHANES data uses a complex sampling design, including stratification, clusters, and weights, to represent the entire Korean population. All statistical analyses in this study were performed using a complex sample analysis procedure that reflected strata, clusters, and weighted values applied to the KNHANES 2015. The comparisons of the characteristics of the study subjects according to medication compliance were conducted using a descriptive analysis for continuous variables and frequency analysis for categorical variables. Means and standard errors (SEs) are presented for continuous data, and unweighted numbers and weighted percentages for categorical data.
The two groups, compliance and non-compliance, were compared according to their responses on the patient experience survey using the χ2 test. Potential confounders for medication compliance were age, sex, BMI, duration of dyslipidemia, demographic factors (marital status, education level, occupation, and income level), health behavioral factors (smoking status and alcohol use, total energy intake, and comorbid conditions). The adjusted odds ratios (ORs) and 95% confidence intervals (CIs) were calculated using a multivariate logistic regression to assess the relationship between patient experience and medication compliance of patients with dyslipidemia after adjusting for confounders. The statistical significance was set at P<0.05. All analyses were conducted using IBM SPSS ver. 25.0 (IBM Corp., Armonk, NY, USA).
RESULTS
1. Basic Characteristics
This study analyzed a group of patients taking dyslipidemia medication. The total number of patients with dyslipidemia was 4,855,936. Of the total number of patients, 536,996 were excluded from the study for not responding to the items on patient experience, and 80,256 were excluded for not responding to the questionnaire on the statistical correction parameters. In the final sample, 4,238,684 patients were analyzed statistically. The basic characteristics of the subjects are presented below (Table 1).
According to the above-mentioned criteria, the number of subjects in the compliant group was 2,610,286 (61.6%), and the number of subjects in the non-compliant group was 1,628,399 (38.4%). The mean age of the compliant group was 61.07 (SE=0.729), while that of the non-compliant group was 58.49 (SE=2.891). The subjects showed significant differences in medication compliance according to age, diagnosis age, marital status, education level, and income level, but there was no significant difference in sex and occupation.
2. Patient Experience and Compliance with Dyslipidemia Medication
After we grouped the study subjects according to their positive and negative experiences for each indicator of patient experience, the medication compliant group had more positive patient experiences with their doctors than the medication non-compliant group in three indicators (whether a doctor spends enough time consulting with a patient, providing an easy-to-understand explanation to a patient, and involves a patient in making decisions about care or treatment) (Table 2). However, there was no significant difference in distribution between the two groups for the indicator “giving a patient the opportunity to ask questions or raise concerns.”
3. Association between Patient Experience and Medication Compliance
Table 3 shows the results of the multivariate logistic regression analysis to evaluate the association between patient experience and medication compliance of patients with dyslipidemia. After adjusting for confounders, the group that showed a positive response for the patient experience indicator “doctor spends enough time consulting with a patient” was 1.89 times more compliant than the group who showed a negative response (95% CI, 1.03–3.48; P=0.04). For the indicator, “doctor provides easy-to-understand explanations,” the group with a positive response was 2.74 times more compliant than the group with a negative response (95% CI, 1.39–5.39; P=0.004). Subjects with a positive patient experience for the indicator “doctor involves patients in decisions about care or treatment” were 2.07 times more compliant than those with a negative experience (95% CI, 1.02–4.22; P=0.04). However, positive patient experience was not significantly associated with dyslipidemia medication compliance (95% CI, 0.77–2.36; P=0.30) for the indicator “doctor provides a chance to ask questions about treatment.”
DISCUSSION
In this study, we found that positive patient experience was associated with better medication compliance in patients with dyslipidemia. Medication compliance with dyslipidemia was significantly associated with age, marital status, education level, and comorbid conditions. The impact of positive patient experience on high adherence to dyslipidemia medication appears to be mediated through these factors. Positive patient experience may be associated with good medication compliance for various reasons, including physical conditions or sociodemographic background. Although the indicator “whether the doctor gives a patient the opportunity to ask questions or raise concerns” showed no significant results among the four indicators of patient experience, it is widely accepted that asking questions to one’s doctor can improve patient care, build trust, and lead to better treatment results. High medication adherence may be a complex web of good doctor-patient relationships that can have a positive impact on a patient’s ability to adhere to their medications.
Based on the Pick’s Institute’s seven components of patient centeredness [12,13], the four indicators used to estimate patient experience are relevant to the components of information and education. Therefore, positive patient experience in our study is closely related to high quality patient education, although the two are not the same. Therefore, patient experience may be one of the components of patient centeredness. However, it is more of a subjective feeling than an objective indicator because it is experienced by the patients who reported about their feelings during the consultation with their doctors. Therefore, we focused on the patient experience itself because we believe that patient experience carries a more significant meaning than patient education alone.
The correlation between patient centeredness and disease outcomes has been previously studied. Stewart et al. [14] studied 315 patients from 39 random family physician clinics and found that patient-centered care was correlated with patients’ perceptions of finding common ground. In addition, positive perceptions (both the total score and subscore on finding common ground) were associated with better recovery from their discomfort and concern, better emotional health two months later, and fewer diagnostic tests and referrals. Campbell and McGauley [15] insisted that long-term chronic illnesses require a more cooperative management from physicians and patients, and the lack of understanding of emotional, psychological, or patient experiences in this process can severely disrupt treatment. These studies explain why positive experiences improve medication compliance in our study.
This study has several limitations. First, the study’s cross-sectional design did not reveal the causal relationship between the variables. In other words, it cannot determine whether patients with a positive patient experience have high medication compliance, or whether those who are compliant with medication policy reported a positive patient experience. However, it is clear that positive patient experience is associated with improved compliance in the overall statistical results.
Second, patients responded positively in the patient experience survey, and the frequency of responses was biased towards positive, which lowered the fitness of the statistical model. Figure 1 shows the response distribution of the patient experience indicators. However, this is traditionally attributed to the attitudes of patients towards doctors, which is a trend that has also been observed in previous studies. Weiss and Lonnquist [16] reported in their book that patient satisfaction surveys in hospitals tend to have higher response rates and better outcomes than other industry satisfaction surveys. Carr-Hill [17] insisted in his article that patients are more likely to respond with satisfaction unless they have special circumstances. Crow et al. [18] also reported the same finding in their study. According to the 2017 Patient Experience Survey, the level of patient satisfaction may be influenced by the authoritarian relationship between the physician and the patient. In an authoritarian hospital culture, patients may not be able to underestimate hospitals and doctors. However, despite these limitations, we examined whether positive patient experience is associated with good medication compliance using a large database that is representative of the general Korean population. In addition, we adjusted for potential variables, including comorbid conditions that might influence medication compliance.
In conclusion, this study was conducted to analyze the relationship between positive patient experiences and medication compliance. Positive patient experiences were positively correlated with medication compliance. Therefore, based on the results of this study, providing positive patient experiences can result in better patient outcomes.