 |
 |
- Search
| Korean J Fam Med > Volume 36(3); 2015 > Article |
Abstract
Background
Given that a substantial number of daily activities take place in neighborhoods, a convenient and effective method for measuring the physical activity of individuals is needed. Therefore, we tested the validity and reliability of the Korean version of the Neighborhood Physical Activity Questionnaire (K-NPAQ), which was developed through translation and back-translation of the NPAQ.
Methods
The K-NPAQ was administered twice, with a 1-week interval, to participants in the study who were recruited at a health promotion center. We assessed energy expenditure and compliance using an accelerometer and an activity diary. The Kappa statistic and Spearman correlation coefficient were used to evaluate the test-retest reliability of the K-NPAQ, and the Spearman rank correlation was used to assess the validity.
Results
Of the 122 participants, 43 were excluded owing to a lack of compliance. The Kappa values for all items that were used to assess walking or cycling within or outside the neighborhood were >0.424; 0.251-0.902 for 5 items related to the purpose of the physical activity; 0.232-0.912 for most items related to the number of times and the duration for each types of physical activity. The total energy expenditure and the energy expenditure in the neighborhood were significantly correlated with the K-NPAQ and the accelerometer, with correlation coefficients of 0.192-0.264.
Obesity and decreased physical activity have been associated with cardiovascular disease, type 2 diabetes, colorectal cancer, breast cancer, and premature death among both sexes, regardless of the etiology.1,2) Regular exercise with moderate-to-high intensity can reduce the incidence of obesity, prevent cardiovascular disease, increase life expectancy, and extend the life span without cardiovascular disease.3) Additionally, aerobic and muscular strength exercises performed at regular intervals have been associated with a significant reduction in the prevalence of psychological illnesses such as depression, anxiety, and panic disorders.4)
Given that a considerable proportion of the daily activities of an individual take place in the surrounding neighborhood, a number of studies have reported on the association between factors in the residential environment and physical activity.5) In areas where walking is favored, the number of people who exercise adequately and with the recommended intensity was higher, while the prevalence of obesity and senile depression was lower.6,7)
Although there have been a few physical activity questionnaires that discriminated the places between within and outside the neighborhood where walking or bicycling were performed, the exact amount of physical activity that took place within the neighborhood could not be calculated.8,9) Giles-Corti et al.10) presented and confirmed the reliability of the Neighborhood Physical Activity Questionnaire (NPAQ) for measuring walking and overall activity within the neighborhood. Thirty-five items were developed to measure the frequency and duration of walking and cycling within and outside the local neighborhood, to assess the specific place where the activity was performed, and to measure the frequency and duration of other physical activities. Adequate reliabilities were observed for all items among Australian, Canadian, and Belgian adults, and the validity of the walking components was satisfactory among elderly Chinese individuals.10,11,12,13)
This study was designed in order to develop a Korean version of the Neighborhood Physical Activity Questionnaire (K-NPAQ), which was related to the walkable environment of the neighborhood, to confirm both the validity and reliability of this tool.
After receiving permission from the original NPAQ development team, we followed the standard methods for translation and cross-cultural adaptation of the questionnaires.14) Two highly educated translators who were fluent in both English and Korean translated the NPAQ into Korean. The research study group developed a single form using the cross-cultural adaptation procedures. Two native English speakers independently back translated the document, and the research group described the results in a single document. The original NPAQ development team then confirmed the similarity for the backward translated questionnaires with the original one.
Study volunteers who were 20 to 71 years of age were recruited from a health promotion center where healthy individuals underwent periodic health examinations and cancer screening tests. The exclusion criteria were the following: acute or chronic illnesses that interfered with physical activity, and night shift workers who were expected to perform irregular daytime activities.
The NPAQ development study enrolled 121 participants, and the test-retest reliability analysis was performed on 82 subjects.10) Assuming a correlation coefficient of 0.4 to 0.6 between the assessment tool and the actual physical activity measurement, and considering a drop-out rate of 35%, an ╬▒ error of 0.05, and a ╬▓ error of 0.1, the number of participants needed for the study was calculated using the following equation: where r was the correlation coefficient, ╬▒ referred to the ╬▒ error, and ╬▓ to the ╬▓ error.15) The minimum number of participants needed for the study was calculated to be 96. Nonetheless, the study was designed to enroll 120 participants, similar to the previous NPAQ development study.
The K-NPAQ was administered to participants with an interviewer-assisted self-report questionnaire. The neighborhood was defined as all areas that were within a 10 to 15 minutes walk from the home of the participant. For the test-retest reliability analysis, the same questionnaire was also administered 7 days later.
Physical activity on the K-NPAQ was divided into walking for transport (2.5 metabolic equivalents, MET), walking for recreation/health (3.5 MET), cycling for transport (6.8 MET), cycling for recreation/health (8.0 MET), other moderate activity during leisure time (4.0 MET), and vigorous activity during leisure time (8.0 MET), based on the previous compendium.16) The location where the activities were performed was divided into 'neighborhood' and 'at a distance,' and the list of behavior-specific destinations was provided. The energy expenditure (kcal/6 days) for specific types of physical activities and the total energy expenditure (TEE) were calculated. The TEE was calculated based on the sum of all activities including both moderate and vigorous, regardless of the place where the activities were performed. The neighborhood energy expenditure (NEE) was calculated only using walking and cycling within the neighborhood, as the questionnaire did not distinguish between locations for moderate and vigorous activities.
An accelerometer (Lifecorder, Kenz, Japan) was used to assess the TEE and NEE over 6 consecutive days. The Lifecorder is a uniaxial accelerometer that has been used to precisely assess physical activity.17,18,19) The participants were instructed to wear the Lifecorder upon awakening in the morning and to remove it just before going to bed at night. Additionally, a self-administered activity log was recorded for 6 days in which the time of awakening, sleeping, and entering or exiting the neighborhood was documented.
Physical activity measured by the accelerometer was calculated in terms of the TEE, total hours of activity over 6 days, the NEE, and hours of activity in the neighborhood using raw data derived from the instrument and the activity log. The intensity of the activity was expressed as grades 0-9, with the Lifecorder representing 0, <1.8, 2.3, 2.9, 3.6, 4.3, 5.2, 6.1, 7.1, and 9.1 MET, respectively.19) Grades 0 was not counted as actual physical activity. Grades 1-3 were designated as mild, grades 4-6 as moderate, and grades 7-9 as vigorous activity. The total activity time was defined based on the activity log as the total hours, with the exception of sleeping hours, over 6 consecutive days.
Compliance was considered to be good when the total activity time was >96 hours and when the accelerometer was worn for >70% of the total activity time. Participants who were poorly compliant with respect to the accelerometer and those who did not complete the second K-NPAQ were excluded from the analysis.
Test-retest reliability was assessed using the Kappa value and the percent agreement for dichotomous variables. The Spearman correlation coefficient was used for continuous variables after an examination for a normal distribution showed that every data set had skewed deviations. The degree of agreement was defined as slight agreement (<0.2), fair (0.2-0.4), moderate (0.4-0.6), substantial (0.6-0.8), and almost perfect (>0.8), based on the Kappa value and the Spearman correlation coefficient.20)
The Spearman rank correlation was used to assess the validity of the K-NPAQ by comparing the level of daily activity from the initial K-NPAQ data with the actual energy expenditure data from the accelerometer, which was regarded as the gold standard. The statistical analysis was performed using IBM SPSS ver. 22.0 for Windows (IBM Co., Armonk, NY, USA).
Of a total of 122 subjects who were enrolled in the study, 43 were excluded from the analysis owing to either missing the second questionnaire (n=22) or a lack of compliance with the accelerometer (n=38). Thus, 79 subjects were included in the statistical analysis. The number of subjects for each analysis differed with respect to the different response rates to each of the items.
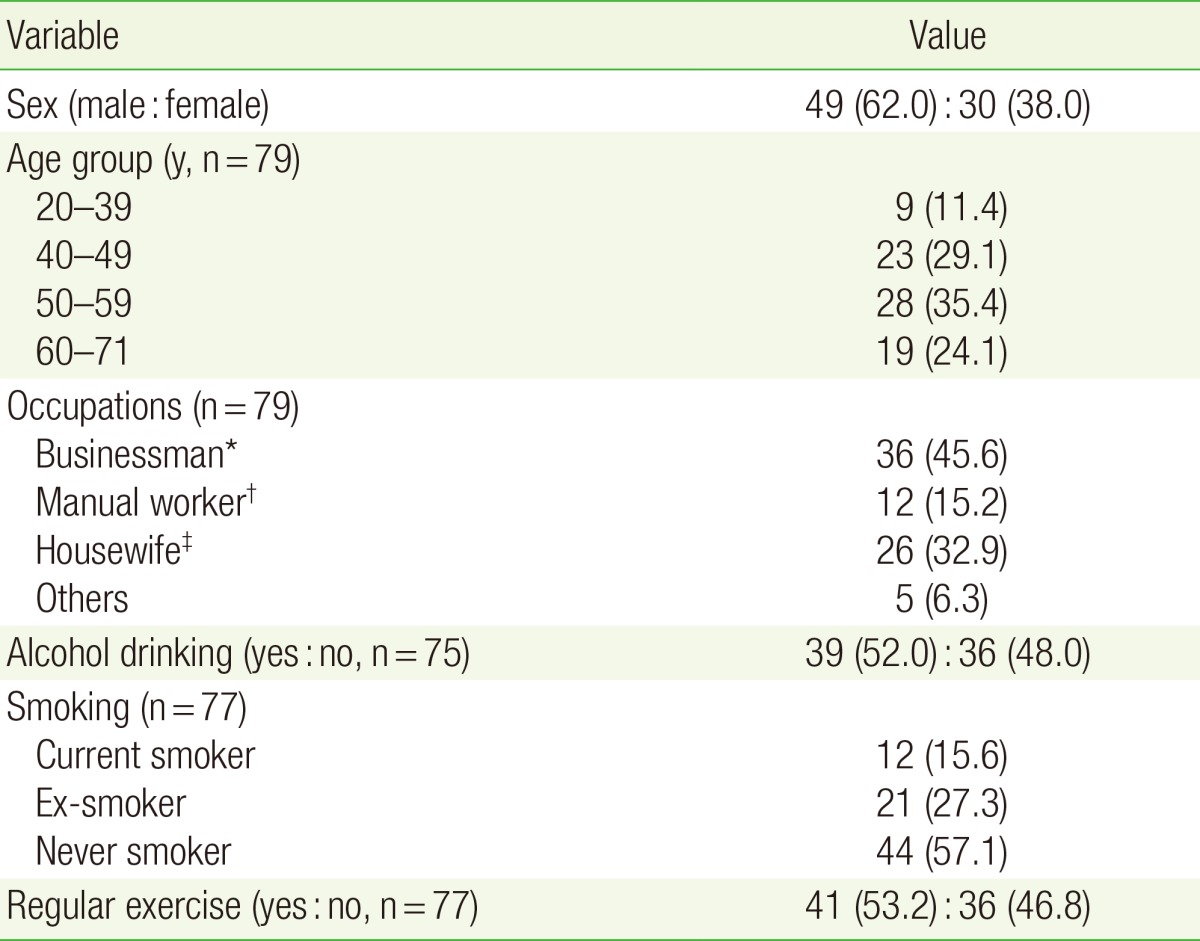
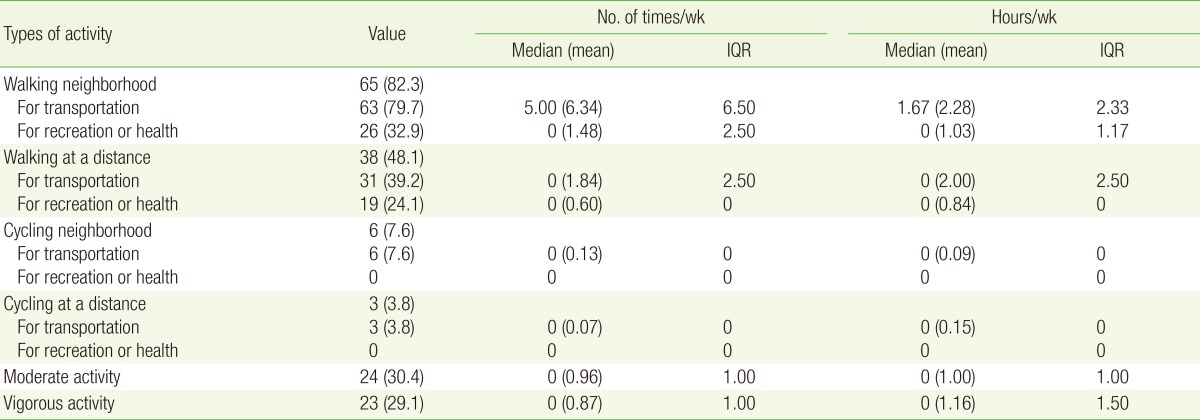
Among the respondents, 53.2% answered that they exercised regularly and 24.1% of the participants had at least one chronic metabolic disease (Table 1). Among the different types of physical activities, walking in the neighborhood for transportation had the highest frequency (79.7%), with median values of 5 times and 1.67 hours per week. In terms of the other types of physical activity, less than half of the participants answered that they typically performed these activities (Table 2).
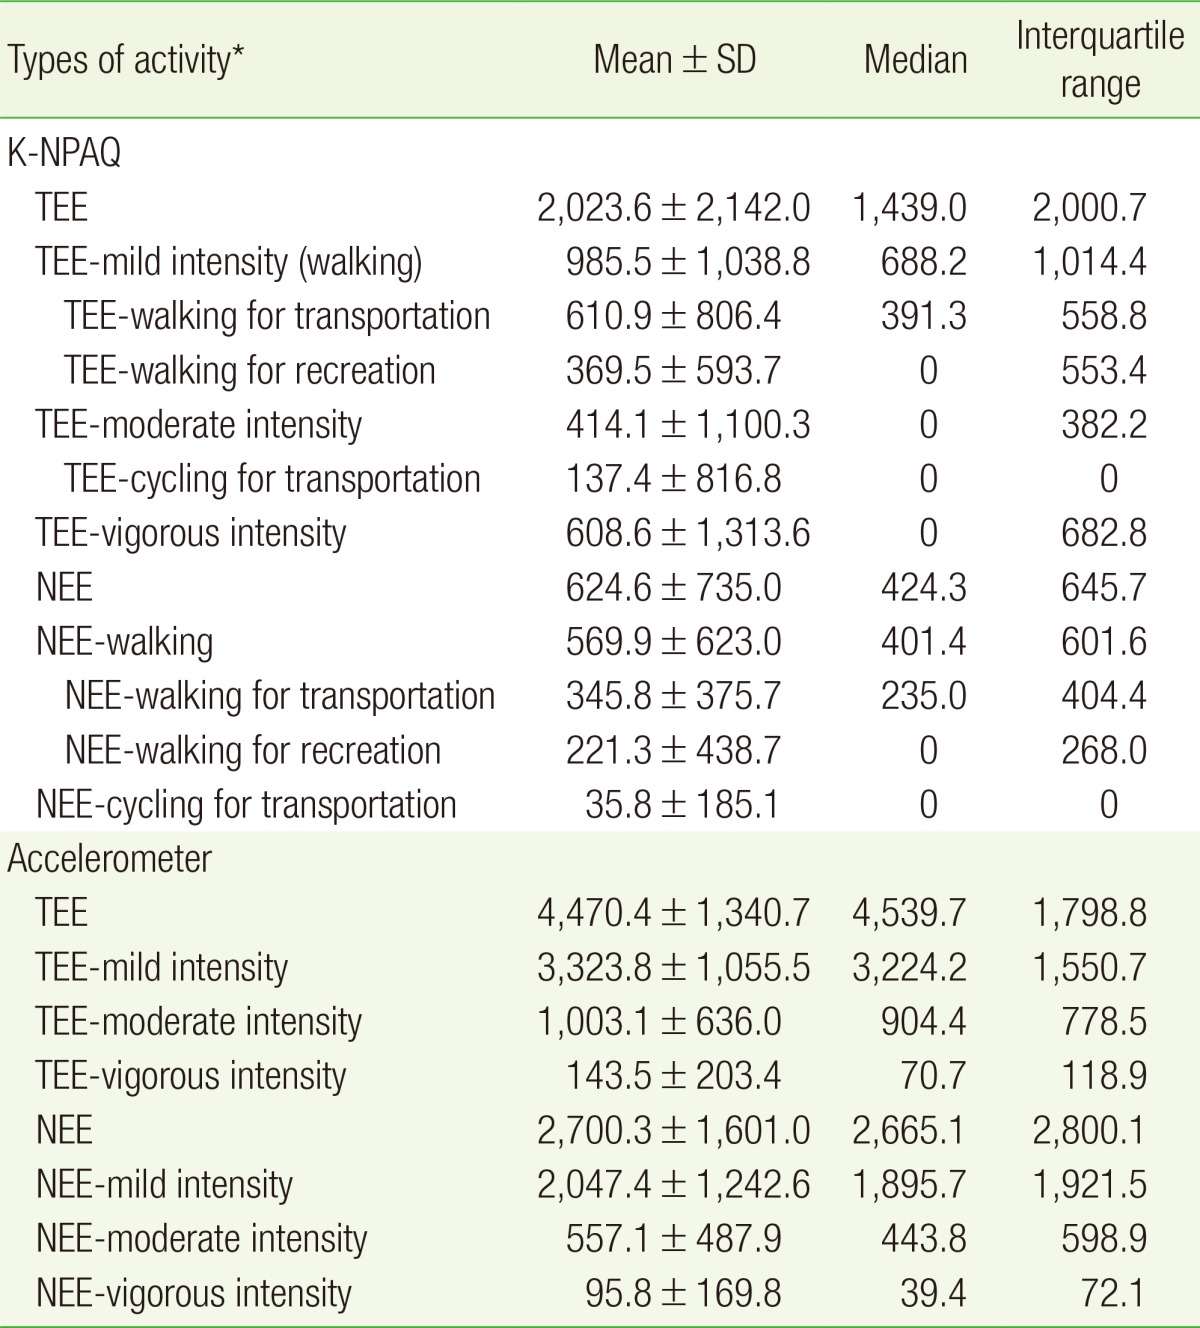
None of the subjects reported cycling for recreation within or outside the neighborhood. Normal distributions were observed for the total activity time, hours of wearing the accelerometer, TEE, and TEE with mild intensity. However, skewed deviations were observed for the other variables (Table 3).
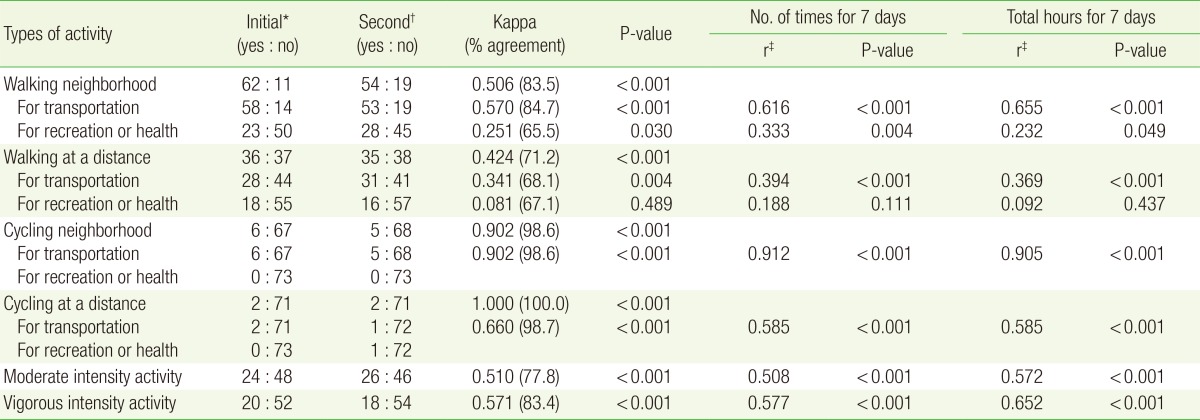
The Kappa values for items that assessed walking in the neighborhood, walking at a distance, cycling in the neighborhood, cycling at a distance, moderate activity, and vigorous activity were >0.424, which was indicative of a moderate correlation. Items regarding the purpose of physical activity had different levels of reliability: there was a moderate correlation with walking in the neighborhood for transport, a fair correlation with walking in the neighborhood for recreation/health and walking at a distance for transport, no significant correlation with walking at a distance for recreation/health, and a substantial to almost perfect correlation with cycling for transport. The Kappa values were not calculated for cycling for recreation/health (Table 4).
Items regarding cycling in the neighborhood for transport showed almost perfect agreement with both the number of times the activities were performed and the duration. Items regarding walking in the neighborhood for transport were substantially correlated, while cycling at a distance for transport, moderate activity, and vigorous activity were only moderately correlated with both the number of times the activities were performed and the duration. Items regarding walking in the neighborhood for recreation and walking at a distance for transport were fairly in agreement with both the number of times the activities were performed and the duration. Analysis of cycling for recreation was not performed (Table 4).
All items regarding the usual places of walking in the neighborhood for transport showed moderate-to-good agreement with the Kappa values (0.450-0.793). Items for the places of walking in the neighborhood for recreation, the Kappa values were significant for the beach/lakeshore (0.412) and shopping (0.225) items. For walking at a distance for transport, work (0.332), a friend's house (0.412), public transport (0.359), and shopping (0.274) were statistically significant. For walking at a distance for recreation, only the sidewalk (0.793) was significant. For cycling in the neighborhood for transport, only shopping (0.66) was significant. Finally, for cycling at a distance for transport, no items showed statistically significant agreement (data not shown).
The TEE, TEE-vigorous, NEE, and energy expenditure calculated for walking in the neighborhood were statistically significant but showed poor agreement with the accelerometer (correlation coefficient 0.192-0.264, P<0.05), whereas the other variables did not show statistically significant agreement with the Spearman rank correlation (Table 5).
The NEE was 60.4% of the TEE. Mild, moderate, and vigorous intensity NEE accounted for 61.6%, 55.6%, and 66.7% of the TEE, respectively. The neighborhood activity time was 42.6% of the total activity time. Mild intensity activity was responsible for 74.4% of the TEE and 75.8% of the NEE, moderate intensity activity accounted for 22.4% of the TEE and 20.6% of the NEE, and vigorous intensity activity accounted for 3.2% of the TEE and 3.5% of the NEE.
This study was performed in order to develop the K-NPAQ as a convenient and efficient tool for measuring physical activities around the neighborhood, and to assess the reliability and validity of this questionnaire. Among various types of physical activity, mild intensity activity within the residential area such as walking around the neighborhood has significant implications for total daily activities among many Korean individuals. A survey of health behaviors performed by the Korean National Health and Nutrition Examination Survey showed that the preferred exercises were walking, mountain hiking or climbing, jogging, and fitness. The results indicated that 60.7% of individuals who performed regular exercise chose walking as their exercise.21) Among our study participants, 90% reported that they walked for transport or recreation inside or outside the neighborhood. Only a small number of individuals participated in bicycling, 6 of who biked for transport within the neighborhood, 2 for transport at a distance, and none for recreation and/or fitness. Additionally, although the time spent around the neighborhood was 42.6% of the total activity time, the amount of neighborhood physical activity was around 60% of the total, with mild intensity activity accounting for 75% of the total activity.
The energy expenditure calculated with the K-NPAQ was only 23.1% to 45.2% of the actual energy expenditure measured with the accelerometer for most activity intensities, with the exception of vigorous activity. These results were similar to the outcomes reported in previous studies.22,23) Daytime activities such as housework and standing/riding in cars were not included in the questionnaire. Some events may have been omitted owing to recall bias. The actual METs could have been higher than those reported in the compendium. Some participants answered that they were performing vigorous exercise aside from the measured data.
In conclusion, we have confirmed the validity and reliability of the K-NPAQ for the assessment of mild intensity physical activity within the neighborhood, which accounts for the large amount of typical daytime physical activity. In addition to assessing and encouraging physical activity among individuals, the K-NPAQ may also contribute to the design of new instruments for the investigation of walkable surroundings, which could support public health and city planning activities.
ACKNOWLEDGMENTS
This work was supported by the Research Settlement Fund for new faculty at Seoul National University.
References
1. Blair SN, Cheng Y, Holder JS. Is physical activity or physical fitness more important in defining health benefits. Med Sci Sports Exerc 2001;33(6 Suppl):S379-S399. PMID: 11427763.


2. Hu G, Tuomilehto J, Silventoinen K, Barengo NC, Peltonen M, Jousilahti P. The effects of physical activity and body mass index on cardiovascular, cancer and all-cause mortality among 47 212 middle-aged Finnish men and women. Int J Obes (Lond) 2005;29:894-902. PMID: 15724141.


3. Franco OH, de Laet C, Peeters A, Jonker J, Mackenbach J, Nusselder W. Effects of physical activity on life expectancy with cardiovascular disease. Arch Intern Med 2005;165:2355-2360. PMID: 16287764.


4. Paluska SA, Schwenk TL. Physical activity and mental health: current concepts. Sports Med 2000;29:167-180. PMID: 10739267.


5. Owen N, Leslie E, Salmon J, Fotheringham MJ. Environmental determinants of physical activity and sedentary behavior. Exerc Sport Sci Rev 2000;28:153-158. PMID: 11064848.

6. Powell KE, Martin LM, Chowdhury PP. Places to walk: convenience and regular physical activity. Am J Public Health 2003;93:1519-1521. PMID: 12948973.


7. Berke EM, Gottlieb LM, Moudon AV, Larson EB. Protective association between neighborhood walkability and depression in older men. J Am Geriatr Soc 2007;55:526-533. PMID: 17397430.


8. Elley CR, Kerse NM, Swinburn B, Arroll B, Robinson E. Measuring physical activity in primary health care research: validity and reliability of two questionnaires. NZ Fam Physician 2003;30:171-180.
9. Wareham NJ, Jakes RW, Rennie KL, Mitchell J, Hennings S, Day NE. Validity and repeatability of the EPIC-Norfolk Physical Activity Questionnaire. Int J Epidemiol 2002;31:168-174. PMID: 11914316.


10. Giles-Corti B, Timperio A, Cutt H, Pikora TJ, Bull FC, Knuiman M, et al. Development of a reliable measure of walking within and outside the local neighborhood: RESIDE's Neighborhood Physical Activity Questionnaire. Prev Med 2006;42:455-459. PMID: 16574208.


11. McCormack GR, Shiell A, Doyle-Baker PK, Friedenreich C, Sandalack B, Giles-Corti B. Testing the reliability of neighborhood-specific measures of physical activity among Canadian adults. J Phys Act Health 2009;6:367-373. PMID: 19564667.


12. Dyck DV, Cardon G, Deforche B, De Bourdeaudhuij I. Urban-rural differences in physical activity in Belgian adults and the importance of psychosocial factors. J Urban Health 2011;88:154-167. PMID: 21274644.


13. Cerin E, Barnett A, Sit CH, Cheung MC, Lee LC, Ho SY, et al. Measuring walking within and outside the neighborhood in Chinese elders: reliability and validity. BMC Public Health 2011;11:851PMID: 22070768.


14. Guillemin F, Bombardier C, Beaton D. Cross-cultural adaptation of health-related quality of life measures: literature review and proposed guidelines. J Clin Epidemiol 1993;46:1417-1432. PMID: 8263569.


15. Hulley S, Cummings S. Designing clinical research. . Baltimore (MD): Williams & Wilkins; 1988.
16. Ainsworth BE, Haskell WL, Herrmann SD, Meckes N, Bassett DR Jr, Tudor-Locke C, et al. 2011 Compendium of Physical Activities: a second update of codes and MET values. Med Sci Sports Exerc 2011;43:1575-1581. PMID: 21681120.


17. Schneider PL, Crouter SE, Lukajic O, Bassett DR Jr. Accuracy and reliability of 10 pedometers for measuring steps over a 400-m walk. Med Sci Sports Exerc 2003;35:1779-1784. PMID: 14523320.


18. Schneider PL, Crouter S, Bassett DR. Pedometer measures of free-living physical activity: comparison of 13 models. Med Sci Sports Exerc 2004;36:331-335. PMID: 14767259.


19. Kumahara H, Schutz Y, Ayabe M, Yoshioka M, Yoshitake Y, Shindo M, et al. The use of uniaxial accelerometry for the assessment of physicalactivity-related energy expenditure: a validation study against wholebody indirect calorimetry. Br J Nutr 2004;91:235-243. PMID: 14756909.


20. Landis JR, Koch GG. The measurement of observer agreement for categorical data. Biometrics 1977;33:159-174. PMID: 843571.


21. Korea Centers for Disease Control and Prevention. Korea health statistics 2010: Korea National Health and Nutrition Examination Survey (KNHANES V-1). Cheongju: Korea Centers for Disease Control and Prevention; 2010. [2012 Aug 24]. Available from: http://knhanes.cdc.go.kr/
22. Cust AE, Smith BJ, Chau J, van der Ploeg HP, Friedenreich CM, Armstrong BK, et al. Validity and repeatability of the EPIC physical activity questionnaire: a validation study using accelerometers as an objective measure. Int J Behav Nutr Phys Act 2008;5:33PMID: 18513450.


Table┬Ā2
Results of the initial Korean version of Neighborhood Physical Activity Questionnaire (n = 79)
Table┬Ā5
Correlation of energy expenditure between K-NPAQ and accelerometer
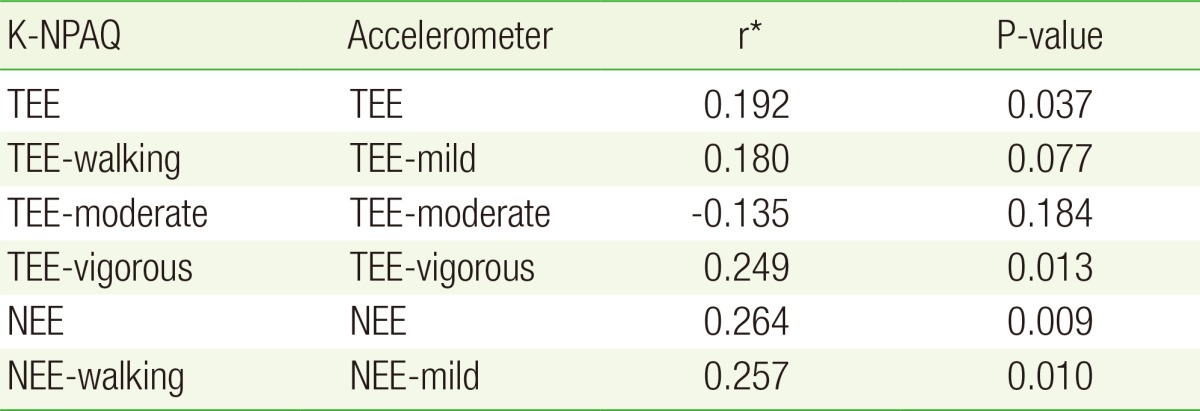
K-NPAQ, Korean version of Neighborhood Physical Activity Questionnaire; TEE, total energy expenditure; TEE-mild, total energy expenditure with mild intensity exercise; TEE-moderate, total energy expenditure with moderate intensity exercise; TEE-vigorous, total energy expenditure with vigorous intensity exercise; NEE, energy expenditure within neighborhood; NEE-mild, energy expenditure within neighborhood with mild intensity exercise.
*Spearman's correlation was used.
- TOOLS
-
METRICS

- Related articles in KJFM
-
Validity and reliability of FACES 3 when applied two of family members.1996 July;17(7)
Concurrent validity of the Korean version of selfreported questionnaire.1995 February;16(2)
Validation of the Korean Integrative Medicine Attitude Questionnaire (IMAQ)2011 March;32(3)


