INTRODUCTION
In 2018, the prevalence of diabetes mellitus, commonly known as diabetes, in Korea, was 13.8% in adults aged 30 years or older and 27.6% in adults aged 65 or older, increasing with age in both men and women [1]. The prevalence of prediabetes was 26.9% in adults aged 30 years or older and 29.6% in adults aged 65 or older, and men had a higher prevalence than women by age group [1]. Prediabetes is a metabolic state between normoglycemia and diabetes. Similar to diabetes, prediabetes is also a risk factor for cardiovascular disease (CVD). In several studies, a 1% increase in hemoglobin A1c (HbA1c) within the normal range resulted in increased 10-year cardiovascular mortality, and CVD mortality doubled in the impaired glucose tolerance (IGT) group compared with the normal glucose tolerance (NGT) group [2]. In other studies, the incidence of unrecognized myocardial infarction in the prediabetic state was 3 times higher than that in the normal group, and it was proven that patients with diabetes and prediabetes had a poor prognosis 30 days after acute ischemic stroke [2].
CVD or stroke is a disease caused by the interaction of several risk factors, including diabetes and genetic predisposition [3]. It is the most common cause of death worldwide [4]. Carotid intima-media thickness (cIMT) is an early marker for the development and progression of atherosclerosis [5]. The pathophysiology of atherosclerosis is attributed to inflammation [6]. Chronic inflammation in the blood vessel wall is thought to play an important role in the development and progression of atherosclerosis, and leukocytes and platelets are important factors in the occurrence of atherosclerosis [7,8].
The neutrophil-to-lymphocyte ratio (NLR) has been studied as a prognostic factor in CVD, lung disease, infection, endocrine disease, and some malignancies [9]. Although the correlation between NLR and CVD has not been fully established, systemic factors such as inflammation, vascular endothelial cell dysfunction, and oxidative stress are thought to have an effect [10]. A higher NLR is expected to lead to faster development and progression of atherosclerosis, and a higher NLR is associated with a higher mortality rate or can be used as a prognostic factor in patients with acute coronary syndrome or percutaneous cardiovascular intervention [8,11,12].
The development of atherosclerosis begins with prediabetes [13]. The length of the asymptomatic period in diabetes or prediabetes exposes patients to cardiovascular risk factors and increases the incidence of coronary artery disease; therefore, early diagnosis and prevention through appropriate screening is important [14]. This study was designed to investigate whether NLR as a predictive marker correlates with cIMT in prediabetes patients.
METHODS
1. Study Population
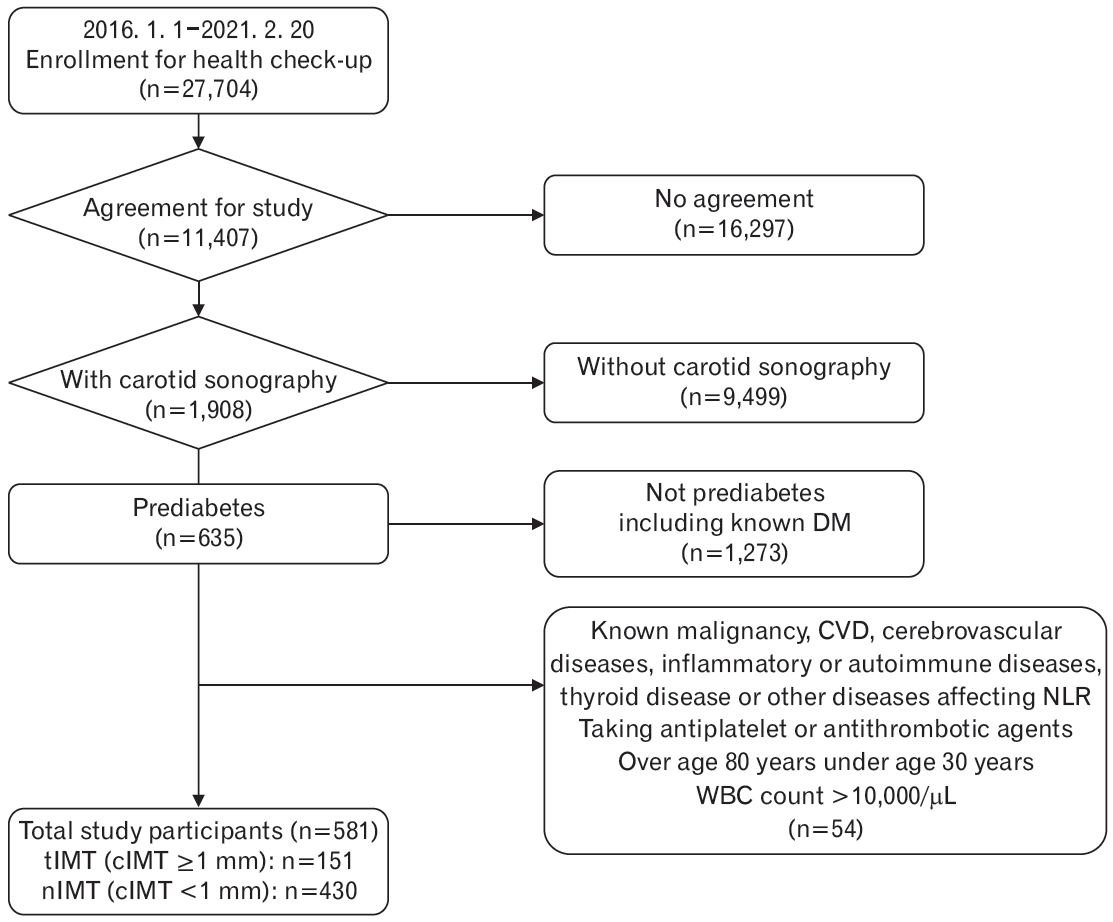
This retrospective observational study was conducted on patients who underwent a comprehensive medical examination and agreed to share their data for research purposes at the Dongtan Sacred Heart Hospital from January 1, 2016, to February 20, 2021. In this study, 581 adults aged between 30 and 80 years who underwent carotid ultrasound to evaluate cIMT were enrolled. None of the participants had been diagnosed with diabetes. Participants with malignancy, inflammatory or autoimmune diseases such as rheumatoid arthritis, osteoarthritis, ankylosing spondylitis, Crohn’s disease, cardio-cerebrovascular disease, and thyroid disease, which may affect NLR levels, were excluded. Patients who took drugs including antiplatelet agents such as aspirin or anti-thrombotic agents or white blood cell (WBC) count >10,000/µL were also excluded (Figure 1). This study was approved by the institutional review board of the Hallym University Dongtan Sacred Heart Hospital (IRB approval no., HDT 2021-07-015) and omission of informed consents were allowed because of the retrospective design of this study.
2. Materials and Methods
The results of all blood tests and anthropometric tests were collected using the results of the comprehensive medical examination at the hospital; and the participants’ past history, current medical history (e.g., whether they had been diagnosed with hypertension (HTN), dyslipidemia, diabetes, or other diseases described above, are under treatment, or on medicines) and smoking history were also identified using the interview data obtained during the examination. The diagnosis of metabolic syndrome was defined as having three or more diagnostic criteria using the data on abdominal circumference (AC), fasting blood glucose (FBG), blood pressure, triglyceride (TG), and high-density lipoprotein cholesterol (HDL-C).
All subjects fasted for at least 8 hours before examination, and blood tests were taken from the antecubital vein. The complete blood count (CBC) test was performed using a Sysmex XN-3000 automatic hematology analyzer (Sysmex Corp., Kobe, Japan). The absolute neutrophil count (ANC) and absolute lymphocyte count (ALC) were obtained by multiplying the WBC count by the percentage of neutrophils and lymphocytes, respectively, in the CBC test. The NLR was obtained by dividing the ANC by ALC. Chemistry tests such as FBG, total cholesterol (TC), TG, low-density lipoprotein cholesterol (LDL-C), and HDL-C were analyzed using the Cobas c702 module in the Cobas 8000 modular analyzer series (Roche Diagnostics, Mannheim, Germany). HbA1c was analyzed using the Bio-Rad D-100 hemoglobin testing system or the Variant II turbo analyzer 2.0 (Bio-Rad Laboratories, Hercules, CA, USA). The weight and height were obtained using an InBody 720 (Biospace Co. Ltd., Seoul, Korea), and the AC was measured by a nurse at the institution using a tape measure at the level of the belly button.
Carotid ultrasound was performed by radiology specialists using the IU-22 Philips ultrasound system (Philips Healthcare, Bothell, WA, USA) or GE LOGIQ E10 Ultrasound (GE Healthcare, Wauwatosa, WI, USA), and the cIMT was measured at the common carotid artery. Thickening was defined as a cIMT of 1 mm or more. Based on these criteria, the patients were divided into two groups: normal cIMT (nIMT <1 mm) and thick cIMT (tIMT ≥1 mm).
3. The Definition of Prediabetes
Prediabetes can be mainly divided into impaired fasting glucose (IFG) and IGT, and the criteria for HbA1c have been added [15,16]. IFG is defined as FBG between 100 and 125 mg/dL, IGT is defined as PP2 between 140 and 199 mg/dL 2 hours after the oral glucose tolerance test (OGTT), and HbA1c between 5.7% and 6.4% [15]. Because there were insufficient data on OGTT, in this study, prediabetes was defined using cases of IFG between 100 and 125 mg/dL or HbA1c between 5.7% and 6.4%.
4. Statistical Analysis
Continuous variables, such as blood tests, were presented as mean and standard deviation. The normality assumption was evaluated using the Shapiro-Wilk test, and the homogeneity of variance was evaluated using Levene’s test. Variables that were not satisfied with the normality assumption were log-transformed, a t-test was conducted, and the P-value was subsequently presented. Categorical variables such as gender, smoking history, and disease history were presented as numbers with percentiles and compared by performing a chi-square test. Binary logistic regression was performed to confirm the correlation between cIMT and NLR by adjusting for sex, age, high-sensitivity C-reactive protein (hs-CRP), FBG, HbA1c, HDL-C, AC, HTN or dyslipidemia diagnosis, and current smoking status. The odds ratios (ORs) of all variables were presented in three cases (i.e., unadjusted, model I, and model II) using logistic regression analysis; age and sex were adjusted in model I, and all variables were adjusted in model II. All statistical analyses were performed using IBM SPSS Statistics for Windows ver. 26.0 (IBM Corp., Armonk, NY, USA). All significance tests were 2-tailed, and values of P<0.05 were considered significant.
RESULTS
1. Baseline Characteristics
The baseline characteristics and blood test results of the study participants are shown in Tables 1 and 2. Among the 581 study participants, 434 (74.7%) were male and 147 (25.3%) were female, with an average age of 53.55±9.29 years. There were 151 participants with a tIMT and 430 participants with nIMT. There were 111 male participants in the nIMT group and 323 male participants in the tIMT group; whilst there were 40 and 107 female participants in the two groups, respectively.
Regarding the characteristics of the subjects according to cIMT, the average age of the tIMT group was 56.59±8.62 years, which was higher than the 52.48±9.29 years of the nIMT group (P<0.001). For men, the average age of the tIMT group was 55.62±8.85 years, which was higher than the 51.11±8.88 years of the nIMT group. For women, the average age of each group was 59.28±7.40 years and 56.61±9.31 years, respectively. NLR was 1.89±0.90 in the tIMT group and 1.71±0.69 in the nIMT group. NLR was significantly higher in the tIMT group than in the nIMT group (P=0.018). For men, NLR was 1.91±0.88 in the tIMT group and 1.72±0.70 in the nIMT group. For women, the NLR was 1.84±0.97 and 1.65±0.63 in each group, respectively. FBG and HbA1c were 105.54±11.05 mg/dL and 5.85%±0.35%, respectively, in the tIMT group, and 104.30±10.45 mg/dL and 5.71%±0.34% in the nIMT group. HbA1c was significantly higher in the tIMT group than in the nIMT group (P<0.001), whereas FBG levels were not significantly different between the two groups (P=0.230). For men, HbA1c was 5.85%±0.37% in the tIMT group and 5.69%±0.34% in the nIMT group. For women, HbA1c was 5.84%±0.27% and 5.78%±0.31% in each group respectively. In addition, systolic blood pressure (SBP) was 124.99±16.31 mm Hg and 120.65±13.50 mm Hg, respectively, which showed higher SBP in the tIMT group than nIMT group (P=0.002). For men, SBP was 125.39±12.97 mm Hg in tIMT group and 121.29±12.68 mm Hg in nIMT group. For women, SBP was 123.88±23.40 mm Hg and 118.71±15.64 mm Hg in each group, respectively. There were no statistically significant differences in the other variables.
2. The Correlation between cIMT Thickening and NLR in Binary Logistic Regression Analysis
Tables 1 and 2 show the differences between the two groups according to the cIMT. Variables that could affect cIMT in previous studies were sex, age, hs-CRP, FBG, HbA1c, HDL-C, AC, HTN, dyslipidemia, current smoking status [17,18]. However, some of these factors were not significantly correlated with cIMT in this study. Binary logistic regression analysis with NLR was performed on the variables listed above to adjust for them (Table 3).
In the regression analysis, there was a statistically significant correlation in age, NLR, and HbA1c according to the thickness of cIMT. The unadjusted OR of NLR was 1.354 (95% confidence interval [CI], 1.071–1.710) and 1.368 (95% CI, 1.078–1.737) after adjusting for age and sex (P=0.011 and P=0.010, respectively). In model II, subjects in the tIMT group were older and had higher HbA1c levels than those in the nIMT group (OR, 1.046; 95% CI, 1.022–1.070; P<0.001; OR, 2.426; 95% CI, 1.289–4.567; P=0.006, respectively), and NLR was higher in the tIMT group (OR,1.334; 95% CI, 1.038–1.714; P=0.024).
DISCUSSION
In this retrospective study, we evaluated whether there was a significant correlation between cIMT and NLR in adults who were in a prediabetic state but had not been previously diagnosed with diabetes. NLR was significantly higher in the tIMT group than in the nIMT group, and age, HbA1c, and SBP showed the same association. In the logistic regression analysis, NLR was independently correlated with cIMT after adjusting for other variables, although the OR of HbA1c was higher than that of NLR. Concerning HbA1c, the results of this study were consistent with those of several other studies that showed that cIMT was correlated with HbA1c in prediabetes and diabetes subjects [13,19,20]. Various studies and meta-analyses revealed that age, HTN, SBP, smoking history, insulin resistance, and metabolic syndrome affect cIMT, and TC or LDL-C and HDL-C, hs-CRP, fibrinogen, LOX-1, and adiponectin were found to be related to cIMT [17]. However, there was no statistically significant difference associated to some variables in this study. This may be attributed to the characteristics of the study participants, prediabetes, or the limited sample size. Furthermore, certain variables showed the heterogeneity of the association with cIMT [16] and we did not exclude participants taking lipid-lowering agents; alternatively, we adjusted for the factor by including participants diagnosed with dyslipidemia, in the logistic regression analysis.
It is known that the risk of atherosclerotic CVD is increased 2 to 4 times and cardiovascular mortality or morbidity is higher in patients with type 2 diabetes mellitus than in those without diabetes [16]. According to a recent meta-analysis, the relative risk of all-cause mortality, composite CVD, coronary heart disease (CHD), and stroke were higher in prediabetes patients than in those with normoglycemia, and the absolute risk was also higher in prediabetes patients [21]. Even in patients with atherosclerotic CVD, patients with prediabetes were at a higher risk of all-cause mortality, composite CVD, and CHD than those with normoglycemia [21]. In many large-cohort studies that have studied the relationship between cIMT and the risk of developing CVD and stroke, it has been found that cIMT helps stratify the risk of CVD [17]. In a systematic review, cIMT was found to be thicker in patients with diabetes or IGT than in the control group [18].
Li et al. [19] found that a high NLR was correlated with thick cIMT in diabetic patients and that NLR could be used as an independent risk factor for the development of asymptomatic atherosclerosis. Few studies have confirmed the relationship between NLR and cIMT in prediabetes. According to a previous Korean study, cIMT was significantly related to age and HbA1c in men with a HbA1c lower than 6.5%, whilst in women, there was a significant correlation with age; however, NLR was not evaluated in that study [20]. The strength of this study is that it revealed the association between NLR and cIMT in prediabetes patients, rather than diabetes patients, which is an understudied area. The mechanism by which NLR influences cIMT is not yet known. Chronic inflammation is known to play an important role in diabetes complications as well as in the development and progression of diabetes and prediabetes [2,22]. Several studies have shown increased levels of proinflammatory cytokines in prediabetic and diabetic patients [2,23,24]. It has been found that the hyperglycemic state continuously activates neutrophils [25], and activated neutrophils attach to vascular endothelial cells, causing damage to vascular endothelial cells [26]. Lymphocytopenia is also considered an inflammatory marker, and when corticosteroid levels increase in response to stress, inflammatory reactions and lymphocyte apoptosis occur, leading to lymphocytopenia [27].
This study has some limitations. First, it may be difficult to generalize to the public population due to the sample size and the fact that the study data were obtained from a single medical institution. Second, there may be limitations in identifying a participant’s entire medical history through questionnaires and interviews, which could have led to missing information. Third, IGT could not be included because there were insufficient OGTT records in the comprehensive examination. Fourth, the linear relationship could not be confirmed because some cIMT data could not be quantified. Fifth, except for the blood tests analyzed in this study, we did not exclude cases with abnormalities in liver, renal function or thyroid function tests (TFTs) that could cause chronic inflammation, thereby affecting cIMT results. in some studies, there was a significant positive correlation between alanine aminotransferase, γ-glutamyl transpeptidase, and cIMT and a negative correlation between eGFR and cIMT [28,29]. There was a significant difference in cIMT according to TFT, and cIMT was higher in subclinical hypothyroidism than in the euthyroid state [30].
In this study, the NLR was found to be higher in prediabetic adults with thick cIMT. In the logistic regression analysis, NLR showed an equal correlation with cIMT to an independent factor. Compared to other blood tests, NLR is a cost-effective means of evaluating CVD in primary care, and it is expected that NLR will be used as an indicator for predicting the risk of CVD in patients with prediabetes. Therefore, further research including large-scale prospective cohort studies are required to confirm the results of our study.