Comparison of the Framingham Risk Score, UKPDS Risk Engine, and SCORE for Predicting Carotid Atherosclerosis and Peripheral Arterial Disease in Korean Type 2 Diabetic Patients
Article information
Abstract
Background
To compare the predictability of the Framingham Risk Score (FRS), United Kingdom Prospective Diabetes Study (UKPDS) risk engine, and the Systematic Coronary Risk Evaluation (SCORE) for carotid atherosclerosis and peripheral arterial disease in Korean type 2 diabetic patients.
Methods
Among 1,275 registered type 2 diabetes patients in the health center, 621 subjects with type 2 diabetes participated in the study. Well-trained examiners measured the carotid intima-media thickness (IMT), carotid plaque, and ankle brachial index (ABI). The subject's 10-year risk of coronary heart disease was calculated according to the FRS, UKPDS, and SCORE risk scores. These three risk scores were compared to the areas under the curve (AUC).
Results
The odds ratios (ORs) of all risk scores increased as the quartiles increased for plaque, IMT, and ABI. For plaque and IMT, the UKPDS risk score provided the highest OR (95% confidence interval) at 3.82 (2.36, 6.17) and at 6.21 (3.37, 11.45). For ABI, the SCORE risk estimation provided the highest OR at 7.41 (3.20, 17.18). However, no significant difference was detected for plaque, IMT, or ABI (P = 0.839, 0.313, and 0.113, respectively) when the AUCs of the three risk scores were compared. When we graphed the Kernel density distribution of these three risk scores, UKPDS had a higher distribution than FRS and SCORE.
Conclusion
No significant difference was observed when comparing the predictability of the FRS, UKPDS risk engine, and SCORE risk estimation for carotid atherosclerosis and peripheral arterial disease in Korean type 2 diabetic patients.
INTRODUCTION
In the 20th century, cardiovascular disease (CVD) became the main cause of mortality and morbidity in Western populations, and the global prevalence of diabetes was estimated at 171 million in 2000.1) The risk of coronary artery disease is six times higher in type 2 diabetes patients than in the general population.2,3) Therefore, to control CVD risk factors and lower the disease burden of diabetes, a method devised to estimate the risk of CVD in diabetes patients is highly necessary.
Several surrogate measures for CVD that can estimate subclinical atherosclerosis have been developed. Common carotid artery intima-media thickness (CCA-IMT) is known to be correlated with coronary artery disease, stroke, and several other risk factors.4-6) Carotid plaque has different pathogenic characteristics compared to IMT; however, both IMT and carotid plaque share a common association with atherosclerosis and ischemic heart.7,8) The ankle-brachial index (ABI) is an easy method for measuring peripheral arterial disease (PAD) and is commonly used to screen peripheral vascular disease in patients with diabetes.9)
Wilson et al.10) estimated the risk of CVD using data from the Framingham heart study. The Framingham Risk Score (FRS) was developed to predict the incident risk of CVD according to age, low-density lipoprotein (LDL) levels, high-density lipoprotein (HDL) levels, smoking, and hypertension. Because very few diabetes patients were included in this previous study, some uncertainty remains according the accuracy of the FRS to predict CVD risk in diabetes patients.11) On the other hand, some European studies have reported that the FRS overestimates CVD risk in the general European population.12-14) To correct this overestimation, the Systematic Coronary Risk Evaluation (SCORE) project was initiated to develop an appropriate risk estimation method for the general European population.15) In 2001, the United Kingdom Prospective Diabetes Study (UKPDS) risk engine was published based on data from 5,102 newly diagnosed type 2 patients who were followed-up for an average of 10.4 years. The UKPDS includes the duration of diabetes and glycated hemoglobin (HbA1c) level as variables, thus allowing it address the risk of CVD specifically in diabetes patients.
Even though these risk scores were developed and used for controlling CVD risk factors, we do not know which risk score would better predict future CVD events in Korean type 2 diabetic patients. Therefore we investigated the association between these risk scores (FRS, UKPDS, and SCORE) and surrogate measures of CVD, such as carotid plaque, CCA-IMT, and ABI. Also we compared the predictability of these risk scores for carotid plaque, CCA-IMT and ABI in Korean type 2 diabetic patients.
METHODS
1. Study Subjects
Between October 2008 and June 2009, out of 1,275 registered type 2 diabetes patients in the public health center of Seo-gu, Gwangju and Gokseng-gun, Jeollanamdo, Korea, 709 subjects with type 2 diabetes chose to participate in this study. The response rate for this study was 55.6%. Seventy-eight subjects who had a history of CVD, and 10 subjects who did not provide a blood sample were excluded from the study. In total, 621 patients participated in this study. This study was conducted in accordance with the Declaration of Helsinki guideline. The study protocol was approved by the Institutional Review Board of Chonnam National University Hospital (IRB number for Seo-gu, Gwangju: I-2008-11-135, IRB number for Gokseng-gun, Jeollanamdo: I-2009-07-069), and informed consent was obtained from each subject.
Well-trained examiners interviewed the patients using a questionnaire that included items regarding cigarette smoking, consumption of alcohol, physical activity, duration of diabetes, diabetes complications, and hypertension medication.
Weight was measured to the nearest 0.1 kg while the subjects wore light clothes and height was measured to the nearest 0.1 cm in stocking feet. Abdominal circumference was measured to the nearest 0.1 cm at expiration through a horizontal plane around the abdomen at the level of the midpoint between the lowest rib and the iliac crest. Blood pressure was measured twice with a standard mercury sphygmomanometer after resting for at least 5 minutes.
After an overnight fast, venous blood was sampled and se rum was separated on-site and stored at -70℃ until analysis. Concentrations of total cholesterol, high-density lipoprotein cholesterol, and triglycerides were analyzed using enzymatic methods. All sera were measured using an automatic analyzer (HITACHI-7600, Hitachi Ltd., Tokyo, Japan). LDL cholesterol was calculated using the equation proposed by Friedewald et al.,16) except when triglycerides exceeded 400 mg/dL, in which case the data were treated as missing. HbA1c levels were analyzed via high-performance liquid chromatography using a VARIANT II system (BIO-RAD, Hercules, CA, USA).
2. Carotid Plaque, CCA-IMT, and ABI
Well-trained medical doctors performed ultrasonographic scanning of the carotid arteries using high-resolution mode B ultrasound (SONOACE 9900, Medison, Korea) with an electrical linear array transducer (7.5 MHz). The IMT was defined as the distance from the leading edge of the first echogenic line to the second echogenic line, which indicated the media-adventitia interface. Images of the thickest point at the carotid bulb and the thickest point within 10 mm from the carotid bulb to the CCA were saved as CCA-IMT and then measured using Sigma Scan Pro ver. 5.0.0 (SPSS Inc., Chicago, IL, USA). The examiners evaluated the CCA, carotid bulb, and internal carotid artery to determine the amount of carotid plaque. Protrusions into the lumen that were 100% thicker than the nearest area were defined as plaque. If the plaque was the thickest point, the distance to the nearest point without plaque was defined as the CCA-IMT.
After at least 5-minute rest, the ABI was automatically calculated in the supine position using aVP-1000 system (Colin Co, Komaki, Japan), with cuffs around both the arms and ankles. If any of the ABIs were less than 0.9, the patient was defined as having PAD.
3. FRS, UKPDS, and SCORE Risk Equations
The FRS was calculated using the equation for estimating 10-year CHD risk.10) The UKPDS risk engine (ver. 2.0) for 10-year fatal CHD risk was downloaded from the website,17) and used to analyze the data. The 10-year fatal CHD SCORE risk score for the high risk group was used to analyze our data, as previously described.15) The components of these risk equations are listed in Table 1.
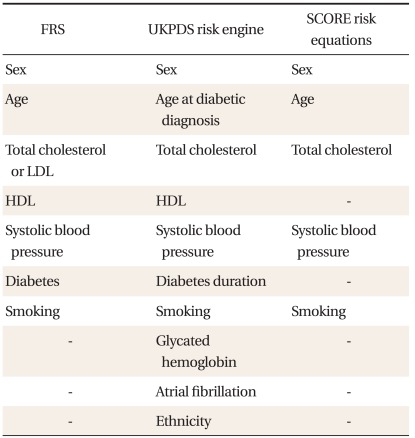
Components of the FRS, UKPDS risk engine, and SCORE risk equations.
4. Statistical Analysis
All statistics, except the receiver operating characteristic (ROC) curve, were performed using SPSS ver. 15.0 (SPSS Inc., Chicago, IL, USA). Carotid plaque was dichotomized according to whether or not there was carotid plaque. We defined abnormal CCA-IMT as the 75th percentile of CCA-IMT, and CCA-IMT was dichotomized according to the 75th percentile of CCA-IMT (≤ 0.83 mm or > 0.83 mm). ABI was dichotomized according to ABI > 0.9 or ABI > 0.9.18) Logistic regression was used to compare odds ratios (ORs) for FRS, UKPDS, and SCORE risk scores in relation to carotid plaque, CCA-IMT, and ABI data. The areas under the curve (AUC) of the ROC curves were compared using Stata ver. 10 (StataCorp, College Station, TX, USA), and the distribution of the FRS, UKPDS, and SCORE risk scores was graphed using kernel density estimation in Stata ver. 10.
RESULTS
1. General Characteristics
The general and biochemical characteristics of the 621 subjects (194 men and 427 women) are detailed in Table 2. The mean (± standard deviation [SD]) age at diabetic diagnosis was 59.2 ± 12.6 years old, and the mean diabetic duration was 8.9 ± 8.0 years. The mean systolic blood pressure (BP) was 130.3 ± 17.8 mmHg, and the mean diastolic BP was 71.8 ± 9.8 mmHg. The mean total cholesterol was 195.0 ± 43.0 mg/dL, and the mean HDL cholesterol was 47.9 ± 11.9 mg/dL. The mean HbA1c level was 7.5 ± 1.6%, and the mean CCA-IMT was 0.73 ± 0.15 mm. The number of subjects whose CCA-IMT was thicker than 75 percentile (0.83 mm) was 149 (24.7%). The number of current smokers was 95 (15.3%). The number of subjects with one more carotid plaques in their carotid arteries was 287 (47.0%), and 69 subjects (11.2%) had ABIs < 0.9.
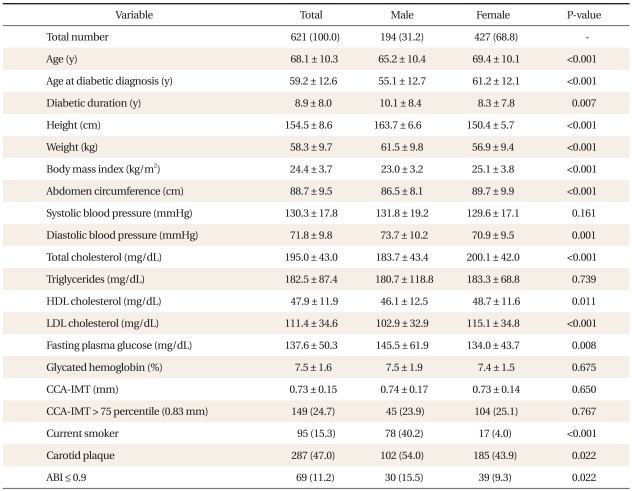
General characteristics of subjects.
Diabetic duration, height, weight, diastolic BP and fasting plasma glucose are higher in males than in females. Age, age at diabetic diagnosis, BMI, abdomen circumference, total cholesterol, HDL cholesterol and LDL cholesterol are higher in females. Male subjects were more likely to smoke, be more present of carotid artery plaque, and have an ABI of less than 0.9.
2. Comparison of ORs
The ORs of risk scores according to quartiles are listed in Table 3. The first quartile of the scores was set as the reference (OR = 1.0). The ORs of all risk scores increased as the quartiles increased for carotid plaque, CCA-IMT, and ABI. For carotid plaque, the UKPDS risk score provided the highest OR (95% confidence interval [CI]) at 3.82 (2.36, 6.17). For CCA-IMT, the UKPDS risk score provided the highest OR (95% CI) at 6.21 (3.37, 11.45). For ABI, the SCORE risk estimation provided the highest OR (95% CI) at 7.41 (3.20, 17.18).
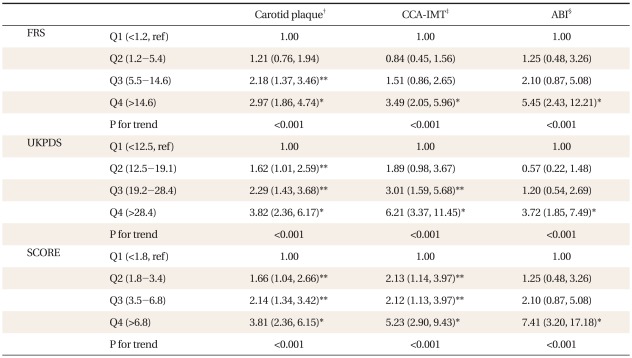
Comparison of odds ratio among FRS, UKPDS, SCORE.
3. Comparison of AUCs
Comparisons of the AUC for the FRS, UKPDS, and SCORE risk scores according to carotid plaque, CCA-IMT, and ABI are shown in Table 4. No significant difference was observed among scores for carotid plaque, CCA-IMT, or ABI (P = 0.839, 0.313, and 0.113, respectively).
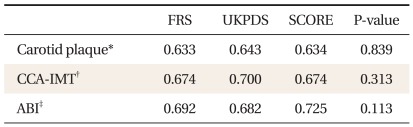
Comparison of AUCs among FRS, UKPDS, SCORE.
4. Kernel Density Distribution
The Kernel density distributions of the FRS, UKPDS, and SCORE risk scores are showed in Figure 1. The Kernel density of the FRS, UKPDS, and SCORE is highest at 2.0, 15.0, and 1.7, respectively. UKPDS showed a higher risk score distribution than FRS or SCORE.
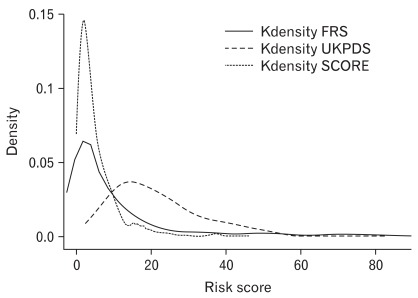
Kernel density distribution of the Framingham Risk Score (FRS), United Kingdom Prospective Diabetes Study (UKPDS) risk engine, and the Systematic Coronary Risk Evaluation (SCORE) risk scores.
DISCUSSION
We compared the predictability of the FRS, UKPDS risk engine, and SCORE risk estimation for carotid atherosclerosis and PAD in Korean type 2 diabetic patients. The ORs of all risk scores increased as the quartiles increased for carotid plaque, CCA-IMT, and ABI. When we compared the predictability of these three risk scores according to the carotid plaque, CCA-IMT, and ABI, no significant difference was detected.
Previous studies have investigated the association between risk scores and carotid plaque and IMT.19-25) In a cohort study of 517 young adults, FRS was independently associated with IMT. Consistent with our results, carotid plaque and IMT were independently related with the Framingham cardiovascular score in an international cross-sectional study of 2,328 subjects (OR, 2.97; 95% CI, 1.86 to 4.74 for carotid plaque and OR, 3.49; 95% CI, 2.05 to 5.96 for IMT). Similar to our results, UKPDS was associated with carotid plaque,23) and IMT22) (OR, 3.82; 95% CI, 2.36 to 6.17 for carotid plaque and OR, 6.21; 95% CI, 3.37 to 11.45 for IMT), and SCORE was associated with carotid plaque24) and IMT25) (OR, 3.81; 95% CI, 2.36 to 6.15 for carotid plaque and OR, 5.23; 95% CI, 2.90 to 9.43 for IMT).
Additional studies have compared the predictability among risk scores. Some researchers studied the predictability based on the observation of CVD events. Guzder et al.26) investigated a cohort composed of 428 newly diagnosed type 2 diabetes patients without clinically evident CVD in the United Kingdom for 4.2 years. They compared the predictability of the FRS with that of the UKPDS risk engine and reported that the AUCs of the FRS and UKPDS were 0.657 and 0.670, respectively. Coleman et al.27) compared the predictability of the FRS and SCORE with the UKPDS in 5,102 newly diagnosed type 2 patients and reported that the AUCs of the FRS and SCORE were similar (0.76 and 0.77, respectively). Simmons et al.28) conducted a population-based cohort study of 9,000 people who presented to general practices for health exams in the United Kingdom. They observed the subjects for 10.5 years and compared the predictability of the FRS with that of UKPDS risk engine. The AUCs of the FRS and UKPDS scores for known diabetes patients were 0.60 and 0.61 and there was no significant difference. Similar to our results, the few prospective studies comparing risk scores for diabetes patients have reported no significant difference among risk scores.
Others compared the predictability using CVD surrogate mea sure similar to our study. In a cross-sectional study, Rakhit et al.29) recruited 199 asymptomatic type 2 diabetes patients from the community and a hospital out-patient clinic in Australia and compared the predictability of the FRS with that of the UKPDS risk engine, based on exercise electrocardiography findings. The AUCs of the FRS and UKPDS risk engine were 0.61 and 0.56, respectively, with no significant difference between them. In a study that examined Korean patients with type 2 diabetes,30) the CVD risk was better assessed using the FRS than using the UKPDS. This result is vastly different to our results. But they compared the predictability between the FRS and the UKPDS based on the high sensitivity C-reactive protein (hsCRP). Even though hsCRP is known to predict cardiovascular events like ischemic stroke and myocardial infarction,31) hsCRP failed to be an independent risk factor for early carotid atherosclerosis.32)
When we graphed the Kernel density distribution of the three risk scores, UKPDS showed a higher risk score distribution than FRS or SCORE (Figure 1). Song et al.33) performed a cross-sectional study with 700 diabetes patients classified according to risk based on the Joint British Society risk score; these patients were then reanalyzed according to the FRS and UKPDS score. The authors reported that the UKPDS score identified more patients in the highrisk group than the FRS. Guzder et al.26) compared the distribution of FRS and UKPDS values and reported that the UKPDS risk engine provided higher risk scores than the FRS when the risk scores were over 30%, similar to our results. The UKPDS may have generated higher risk scores than FRS or SCORE because it was developed for risk estimation in a diabetic population, including important variables such as diabetic duration and HbA1c level, whereas the FRS and SCORE were developed for risk estimation in the general population.
This study possesses the limitations inherent in a cross-sectional study. We could not observe the CVD events, but instead attempted to predict future CVD events based on indicators such as CCA-IMT, carotid plaque, and ABI, which are known surrogates for atherosclerosis. Despite its limitations, this study represents a valuable contribution in that it examines Korean type 2 diabetes patients, whereas previous CVD risk development and comparison studies were limited to European and American subjects.
In conclusion, this study revealed significant associations between risk scores and carotid plaque, CCA-IMT, and ABI; however, no significant differences were observed when comparing the predictability of the risk scores for carotid atherosclerosis and PAD in Korean type 2 diabetic patients. Because the SCORE risk equation is simpler than other risk equation, doctors can more easily assess the CVD risk of the Korean type 2 diabetic patients using by SCORE risk equation.