


In this section, we explain the concept of the receiver operating characteristic (ROC) curve and the statistical methods for comparing the difference between the areas under the ROC curves (AUCs) which appeared in the article titled, "Usefulness of alcohol-screening instruments in detecting problem drinking among elderly male drinkers," published in May 2012 by Ryou et al.1)
Four Diagnostic Measures
In evaluating the usefulness of a specific diagnostic test, the most commonly used measures are sensitivity, specificity, positive predictive value (PPV), and negative predictive value (NPV), defined as follows. 1) Sensitivity: fraction of the number of persons who have positive diagnostic results among patients, 2) specificity: fraction of the number of persons who have negative diagnostic results among normal controls, 3) PPV: fraction of the number of patients among those who have positive diagnostic results, 4) NPV: fraction of the number of controls among those who have negative diagnostic results. From the above definitions, we can perceive that all four measures represent the accuracy of a diagnostic test.
To help the readers understand the meanings of the four measures more easily, we provide a hypothetical data which shows the diagnostic results of 100 patients and 100 controls, respectively, as follows.

In this case, we obtain the sensitivity = 80% (80/100), specificity = 90% (90/100), PPV = 88.9% (80/90), and NPV = 81.8% (90/110), respectively (caution: values of PPV and NPV obtained by the above methods could be quite absurd when the sample data do not represent the true study population).
Receiver Operating Characteristic Curve and Area under the Curve
The ROC curve analysis is mainly used to develop a certain diagnostic test at an early stage. For example, a scientist found a new biological marker to diagnose a liver cancer, and gathered the following data from 5 patients (3, 4, 5, 6, and 7) and 5 controls (1, 2, 3, 4, and 5), respectively.
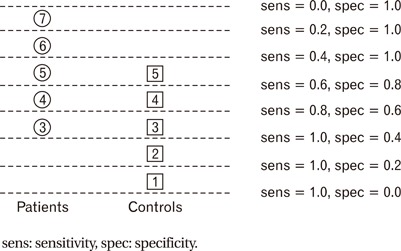
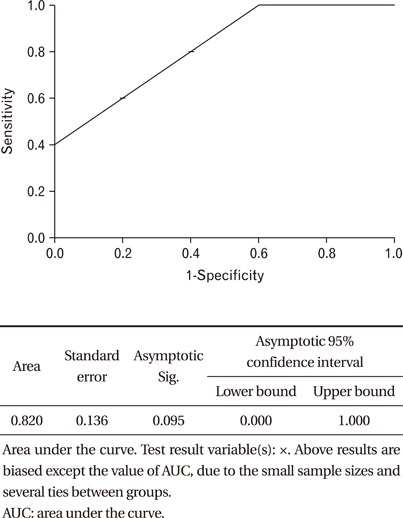
If we increase the cut-off value upward from the bottom (dotted lines), we obtain the sensitivities and specificities at each cut-off value shown on the right side. The ROC curve is created by plotting the sensitivities (vertical axis) vs. 1-specificities (horizontal axis) at various cut-off values. From the above results, we obtain the following ROC curve and AUC (SPSS output).
Testing the Difference between Area under the Curves
There are many commercial software applications such as MEDCALC and STATA for drawing the ROC curve and testing the difference between AUCs. But here, we explain the methods for using the output of SPSS2) which shows the ROC curve and the significance of AUC for only one data set.
1. Case 1 (Paired Area under the Curves)
It occurs when two different diagnostic tests are applied to the same patient and control groups. Let AUC1 (AUC2) and SE1 (SE2) denote AUC and its standard error of the first (second) diagnostic test, respectively. Then we can use the fact that the statistic,
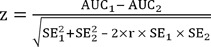
where r denotes the average of correlation coefficients for the patient and control groups, is approximately distributed as the standard normal distribution. The zero hypothesis (no difference between AUCs) is rejected when the absolute value of z is greater than 1.96 (P < 0.05).
2. Case 2 (Independent Area under the Curves)
This occurs when the same diagnostic test is applied to different subjects, for example, males and females. Then the statistic,

is approximately distributed as the standard normal distribution. The same rejection rule as in case 1 could be used for comparing the independent AUCs.


