Bone Mineral Density and Food-frequency in Korean Adults: The 2008 and 2009 Korea National Health and Nutrition Examination Survey
Article information
Abstract
Background
Diet and Nutrition are important modulators of bone health in men and women. We investigated the associations between frequency of food intake among certain food groups and bone mineral density (BMD) in a large population of Korean adults.
Methods
We used the data from Korea National Health and Nutrition Examination Survey during 2008 to 2009. Participants were aged 20 years and over. BMDs were measured at lumbar spine and femoral neck with dual-energy X-ray absorptiometry. Dietary and supplement intakes were assessed by food-frequency questionnaire. We used multiple linear regression analysis to evaluate the relationships between annual food-frequency of each food group and BMD.
Results
After adjustment of multiple covariates, femoral neck and lumbar BMD significantly increased as the frequency of fruit consumption increased in both men and women. Frequency of other carbohydrates consumption was significantly associated with greater femoral neck and lumbar BMD for women. Frequency of milk and dairy product consumption was significantly associated with greater femoral neck BMD in men. Other food groups, however, had no significant associations with BMDs.
Conclusion
Frequent consumption of fruit has a positive association with BMDs in men and women. Milk and dairy products and other carbohydrates also had positive effects on BMD for men and women, respectively.
INTRODUCTION
Osteoporosis is a skeletal disease characterized by low bone mass and microarchitectural deterioration of bone tissue which consequently increases bone fragility and susceptibility to fracture.1) Increased risk of osteoporotic fracture incurs great morbidity and mortality and direct costs for health services.
As populations age, the frequency of osteoporotic fractures is certain to increase in both men and women. Therefore, osteoporosis and related fractures become major important public health problems.1,2) It is estimated that 10 million Americans are currently affected with this disorder and another 18 million have low bone mass, placing them at future risk.3) The lifetime risk of fracture is about 40% for women and 13% for men.1) In the elderly, hip fractures are associated with mortality in up to 20% of cases, and most survivors need costly long-term nursing home care.4)
It is well known that genetic factors are a major cause with an influence on peak bone mass, but many environmental factors also play a role in altering genetic effects.5,6) Previous studies reported risk factors for osteoporosis, including low physical activity,7) smoking,8,9) alcoholism,10) and lack of estrogen in postmenopausal women.11)
Nutritional factors are particularly important to bone health because they are modifiable. Proper nutrition plays a role in the prevention and treatment of osteoporosis. One of the most important nutritional factors in prevention of osteoporosis is calcium and vitamin D.12) In addition to calcium and vitamin D, inadequate intake of phosphorus, magnesium, fluoride, boron, vitamins (K, C, and B6), potassium, and protein have been reported as having a connection to osteoporosis.13) Several studies suggest that dietary habits and nutrition influence bone mineral density (BMD). They involve many nutrients and food components like milk, fruits, vegetables, meat, sea food, and shellfish.14) Also included are nutrients like minerals, vitamins, and macronutrients.15)
It was not until recently that foods and food components, such as dairy products, fruits and vegetables, dietary fibers, mineral water, soy products, carbonated beverages, caffeine, and alcohol have been investigated.16) But results from many studies evaluating the dietary impact on bone health15) are still inconclusive or even contradictory. What is certain, however, is that nutrients and food components interact to influence bone status.
The majority of research on the association between diet and BMD was performed in western countries. However, in Korea, dietary habits are different from western countries. Previous studies performed in Korea had a small sample size and were not focused on the association between food frequencies and BMD, but rather, the amount of dietary nutrient intake and BMD.
In this study, we examined the food-frequency of each food group and the relationship between the food-frequency and the BMD in Korean adults using data from the 2008 and 2009 Korea National Health and Nutrition Examination Survey (KNHANES). This study, with its large population size, intends to evaluate dietary factors that may affect BMD.
METHODS
1. Study Population
The study population was derived from the data of the KNHANES during 2008 to 2009. These surveys gathered data about the health and nutritional status of subjects in various regions of Korea. At baseline, 20,277 subjects made BMD measurements. Of these, 14,560 completed a dietary questionnaire, and 1,755 subjects who were younger than 20 years old were excluded. Therefore, a total of 12,895 (5,246 males and 7,649 females) individuals were included in this study. This study was approved by the ethics committee of Hanyang University Hospital in Seoul.
2. Bone Mineral Density Measurements
BMDs were measured in the femoral neck and lumbar spine by dual-energy X-ray absorptiometry. BMD is an important predictor of fracture. A patient with BMD that is reduced by ≥2.5 standard deviations below peak bone mass is considered to have osteoporosis.17)
3. Dietary Intake
Usual dietary intake was assessed with the use of the food-frequency questionnaire which consists of 11 food groups, including 58 food items, such as staple carbohydrates (rice and grains other than rice), other carbohydrates (ramen, noodles, breads, rice cakes, and confectionery), legumes (bean curd, legumes, and soybean milk), potatoes (potato and sweat potato), meat and eggs (beef, chicken, pork, ham/bacon/sausage, and egg), fish (mackerel, tuna, croaker, and pollack), vegetables (Chinese cabbage, radish, radish leaves, bean sprouts, spinach, cucumber, red pepper, carrot, pumpkin, cabbage, tomato, and mushrooms), seaweeds (sea mustard and laver), fruits (tangerine, persimmon/dried persimmon, pear, watermelon, oriental melon, strawberry, grape, peach, apple, banana, and orange), milk and dairy products (milk, yogurt, and ice cream), and instant foods (hamburger, pizza, and fried foods).
Reported intake frequency of food items was calculated to obtain the food intake per year for each person. The annual food-frequency of all food items included in the groups was summed to obtain the food-frequency of each food group in this study.
4. Measurement of Confounders
In addition to diet, factors reported to affect BMD include body mass index (BMI, in weight [kg]/height2 [m2]), physical activity,18) smoking,9) estrogen use by women,19) and use of calcium or vitamin D supplements or both.20) A comprehensive questionnaire was used to collect each participant's demographic characteristics (e.g., age, sex), anthropometric measurements (height and weight), physical activity, current smoking status, alcohol drinking, disease, history of hypertension, rheumatoid arthritis, thyroid diseases, cerebrovascular accident, coronary artery diseases and diabetes, and use of calcium or vitamin D supplement.
International Physical Activity Questionnaire score21) was used to classify each subject's physical activity. For alcohol drinking, subjects were asked to quantify their weekly intake of alcohol drinks. From this information, based on 10 gm alcohol per drink, total grams of alcohol consumed per year was estimated. Intake of calcium or vitamin D supplements were coded as yes-no variables.
For women, an additional reproductive questionnaire was asked on menstrual and reproductive history, including age at menarche, age at menopause and postmenopausal period, estrogen use for hormone replacement therapy (HRT), as well as current and past oral contraceptive use.
5. Statistical Analysis
All analyses were performed by reflecting weighted values at the stratification of the samples applied to the KNHANEs. The characteristics of the study subjects were compared using the Student t-test and the Pearson χ2 test. Multiple linear regression analyses adjusted for age, BMI, physical activity, smoking and alcohol drinking, other diseases, vitamin or mineral supplements, and estrogen use were used to evaluate the relationship between the food frequency and the BMD. A P-value of less than 0.05 was considered significant. All statistical analyses were performed with SPSS ver. 18.0 (SPSS Inc., Chicago, IL, USA).
RESULTS
General characteristics of subjects are presented in Table 1. The average age for men was 43.8 years and for women was 45.8 years. The average BMI for both men was 24.1 kg/m2 and women was 23.1 kg/m2. Proportionally more men than women were current smokers, and consumed much more alcohol. More women than men used supplements of vitamin or minerals. With statistical significance, the histories of hypertension, cerebrovascular accidents, and coronary artery diseases were higher in men whereas rheumatoid arthritis and thyroid diseases were higher in women. In women, mean age of menarche was 14.5 years, and average postmenopausal period was 14.0 years. Postmenopausal women have received HRT with estrogen for 1.8 months on average. Total period of using oral contraceptives in adult women was 2.3 months on average. Mean BMDs ranged from 0.83 g/cm2 for femoral neck to 0.97 g/cm2 for lumbar spine in men and from 0.71 g/cm2 for femoral neck to 0.92 g/cm2 for lumbar spine in women.
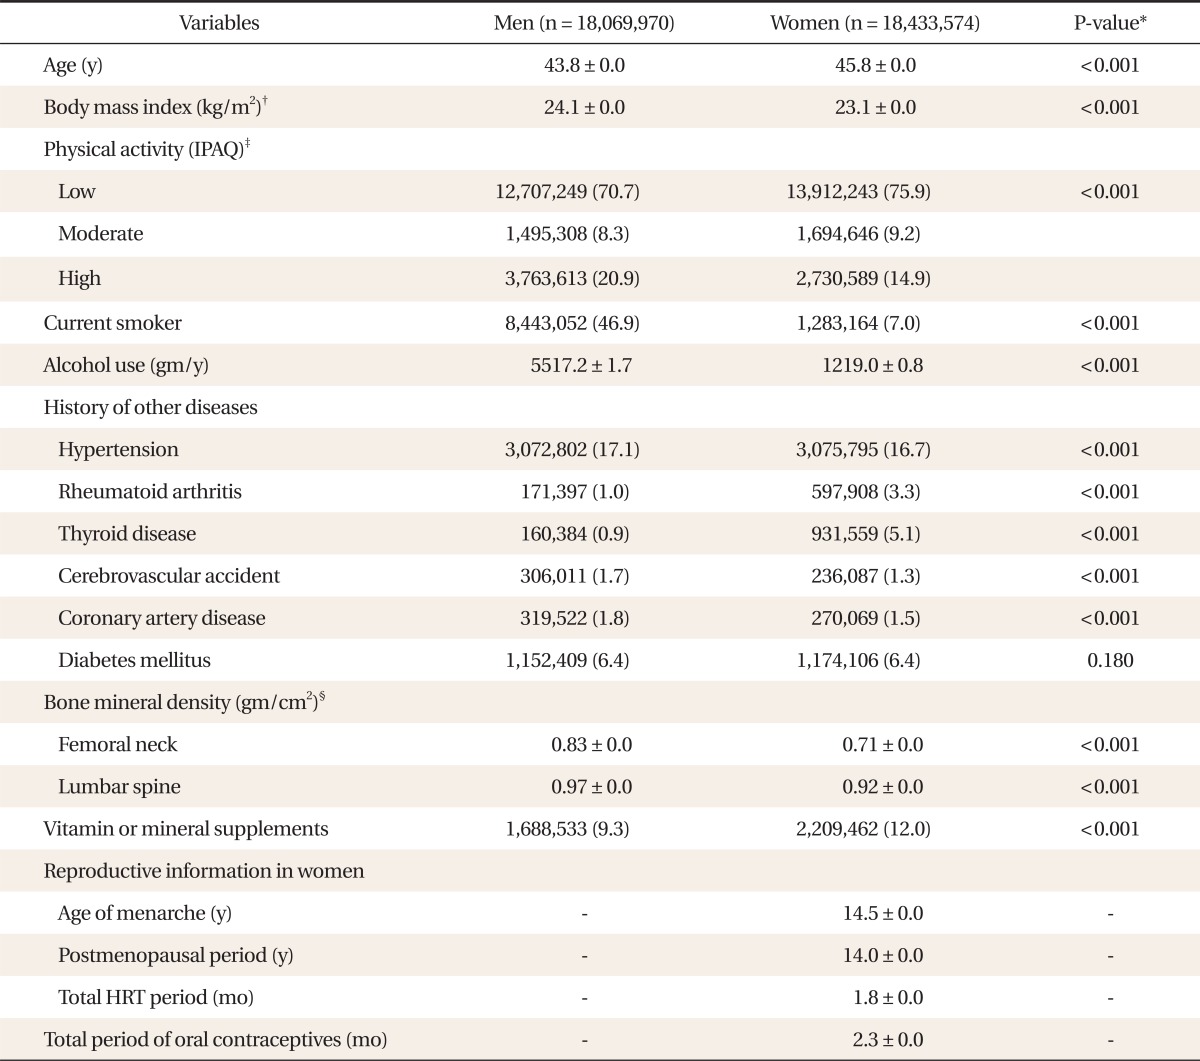
General characteristics of the study population.
The food-frequencies of each food group are shown in Table 2. There is a statistically significant male predominance in the food-frequencies of other carbohydrates, meat and eggs, fishes, vegetables, and instant food, and female predominance in the food-frequencies of staple carbohydrates, legumes, potatoes, seaweeds, fruits, milk, and dairy products.
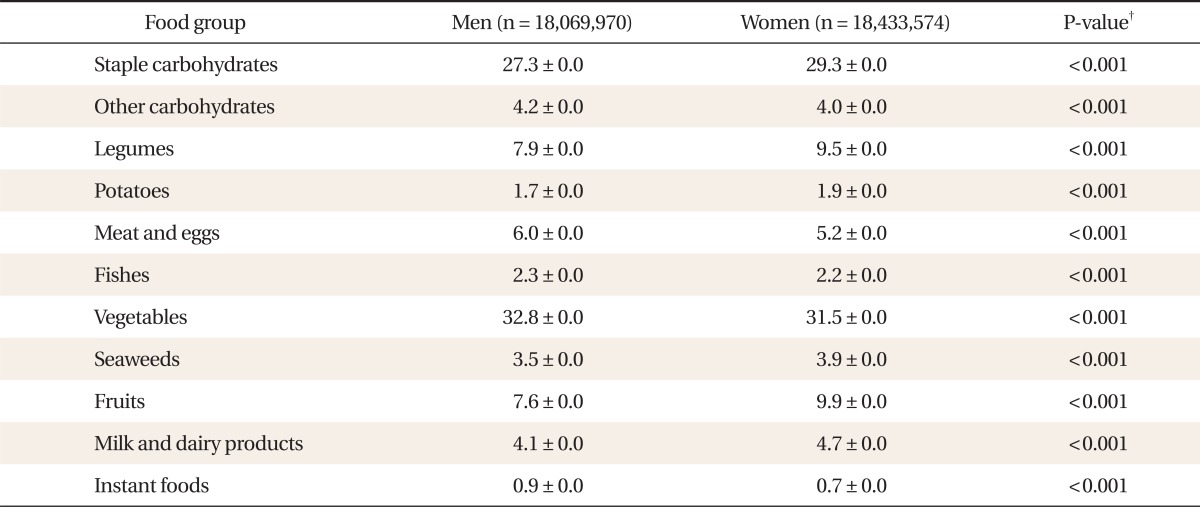
Weekly intake frequency* of each food groups.
Tables 3 and 4 show the association between BMD and food-frequency of each food group after adjustment for the other covariates. Femoral neck and lumbar BMD significantly increased as the frequency of fruit consumption increased in both men and women. Frequency of other carbohydrates consumption was significantly associated with greater femoral neck and lumbar BMD for women. Frequency of milk and dairy product consumption was significantly associated with greater femoral neck BMD in men. Other food groups, however, had no significant associations with BMDs.
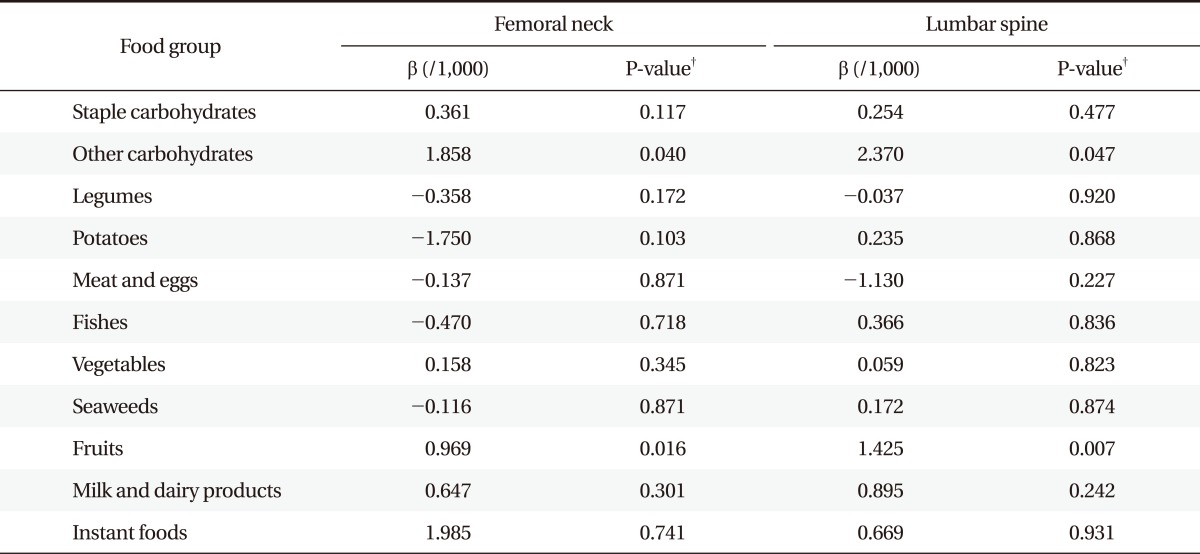
Association between bone mineral density and food-frequency* in women (n = 18,433,574).

Association between bone mineral density and food-frequency* in men (n = 18,069,970).
DISCUSSION
In this study, frequency of fruit intake was associated with BMD of femoral neck and lumbar area in both men and women. Frequency of other carbohydrates consumption was significantly associated with greater femoral neck and lumbar BMD in women. And frequency of milk and dairy product consumption was significantly associated with greater femoral neck BMD in men.
These findings were consistent with previous studies.2,22) Tucker et al.2) concluded that potassium, magnesium, and vitamin C-rich fruits were associated with greater BMD. It is thought that fruit rich in potassium citrate metabolically generate base, which therefore buffers the acid produced by dietary protein of animal origin, conserving bone mineral.14) Magnesium also plays an important role in calcium metabolism. It is known that higher intake of magnesium was associated with lower bone resorption. Fruit is a principal source of potassium and magnesium and this finding emphasizes its potential role in prevention of osteoporosis.
Several studies have identified the relationships between fruit intake and BMD.2,22) However, they had some limitations, for example, that the study population was limited to the elderly, or the sample size was small, or BMD was measured at limited sites. On the other hand, our study deals with a large sample size and a wide age-range of subjects. Also, BMD was measured at the femoral neck and lumbar spine, as this measurement site is recommended as the reference standard.23)
We found that other carbohydrates showed significant association with BMD at the lumbar spine and femoral neck in women. However, there are few studies that examine associations between carbohydrate and BMD, and none showed a significant relationship.24) Since the evidence remains limited, further investigation of this relationship is needed.
Milk and dairy products were shown to significantly and positively impact BMD at both the femoral neck in men in this study. That is compatible with the well established fact that milk and dairy products are great sources of nutrients needed in bone growth and maintenance since they are the principal source of calcium.25) However, in women, we could not identify an association between milk and dairy products and BMD. This may be due to the fact that absolute dietary intake amount of milk and dairy products were relatively smaller in women than in men. Further investigation into not only food frequency but also dietary intake amount in this relationship is needed.
This study did not show a relation between vegetable intake and BMD, although several studies have shown a positive relation between vegetable consumption and BMD.2) A possible explanation may be that the tendency that unlike fruit, most vegetables in this study were consumed after being cooked.26) During cooking with heat or by other procedures, lots of nutrients and vitamins that can positively impact BMD may be lost or much reduced.
In previous studies, the reported effects of protein on BMD are conflicting. Sellmeyer et al.27) reported higher animal vegetable protein ratios influence greater bone loss at the femoral neck and more hip fracture. Protein has been associated with calcium loss. In contrast, Hannan et al.28) reported the protective effects of total protein and animal protein intake against bone loss in the Framingham Osteoporosis Study population. In our study, on the other hand, neither legumes, potatoes, meat or eggs, or fish groups-those groups mainly consisting of protein-showed a statistically significant association with BMD.
However, in women, we could not identify the association between milk and dairy products and BMDs. This may be due to the fact that absolute dietary intake amount of milk and dairy products is relatively smaller in women than in men. Further investigation into not only food frequency but also dietary intake amount in this relationship is needed.
Association between increasing seafood consumption and greater BMD was observed in some studies.26,29,30) These results can be attributed to the high content of essential fatty acid (EFA) present in fish. EFAs are known to enhance vitamin D effects and this may result in increased BMDs.31) But, in our study, we could not find association between fish consumption and BMDs.
The effects of dietary protein intake on BMDs are controversial. Higher-protein diets increase urinary calcium excretion and acidifying amino acids can stimulate bone resorption, then reducing BMD.32,33) However, as protein is a major constituent of bone, low protein intake is associated with frailty and fracture in the elderly.34) Recently, in a longitudinal study, higher protein intake did not have a negative effect on BMD in premenopausal women.35) However, in our study, we could not find association between protein consumption and BMDs.
With regard to confounders, similar results with previous literatures were observed. BMI and physical activity were both positively associated with BMD. Current smoking showed a negative relationship with BMD. Alcohol drinking and BMD showed a positive association in women, which is consistent with previous reports36,37) that hypothesized this positive association to be caused by the effects of alcohol on adrenal androgens or estrogen concentrations. However, alcoholism is known to have negative effect on bone.10) In women, both age of menarche and postmenopausal period had negative association with BMD, and total period of HRT (estrogen regimen) had a positive association with BMD. These findings accord with known positive effects of estrogen on bone.
The present study differs from previous reports that investigated the association between food intake and bone health in that it is the first report that examined BMD in a large sample of adults in Korea. It also deals with food intake frequency of a variety of food groups and food items that properly reflects people's diet. Because dietary habits vary widely, studies implemented on specific populations can be very useful. In addition, this study collected extensive information on other factors known to affect bone health, such as BMI, physical activity, smoking, alcohol drinking, diseases like hypertension, rheumatoid arthritis, thyroid disease, cerebrovascular accident, coronary artery diseases, diabetes, supplements of vitamin or minerals, menarche, menopause, and estrogen use, thus enabling the association between BMD and food consumption to be adjusted for the potential confounding effects of these variables.
However, the main limitation of this study is that the design was cross-sectional so that only associations rather than causal relations between food and BMD can be inferred. The other limitation is that food frequency may not represent the accurate amount of food consumed. Therefore, further investigations with quantitative analysis of food and nutrient consumption and long-term follow-up are warranted.
Notes
No potential conflict of interest relevant to this article was reported.