Relationship between Family Adaptability, Cohesion and Adolescent Problem Behaviors: Curvilinearity of Circumplex Model
Article information
Abstract
Background
The Family Adaptability and Cohesion Evaluation Scale (FACES) III using the circumplex model has been widely used in investigating family function. However, the criticism of the curvilinear hypothesis of the circumplex model has always been from an empirical point of view. This study examined the relationship between adolescent adaptability, cohesion, and adolescent problem behaviors, and especially testing the consistency of the curvilinear hypotheses with FACES III.
Methods
We used the data from 398 adolescent participants who were in middle school. A self-reported questionnaire was used to evaluate the FACES III and Youth Self Report.
Results
According to the level of family adaptability, significant differences were evident in internalizing problems (P = 0.014). But, in externalizing problems, the results were not significant (P = 0.305). Also, according to the level of family cohesion, significant differences were in internalizing problems (P = 0.002) and externalizing problems (P = 0.004).
Conclusion
The relationship between the dimensions of adaptability, cohesion and adolescent problem behaviors was not curvilinear. In other words, adolescents with high adaptability and high cohesion showed low problem behaviors.
INTRODUCTION
Most individuals are at a higher risk of engaging in problem behaviors, including antisocial behavior and substance abuse, during adolescence.1) In many previous studies, researchers have reported that adolescent problem behaviors are associated with family function.2,3) Thus, family physicians providing continuous and comprehensive adolescent health care should fully understand the adolescent's family and should conduct preferential assessment of family function.4-6)
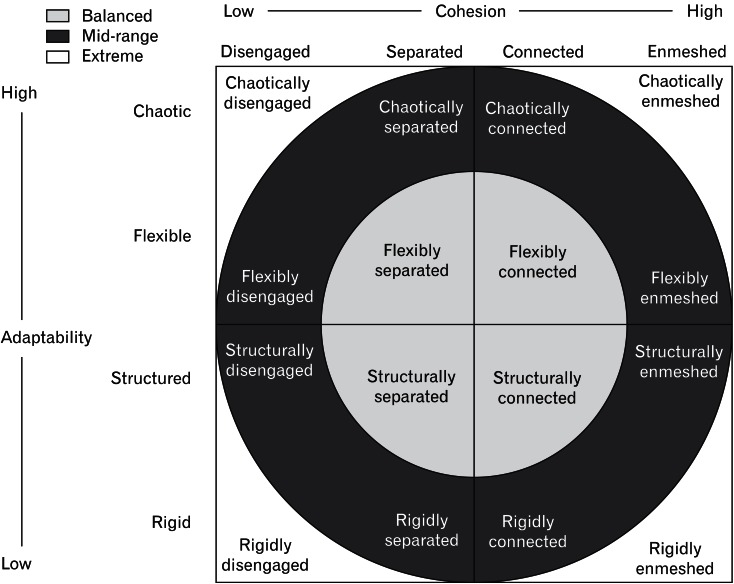
Family genogram, family circle, family APGAR (adaptation, partnership, growth, affection, and resolve) and Family Adaptability and Cohesion Evaluation Scale (FACES) are the most common tools to assess family function.6-8) Among them, FACES III, using the circumplex model, has been widely used in various fields.5) FACES III was developed by Olson in 1983 to investigate family dynamics.9,10) The reliability and validity of the Korean translation of FACES III has also been demonstrated.11) FACES III was developed to assess two major dimensions on the circumplex model: adaptability and cohesion of the family. This measure assesses the degree to which family members are adaptive and attached to their family. The circumplex model is a classification system of 16 family types and three or more general types: balanced, mid-range, and extreme (Figure 1). There are four levels of family adaptability: rigid, structured, flexible, and chaotic (very high). The two central levels (structured and flexible) are considered the balanced levels of family adaptability and the two extreme levels (rigid and chaotic) are considered the unbalanced levels of family adaptability. Also, there are four levels of family cohesion: disengaged, separated, connected, and enmeshed. Similar to that for family adaptability, the two central levels (separated and connected) are considered to be the balanced levels of family cohesion and the two extreme levels (disengaged and enmeshed) are considered to be the unbalanced levels of family cohesion.9) These measures indicate the curvilinear interpretation. In other words, according to the curvilinear hypothesis, balanced levels of cohesion and adaptability (low to high levels) tend to reflect more healthy family functioning, while unbalanced levels of cohesion and adaptability (very low or very high levels) tend to reflect more problematic family functioning.
However, the criticism of the curvilinear hypothesis of the circumplex model has always been from an empirical point of view.12-14) Some previous research supported the curvilinear relationship between family adaptability, cohesion and family function.9,11,15) However, other research indicated that family adaptability, cohesion evaluation scale, and practical family function have a linear relationship, rather than a curvilinear relationship.16-18) Within the linear interpretation, a family having the higher cohesion and adaptability levels displays greater functionality. The lower levels (disengaged and rigid) indicate worse forms of family functioning.
Especially, in a study of children and adolescents, behavioral problems were associated with extreme levels of family cohesion and adaptability.19) In addition, another study of child behavior problems found a strong relationship with low family cohesion.20) For these reasons, previous research have suggested that the problem behaviors may be closely related to family function. Therefore, this study focused on adolescent problem behaviors because family function can be explained through adolescent problem behaviors.
The primary objective of this study was to examine whether a curvilinear relationship between adolescent problem behaviors and family function is always supported, using the Korean version of the FACES III in urban general families. The findings of the present study may provide useful information to the primary care physician who helps in developing prevention and intervention programs for adolescent problem behaviors.
METHODS
1. Participants
Participants included 398 adolescents who were in two middle schools in an urban area in South Korea. These schools were located in a town whose residents belong primarily to the middle or upper income class. This area in which we chose to conduct our study was similar to the conditions of Olson's study.9) The circumplex model was designed in middle class European Americans living in urban areas of the United States. Our data were collected in May, 2011 using a self-reported questionnaire. The authors visited each classroom and explained the purpose of the study, which was to explore the relationship between adolescent problem behaviors and family function. All participants were informed that their responses to the questionnaire would be kept rigorously confidential and that all the completed questionnaires would be used only for research purposes.
2. Instruments
1) The Korean version of the Youth Self-Report
The Youth Self-Report (YSR) is the most widely used mental health assessment instrument for adolescents.21) In our study, adolescent problem behaviors were measured with the Korean (K)-YSR. The K-YSR is a measure based on the Child Behavior Checklist, which was developed for Korean children, and it also has good reliability and validity. For this instrument, the items are scored on a 3-point scale with a higher score indicating more adolescent problem behaviors.22) Adolescent problem behaviors included internalizing problems (e.g., social withdrawal, anxiety, depression, and psychosomatic reactions) and externalizing problems (e.g., delinquency and aggressive behavior).21) Categorizing the relatively concurrent behavior patterns as internalizing problem behaviors and externalizing problem behaviors is helpful to determine the cause of behavioral problems and for predicting the development of behavioral problems.22) The present study examined adolescent problem behaviors by dividing them into internalizing and externalizing problems using Achenbach's (1991) classification system. The K-YSR originally consists of a total of 117 items. For this study, we selected 65 items to concentrate on internalizing problems (32 items) and externalizing problems (33 items). The K-YSR had adequate internal reliability for internalizing problems (Cronbach α = 0.88) and externalizing problems (α = 0.83).
2) Family Adaptability and Cohesion Evaluation Scale III
FACES III was developed by Olson in 1983 to investigate family dynamics.9) The reliability and validity of FACES III has also been demonstrated.11) FACES III consists of 10 cohesion items and 10 adaptability items. The instrument asks the respondents to indicate how frequently the described behavior occurred in his or her family on a Likert scale from 1 (almost never) to 5 (almost always). The total scores of cohesion and adaptability respectively ranged from 10 points to 50 points. Internal consistency was also tested in this sample of youths and it was deemed acceptable (Cronbach α = 0.76 for family adaptability; α = 0.81 for family cohesion).
3. Statistical Analyses
Descriptive analyses were applied to subjects' general characteristics, including gender, parents' education level, parents' occupation type, and religion. In order to test the relationship between each of the adolescent problem behaviors (internalizing and externalizing behaviors) and family function (adaptability and cohesion), the Mann-Whitney U-test or Kruscal-Wallis test, and general linear models (GLM) were used. To determine which factors cause a significant influence on problem behaviors, univariate analyses were performed. Subsequently, statistically significant variables on univariate analyses were added to GLM. For the GLM analysis, we applied transformations from the Box-Cox method to the response variables to achieve normality and homogeneity of variance. Statistical significance was accepted if the P-value was < 0.05, and IBM SPSS ver. 20.0 (IBM Co., Armonk, NY, USA) was used for all statistical analyses.
RESULTS
Table 1 presents characteristics of subjects by gender, parents' educational level, type of occupation, and religious status. Two hundred twenty one (55.5%) youth were adolescent females. Two hundred seventy-five (69.1%) professed a religious affiliation. The mean family adaptability score was 31.6 (SD = 6.2), and the mean family cohesion score was 33.0 (SD = 6.2). According to the classification method of Olson,9) we categorized family adaptability and cohesion respectively into four levels based on their scores (Figure 2). Then, we investigated the differences in adolescent problem behaviors, based on the level of family adaptability and cohesion (Table 2). According to the level of family adaptability, results of the Kruscal-Wallis test performed on adolescent's self reports showed significant differences in internalizing problems (P = 0.014). After the post-hoc test was performed, the results showed significant differences between the rigid group and chaotic group in internalizing problems. With regard to externalizing problems, there were no significant differences. Similarly, according to the level of family cohesion, results showed significant differences in internalizing problems (P < 0.001) and externalizing problems (P = 0.017). After the post-hoc test was performed, the results showed significant differences between the disengaged, separated, and enmeshed groups in internalizing problems and between the disengaged and connected groups in externalizing problems. Additionally, the groups having higher family adaptability score tended to have a lower mean score concerning internalizing problems. The groups having a higher family cohesion score also tended to have a lower mean score about internalizing and externalizing problem behaviors.
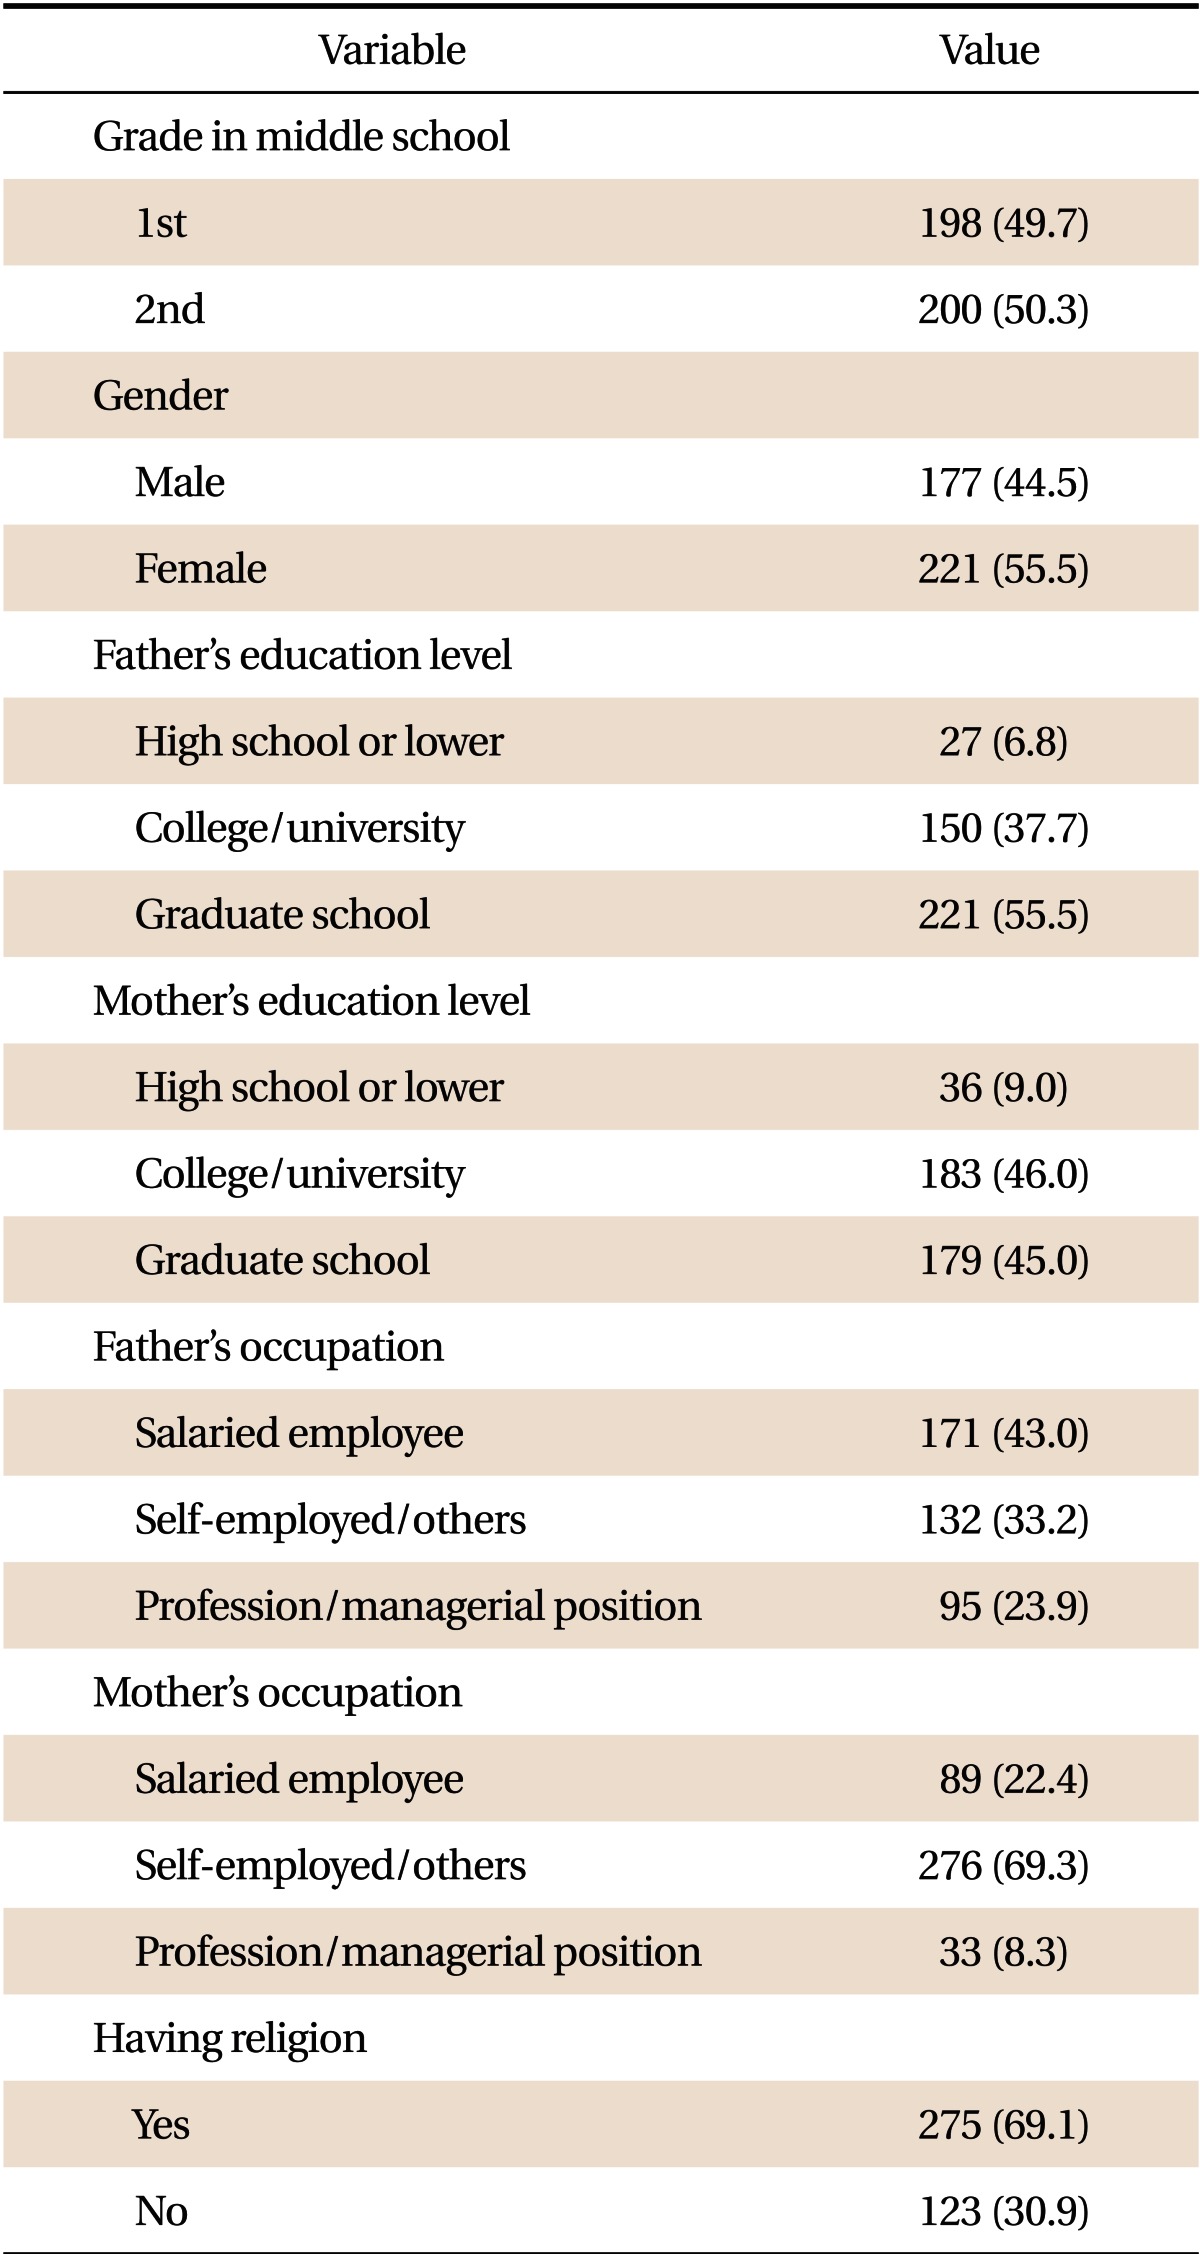
Characteristics of the 398 subjects
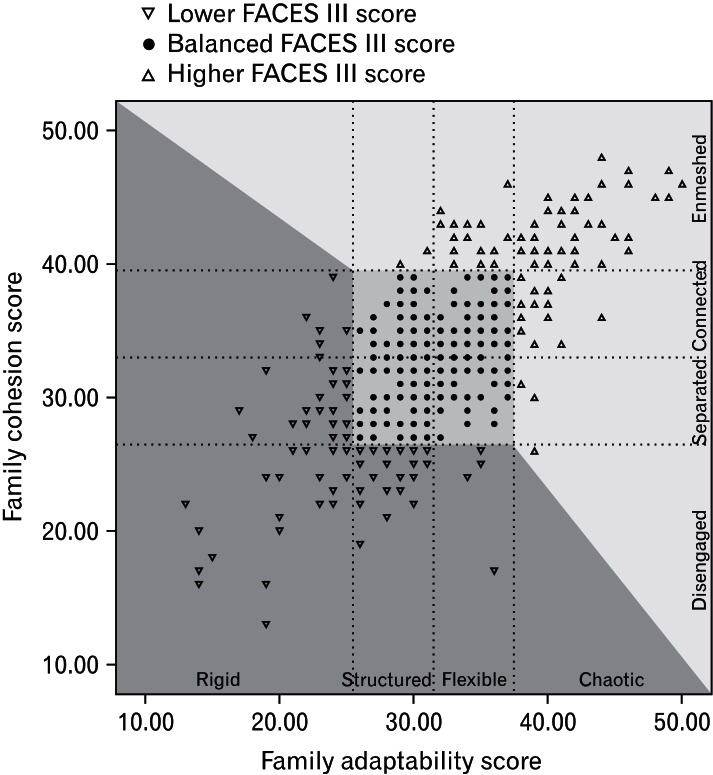
Four adaptability categorized groups (rigid, structured, flexible, chaotic), based on adaptability scores. Rigid (10.00-25.39), structured (25.40-31.59), flexible (31.60-37.79), chaotic (37.80-50.00). Four cohesion categorized groups (disengaged, separated, connected, enmeshed), based on adaptability scores. Disengaged (10.00-26.81), separated (26.82-33.00), connected (33.01-39.19), enmeshed (39.20-50.00). FACES: Family Adaptability and Cohesion Evaluation Scale.
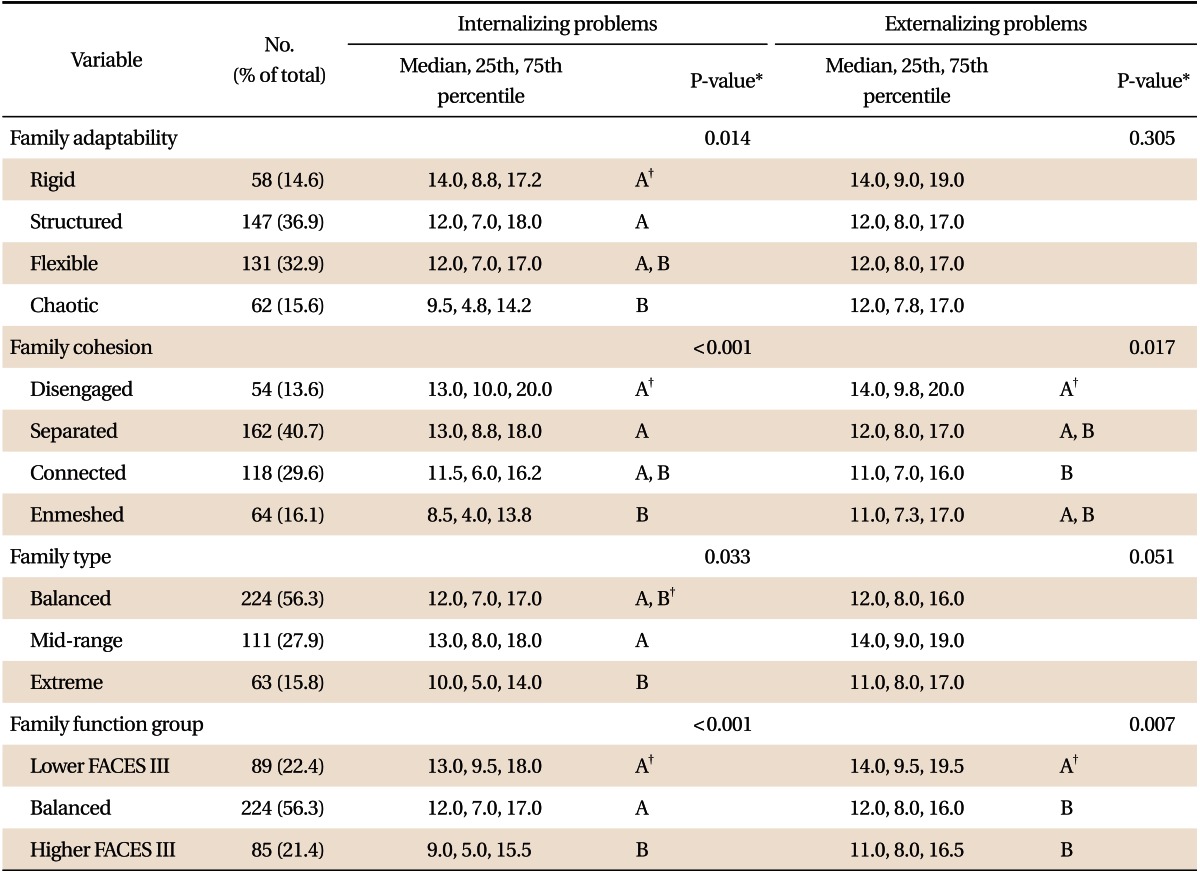
Comparison of internalizing behavior problems and externalizing behavior problems according to family adaptability and cohesion
The general family types were balanced, mid-range, and extreme. They were determined by adaptability and cohesion scores, based on Olson's method (Figure 1). The number of families in the balanced type was the largest with 224 (56.3%), followed by the mid-range type with 111 (27.9%) and the extreme type with 63 (15.8%). Although statistically insignificant for the externalizing problem behaviors, the average scores of both the internalization of problems and the externalization of problems were the highest in the mid-range family type, but in not the extreme family type.
We recategorized family function level by adaptability and cohesion score, involving lower FACES III score, and balanced and higher FACES III (Figure 2). The number of families in the balanced type was the largest with 224 (56.7%), followed by lower FACES III group with 89 (22.4%), and higher FACES III group with 85 (21.4%). The mean scores of both adolescent internalizing problems and externalizing problems were the highest in the lower FACES III group, the next was balanced, and the higher FACES III group was the lowest.
To determine which other factors caused a significant influence on problem behaviors, univariate analysis was performed (Table 3). Statistically significant variables included gender, parents' education level, and parents' occupation type. Subsequently, GLM analysis was used to adjust statistically significant variables in univariate analyses (Table 4). Both normalized internalizing problems (P = 0.004) and normalized externalizing problems (P = 0.004), between lower FACES III score group and higher FACE III score group displayed significant differences.
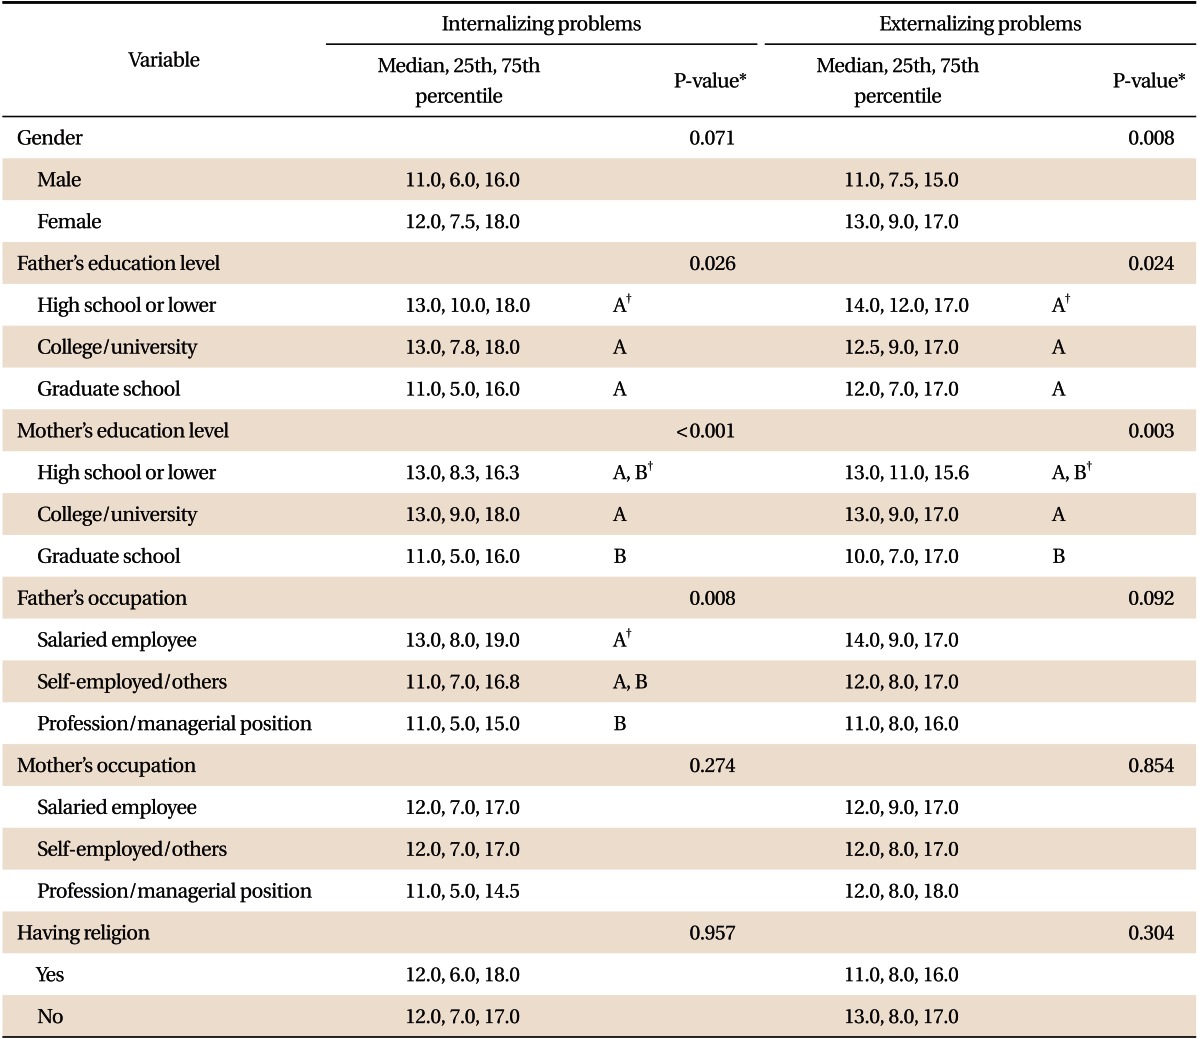
Comparison of internalizing behavior problems and externalizing behavior problems according to major socio-demographic characteristics
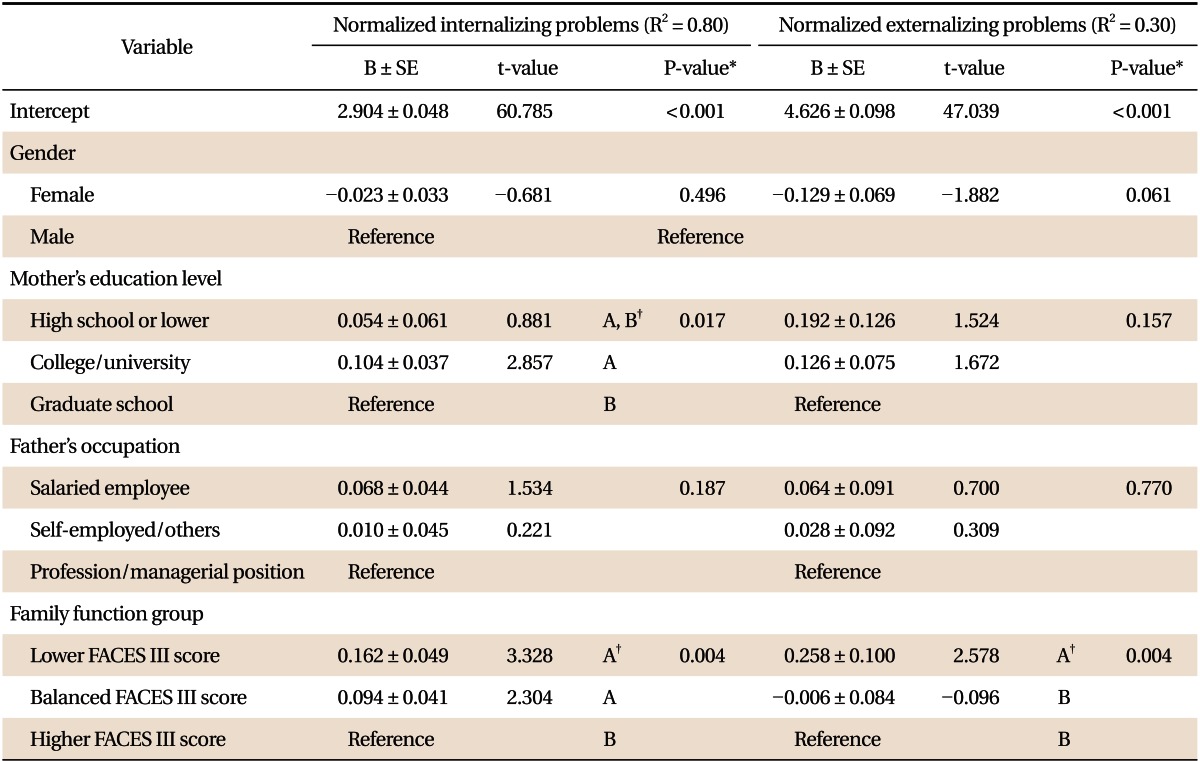
Association of family adaptability and cohesion with adolescent behavior problems by general linear model (GLM) analysis
DISCUSSION
The present findings provide support for the theory that the relationship between family function and adolescent problem behaviors may not always be curvilinear. Since the development of FACES III, the scales from FACES III have been consistently found to have a linear relationship with healthy or unhealthy family function.23,24) This linear relationship is hypothesized to occur primarily because FACES III does not seem to measure the unbalanced (extremes) areas of cohesion (enmeshed) or adaptability (chaotic).25) Therefore, depending on the study's purpose, researchers should decide whether to apply a curvilinear or a linear relationship between practical family function and measured family function using Olson's FACES III.
In our study, the mean score for family cohesion was 33.0 ± 6.2 and the mean score for family adaptability was 31.6 ± 6.2. The result for family cohesion was similar to that reported in the previous studies among adolescents, but the mean score for family adaptability was much higher than previously reported.9,11,26,27) Family adaptability can be affected by socioeconomic status, education level of parents, residential areas, number of siblings, and other factors.25,26) Thus, it can be postulated that the mean score for family adaptability was higher due to the high education level of parents in our study.
Several studies reported that family function and adolescent problem behaviors have a curvilinear relationship.9,11,15) However, other studies indicated that family function and adolescent problem behaviors have not a curvilinear relationship, but a linear relationship.16-18) If the relationships of family adaptability, family cohesion, and adolescent problem behaviors satisfy the curvilinear hypothesis, then families belonging to the balanced group would have the best family function. However, in our study, the average scores of adolescent problem behaviors of the families belonging to the balanced group were not the best, compared with families in other groups. Also, according to the curvilinear hypothesis, families in the unbalanced type must have poor family function. But, in our study, in higher FACE III score families, the average scores of adolescent problem behaviors both internalizing problem and externalizing problem were better than that of families belonging to the balanced type. The present results were consistent with previous research which showed that family function and adolescent problem behaviors do not have a curvilinear relationship.16-18) In other words, as adolescents achieve progressively higher adaptability or higher cohesion scores in FACES III, they display fewer problematic behaviors. In the unbalanced type, the families with lower and higher FACES III score showed significant differences on the average score of adolescent problem behavior. This means that both the lower group and higher group for FACE III score did not belong in the same extreme family function category. This supposition was supported by general linear model analysis. It was postulated that healthy families and unhealthy families with a high FACES III score could not be discriminated using the FACES III tool. Therefore, Olson's curvilinear hypothesis was not supported.
From these results, it can be presumed that adolescent behavior problems develop because demands for attention at the time of developmental change during adolescence were not met adequately owing to low family adaptability.28) Frustration is an important factor that causes behavior problems.29) Likewise, it can be postulated that low family adaptability and cohesion exacerbate the internal complaints among youth. Thus, the results obtained from our survey indicate that clinicians and researchers should be careful while interpreting family function using FACES III.
There are several limitations to the present study. First, because we were not able to select a random sample, a convenience sample was selected from a city in South Korea. Hence, future studies are required to generalize these findings. Second, we surveyed only one adolescent target, so it is difficult to extend the findings to the entire family. Third, the cross-sectional study design did not allow us to evaluate the temporal order of the observed associations. Fourth, the theoretical and clinical adequacy of these findings needs to be ascertained in future studies.
Despite these limitations, our study has several strengths. We comprehensively and systematically assessed the effects of overall family function on adolescent problem behaviors. As such, the results of this study will provide important information for understanding family function and adolescent problem behaviors in Korean adolescents. We think that these results may be helpful in counseling and treating adolescents in clinical settings.
Notes
No potential conflict of interest relevant to this article was reported.