The Cutoff Value of Waist Circumference for Predicting Metabolic Risks in Pre- and Post-Menopausal Korean Women: Analysis of 2010 Korean National Health and Nutrition Examination Survey Data
Article information
Abstract
Background
With metabolic syndrome (MS) being a major risk factor for cardiovascular disease, and central obesity being a major predisposing factor for MS, intensive research is currently being performed on cutoff values according to race and sex. Menopause is an especially significant factor in designating cutoff values for female central obesity, as menopause brings sudden bodily changes that induce central obesity and increased prevalence of MS. Therefore this study aimed to investigate the cutoff values for the obesity index and its validity in predicting the criteria for MS in Korean women according to menstrual status.
Methods
The study focused on 3,103 women 20 years of age or older participating in the 2007 Korea National Health and Nutrition Examination Survey. Definitions of non-adipose components of MS were defined by the International Diabetes Federation, and menstrual status was judged on the basis of survey results. The sensitivity, specificity, and positive and negative predictive values of the central obesity index (body mass index [BMI], waist circumference [WC], waist-to-height ratio [WHtR]) according to menstrual status for two or more non-adipose components of MS were calculated based on the Youden index.
Results
Area under the curve (AUC) values predicting the presence of two or more metabolic risk factors were higher in pre-menopausal women, with AUC values for BMI, WC, and WHtR being, in pre- and post-menopausal women, 23.1 kg/m2 vs. 23.9 kg/m2, 76.1 cm vs. 82.5 cm, and 0.49 vs. 0.53, respectively. The WC cut off (76 cm) for pre-menopausal women was found to be more sensitive and more effective at screening for MS risks than the cutoff value given by the Korea Society for the Study of Obesity.
Conclusion
The central obesity index showed better predictability for MS risk in pre-menopausal women. Because the central obesity index cutoff values are lower in pre-menopausal women, the possibility of metabolic risk can be considered for pre-menopausal women with WC lower than 85 cm. Assessment and control of other risks are needed accordingly for preventing the development of MS.
INTRODUCTION
Metabolic syndrome (MS) is a broadly defined concept that seeks to describe the interactions and mutual synergism of risk factors such as central obesity, impaired glucose tolerance, hypertension, and hyperlipidemia, which are known to be causes of cardiovascular disease, and are the basis for the design of currently used preventive measures against cardiovascular disease.1) As obesity and especially central obesity have increasingly been implicated in the pathogenesis of symptoms-drops in high density lipoprotein (HDL) levels, increasing triglyceride levels, insulin resistance, and hyperglycemia the characteristic harbingers of MS,2,3) the significance of central obesity as a predisposing factor for MS has been increasingly emphasized.
Central obesity is a keystone in the diagnosis of MS, as defined by the International Diabetes Federation (IDF).1) Diagnostic criteria set forth by each international organization for obesity as part of the definition of MS vary. The World Health Organization (WHO)'s 1998 criteria for central obesity are a waist-hip ratio of 0.9 or higher for males and 85 or higher for females or a body mass index (BMI) > 30 kg/m2,4) while the 2001 National Education Cholesterol Program Adult Treatment panel III (NCEP ATP III) guidelines are a waist circumference (WC) of 102 cm or greater in males and 88 cm or greater for females, with equal weight being given to the predictive value of this criterion as to other risk factors.5) In the revised 2005 NCEP ATP III criteria, the characteristics of those genetically of Asian origin were taken into account and the cutoff values were revised to 90 cm for men and 80 cm for women.6) Likewise, the 2005 IDF standards advise the use of separate criteria for each race and sex.1)
According to the calculations made by the Korea Society for the Study of Obesity (KOSSO), based on the results of the 1998 Korea National Health and Nutrition Examination Survey (KNHANES), cut off standard values for central obesity were determined to be 90 cm in males and 85 cm in females.7) According to the KNHANES, the prevalence of MS in the Korean population has been steadily increasing, with a total prevalence of 31.3% in 2007.8) Scrutiny of the distribution of MS prevalence according to age reveals the notable finding that, while male prevalence of MS increases steadily with age, the prevalence of MS in women shows a sharp increase in the 50s,8) implying that age is not the only factor determining the prevalence of MS in women but that experience of menopause also shows significant correlation. According to the results of the 2010 KNHANES, the prevalence of obesity as defined by BMI and WC (85 cm) was 12.1% and 7.6% for the age range of 19 to 29, 19.0% and 12.2% for 30 to 39, 26.7% and 18.1% for 40 to 49, 33.8% and 30.3% for 50 to 59, 43.3% and 43.3% for 60 to 69, and 34.4% and 44.9% for those over 70. The prevalence of obesity was comparatively higher in women over the age of 50,9) implying that post-menopausal obesity, especially central obesity, has a correlation to the prevalence of MS. And the gap between the prevalence of obesity as defined by BMI and WC in women under the age of 50 shows the possibility that KOSSO's central obesity cutoff value (≥85 cm) cannot reflect obesity-related disorders precisely.
According to preliminary reports, menopausal women undergo not only changes in BMI and triglyceride levels,10) but also redistribution of body fat due to dropping estrogen levels resulting in increases in visceral fat11) as well as waist-hip ratio.12) Taking such differences between pre- and post-menopausal states into account, there have been papers on the predictive value of WC. A 2012 study by Chu et al.13) on Taiwanese women calculated the WC cutoff value predictive of MS, according to age and menopausal status. Even within the same age group (<65 years) a lower cutoff value of 78 cm was calculated for the pre-menopausal group, as opposed to a cutoff value of 82.4 cm for menopausal women of the same age.
The obesity index such as BMI, WC, and waist-to-height ratio (WHtR) have been used to predict MS and associated cardiovascular disease, and taking into account a trend towards decreasing levels of obesity in the female Korean population9) and the character between pre- and post-menopausal states,10-12) further research on optimal cutoff values for obesity index for identifying metabolic risk factors in women of menstrual status is necessary. Therefore, this study aimed to investigate the optimal cutoff values for the central obesity index (BMI, WC, and WHtR) as well as the validity of these measurements in predicting the criteria for MS in Korean women by menstrual status.
METHODS
1. Research Results and Target Population
The KNHANES is a nationwide annual survey conducted on a representative sample population, and is comprised of two main surveys: health inspection and nutritional inspection. This study was based on an analysis of the results of the KNHANES V-1, 2010 survey, the research methodology of which is recorded in the manual for use of source data in the 2010 KNHANES.14) From the original pool of 3,735 potential participants, those 1) non-respondents pertaining to menopausal state, 2) pregnant or breastfeeding, 3) for whom anthropometric measurements or lab test results were not available, 4) denying experiencing menopause at a significantly advanced age (65 years or greater), and 5) who had not fasted for eight hours preceding lab tests were excluded from the final subject population, which consisted of 3,103 women over the age of 20.
2. Anthropometric Measurements and Lab Tests
All Anthropometric measurements taken as part of the KNHANES test were taken by trained and skilled examiners using a consistent methodology as follows. Height and weight were measured to the nearest 0.1 cm using a portable extensimeter (SECA 225; SECA, Hamburg, Germany) and to the nearest 0.1 kg using a calibrated balance scale (GL-6000-20; CAS KOREA, Seoul, Korea), with the patients dressed in a light weight gown or underwear only. WC was measured to the nearest 0.1 cm during exhalation, using a measuring tape (SECA 200, SECA) at the horizontal plane midway between the inferior costal margin and the iliac crest, at the mid-axillary line. BMI was defined as body weight/height2 (kg/m2). Blood pressure was measured with the subject having rested for 5 minutes in a sitting position in a comfortable chair, and not having consumed nicotine for at least 30 minutes prior.
Blood samples were taken from venous blood after a minimum 8-hour fast, and analyzed for fasting glucose, triglycerides, and low density lipoprotein (LDL) using the Hitachi Automatic Analyzer 7600 (Hitachi, Tokyo, Japan). As per the instructions of the KNHANES source material use guidelines,14) compensate blood pressure values were used, and HDL values were derived using conversion equations provided by the institution performing the examinations.
3. Definition
The non-adipose components of the MS were defined using IDF criteria:1) 1) triglycerides ≥ 150 mg/dL, 2) HDL cholesterol < 50 mg/dL (women), 3) systolic blood pressure ≥ 130 mm Hg or diastolic blood pressure ≥ 85 mm Hg or subject taking antihypertensive medications, 4) fasting plasma glucose level ≥ 100 mg/dL or receiving treatment for diabetes with oral hypoglycemic medication or insulin.
In order to compare the diagnostic accuracy of different central obesity cutoff values according to menopausal state, WC criteria were taken from the guidelines of the 2005 KOSSO (WC ≥ 85 cm),7) and obesity index criteria were derived from the Asia-Pacific standards set forth by the WHO (overweight ≥ 23 kg/m2, obesity ≥ 25 kg/m2).6) The menopausal state was described as self-reported amenorrhea caused by natural or artificial menopause (e.g., induced by oophorectomy).
Subjects having smoked more than 100 cigarettes in their lifetime and currently still smoking were defined as current smokers, subjects having smoked more than 100 cigarettes but previously quit as past smokers, and subjects who had smoked less than 100 cigarettes in their lifetime were defined as non-smokers. Drinking status was defined in relation to frequency of alcohol consumption, distinguishing between those imbibing more or less frequently than once per month. Socioeconomic status (SES) was determined by highest level of education completed: middle school or lower, high school, and university or college.
4. Statistical Analysis
All analyses except analysis using the receiver operating characteristic (ROC) curve were performed to incorporate sampling weight (wt_ivex) considering the multistage probability sampling design of KNHANES. Subjects were divided into two groups based on menopause status, with differences between items being calculated by t-test and chi-square methods. Continuous variables were expressed as mean and standard error. Discrete variables were expressed as proportions and standard error. In order to determine the predictive accuracy of central obesity index values (BMI, WC, and WHtR) for each or more than two non-adipose components of MS (high glucose, hypertension, hypertriglyceridemia, and low HDL cholesterol), the ROC curve was used. Each area under the curve (AUC) and 95% confidence interval (CI) values were calculated, with instances of AUC > 0.7 being considered to have significant predictive value, and a chi-square test was performed to determine differences in AUC area between the two.
The optimal cut off was determined using the Youden index (maximum value of sensitivity + specificity-1), deriving values for the sensitivity, specificity, positive and negative predictive value, and J-values (sensitivity + specificity-1) of each.15,16) These values were also calculated for WC > 85 cm, the original standard for central obesity in Korean women, as well as for the WHO Asia-Pacific guidelines defining a BMI of 23 kg/m2 as overweight, and 25 kg/m2 as obese.
We performed multivariate logistic regression analysis order to define the adjusted odds ratio (OR) for the presence of non-adipose components of MS when participants' WC exceeded the cutoff values. The covariates were smoking, alcohol consumption, and SES. Statistical approval of the AUC surface areas of each of the two groups was performed by way of Stata ver. 11.0 (Stata Co., College Station, TX, USA), and PASW SPSS ver. 18.0 (SPSS Inc., Chicago, IL, USA) was used for all other statistical analyses. P-values of less than 0.05 were considered statistically significant.
RESULTS
1. Subject Characteristics
In Table 1, characteristics of the pre- and post-menopausal women were compared. Average age was 36.8 for pre-menopausal women, and 62.7 for post-menopausal women. Average WC was 74.99 cm for pre-menopausal women and 82.38 cm for post-menopausal women. The predicting factors for obesity such as BMI, WC, and WHtR were significantly higher in post-menopausal women than pre-menopausal women, and all results were statistically significant. 17.8% of pre-menopausal women and 62.2% of post-menopausal women had two or more components of non-adipose MS (Table 1).
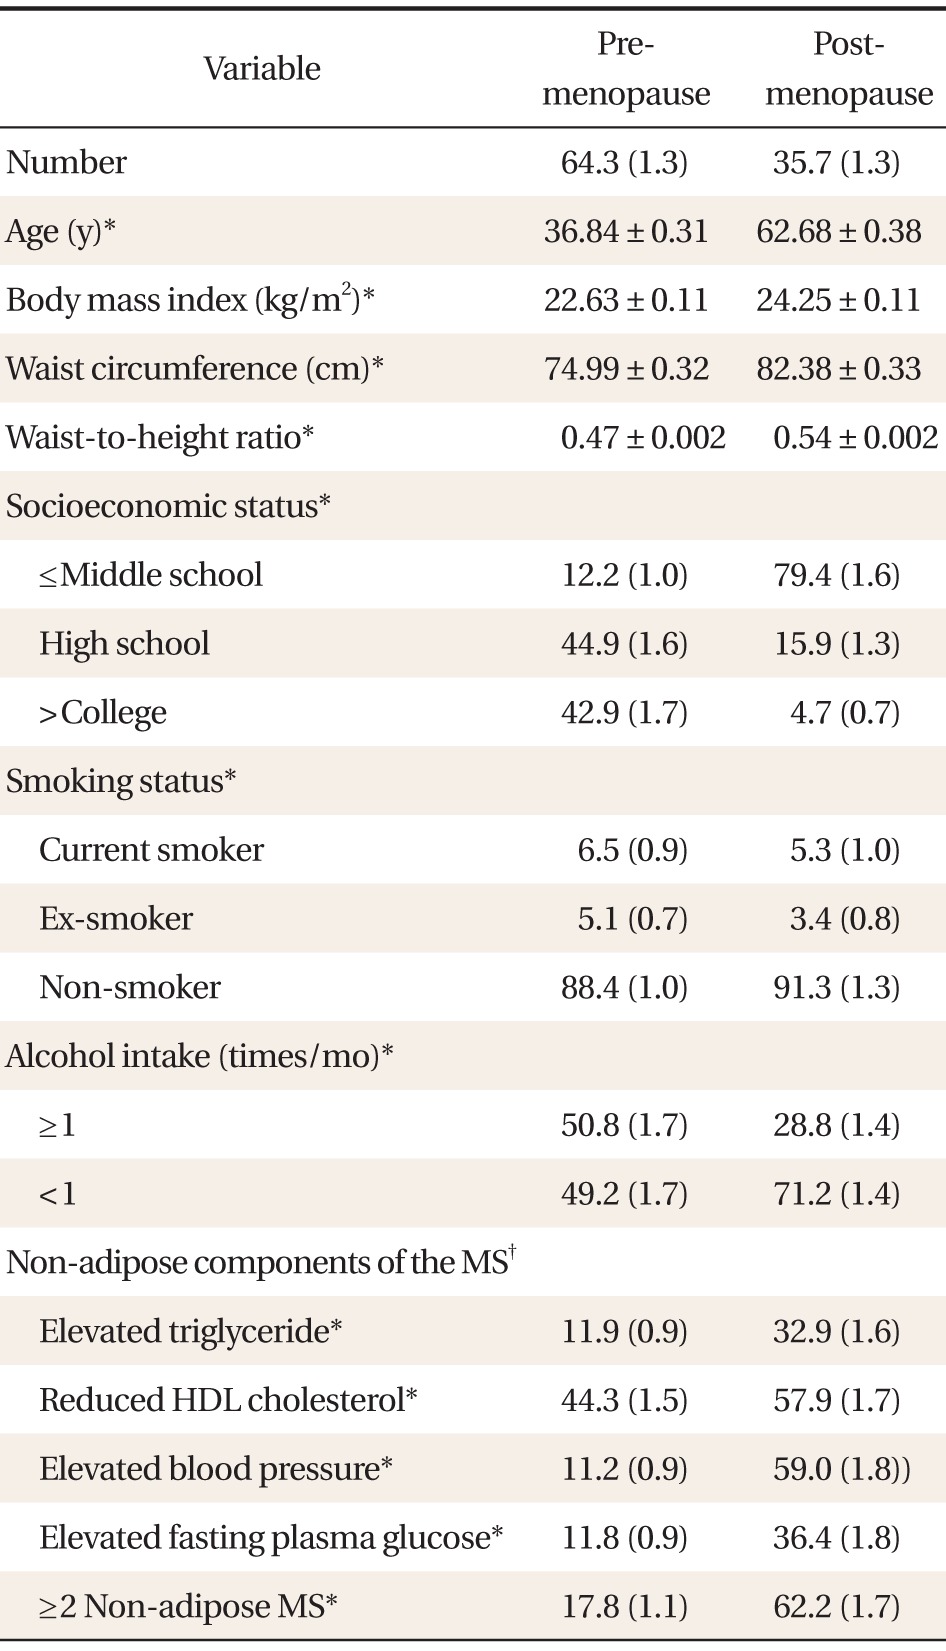
General characteristics of Korean pre- and post-menopausal women
The proportion of subjects who reached an education level of middle school or lower, high school, and above college were 12.2%, 44.9%, 42.9% in pre-menopausal women and 79.4%, 15.9%, 4.7% in post-menopausal women, respectively. In pre-menopausal women 88.4% were non-smokers, 5.1% were ex-smokers, and 6.5% were current smokers; in post-menopausal women, 91.3% were non-smokers, 3.4% were ex-smokers, and 5.3% were current smokers. Fifty-point-eight percent of pre-menopausal women and 28.8% of post-menopausal women drank alcohol more than 1 time during 1 month.
2. Receiver Operating Characteristic Curve and Area under the Curve of Central Obesity Indicators for Predicting Non-adipose Metabolic Syndrome
AUC values of BMI, WC, and WHtR for identifying the presence of two or more non-adipose components are presented in Table 2. AUC values of all indicators were all greater than 0.7 in pre-menopausal women, and less than 0.7 in post-menopausal women, showing that all indicators of central obesity were significantly (P < 0.001) more predictive of the presence of two or more non-adipose components of MS in pre-menopausal women than in menopausal women (Table 2), and also that differences in predictiveness were confirmed definitely by the ROC curve in Figure 1. Among indicators of central obesity, the AUC value of WHtR (0.793) was higher than WC and BMI (0.788 and 0.72).
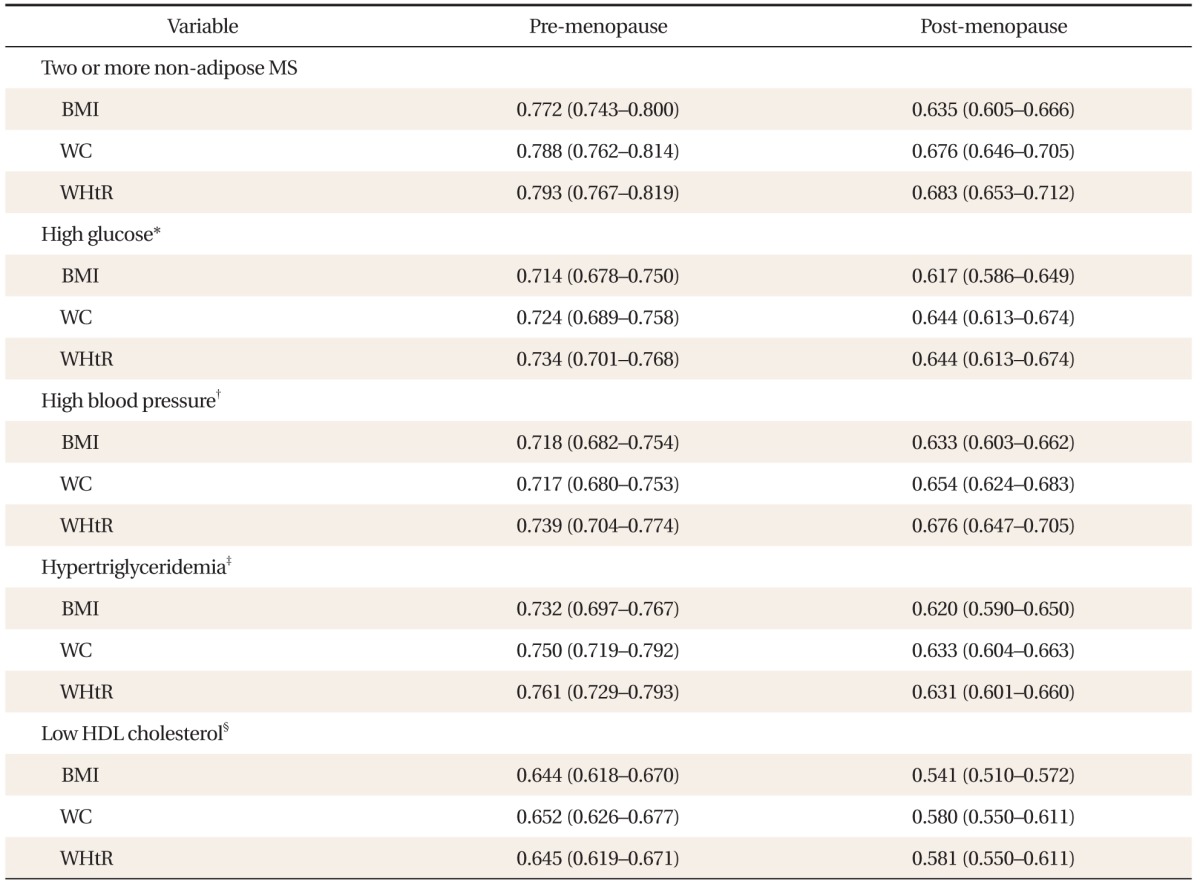
AUC and 95% CI of obesity to identify the presence of the non-adipose MS
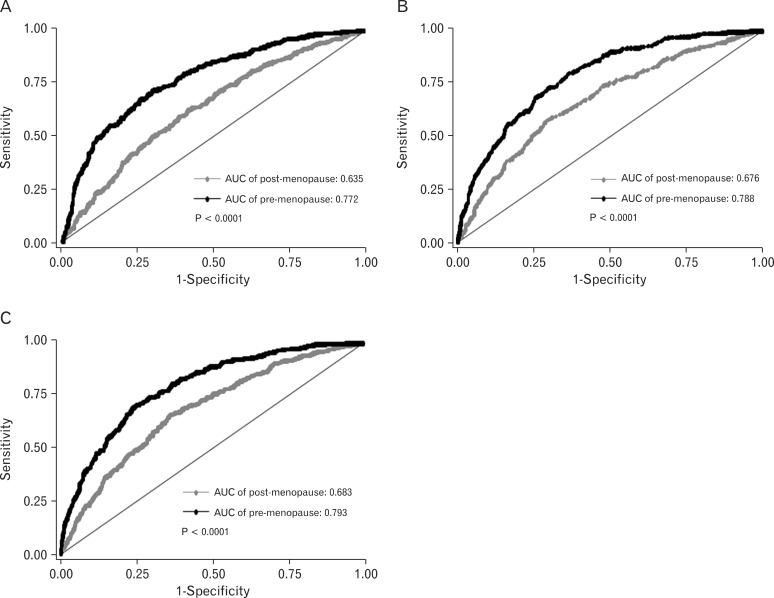
The receiver operating characteristic curves of (A) body mass index, (B) waist circumference, and (C) waist-to-height ratio to predict the presence of two or more non-adipose metabolic syndrome (MS) in pre- and post-menopausal women. Area under the curve (AUC) values of indicators were all greater than 0.7 in pre-menopausal women, and lesser than 0.7 in post-menopausal women, showing that all indicators of central obesity were significantly (P < 0.001) more predictive of the presence of two or more non-adipose components of MS in pre-menopausal women than in post-menopausal women.
AUC values of BMI, WC, and WHtR for identifying hyperglycemia, in pre-menopausal women, were 0.714, 0.724, and 0.734, respectively, showing that these indicators can predict hyperglycemia with significant accuracy. AUC values for hypertension and hypertriglyceridemia were both above 0.7 and all indicators of central obesity showed significant predictiveness, but the AUC value for low HDL cholesterol was under 0.7 and therefore did not show predictiveness. In post-menopausal women, AUC values of indicators of central obesity pertaining to each of the non-adipose components of MS were all under 0.7, showing that those indicators are not reliable predictors of metabolic disorder in post-menopausal women (Table 2).
3. Cutoff Values of Body Mass Index, Waist Circumference, and Waist-to-height Ratio with Predictive Value for the Presence of Two or More Non-adipose Components of Metabolic Syndrome
Table 3 shows the cutoff values of central obesity indicators and the sensitivity, specificity, positive predictive value, and negative predictive value for predicting the presence of two or more non-adipose components of MS. The cutoff values of BMI, WC, and WHtR for pre- and post-menopausal women were each 23.1 kg/m2 vs. 23.9 kg/m2, 76.1 cm vs. 82.5 cm, and 0.49 vs. 0.53, thus showing that BMI, WC, and WHtR cutoff values were each lower by 0.8 kg/m2, 6.4 cm, and 0.04 in the pre-menopausal group. Comparison of the specificity and sensitivity of the KOSSO's standard (85 cm) to the WC cutoff value obtained from each study group showed little difference between groups in menopausal women, but showed increased sensitivity (37.6% vs. 74.9%) and decreased specificity (91.4% vs. 67.3%) in pre-menopausal women (Table 3). Both this paper and the KOSSO guidelines report a significant (P < 0.001) increase in prevalence of central obesity corresponding to an increase in the number of non-adipose components of MS, and a larger gap between groups in pre-menopausal women in terms of rate of being diagnosed with central obesity (Figure 2).
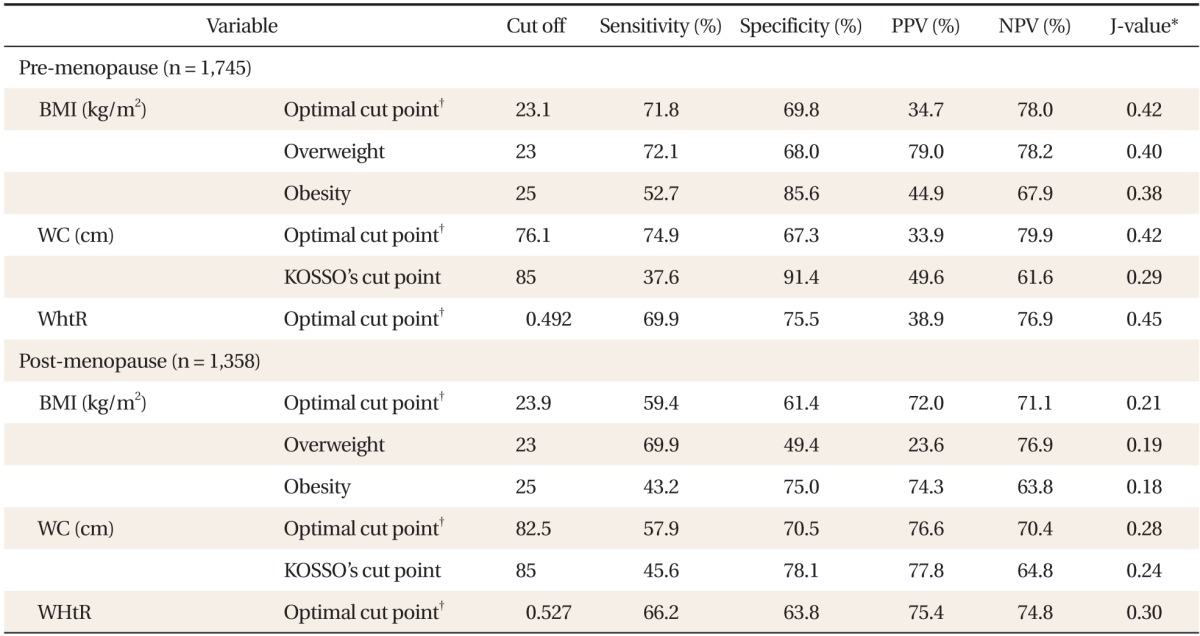
Sensitivity and specificity of BMI, WC, and WHtR to detect two or more non-adipose MS
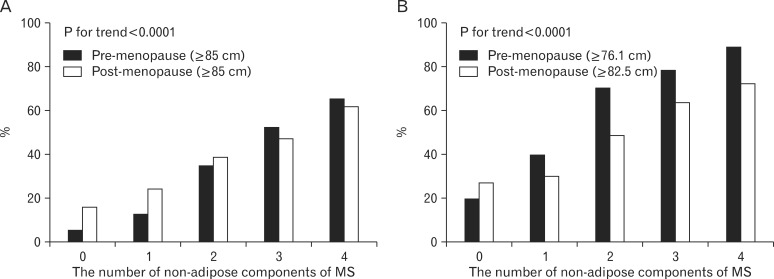
(A) The proportion of subjects with abdominal obesity diagnosed by Korea Society for the Study of Obesity's cut off (≥85 cm) and (B) our cutoff points (≥76.1 cm for pre-menopausal women and ≥82.5 cm for post-menopausal women) according to the number of non-adipose components of metabolic syndrome (MS). The prevalence of central obesity were significantly (P < 0.001) increased corresponding to an increase in the number of MS, in both study groups, and with a larger gap between groups in pre-menopausal women in terms of rate of being diagnosed with central obesity.
4. Prevalence of Metabolic Syndrome and Risk of Metabolic Disorders
According to the KOSSO' cutoff value (WC ≥ 85 cm), prevalence of MS in pre- and post-menopausal women was 7.3% and 28.7%, respectively. The prevalence of MS in pre- and post-menopausal women was, according to our cutoff value (≥ 76.1 cm in pre-menopausal women and ≥82.5 cm in post-menopausal women), 13.4% and 36.4%, respectively, a higher prevalence rate than with application of the KOSSO's cut off (Figure 3).
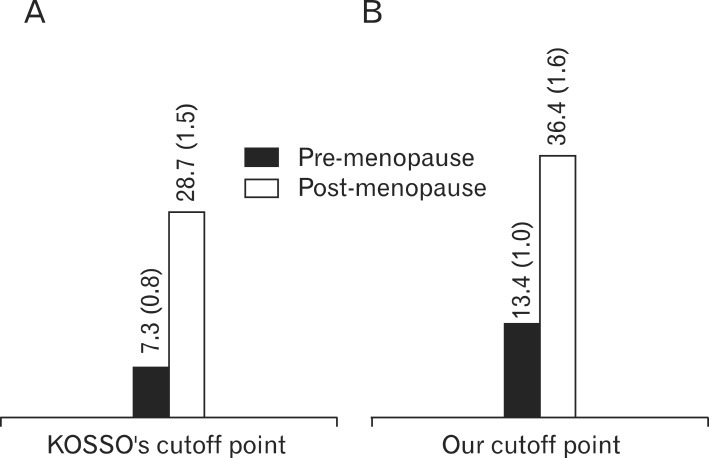
The proportion of subjects with metabolic syndrome using the International Diabetes Federation criteria (A) with Korea Society for the Study of Obesity's cut off (≥85 cm) and (B) with our waist circumference cut off points (≥76.1 cm for pre-menopausal women and ≥82.5 cm for post-menopausal women). According to the Korea Society for the Study of Obesity's cutoff value (≥85 cm), prevalence of metabolic syndrome in pre- and post-menopausal women was 7.3% and 28.7%, respectively. The prevalence of metabolic syndrome in pre- and post-menopausal women was, according to our cutoff value (≥76.1 cm in pre-menopausal women, ≥82.5 cm in post-menopausal women), 13.4% and 36.4%, respectively, a higher prevalence rate than with application of the Korea Society for the Study of Obesity's cut off. Values are presented as % (SE).
Table 4 displays the risk of non-adipose MS presented by a WC measurement above the cut off, adjusting for age, smoking, alcohol consumption, and SES. When WC exceeded the cutoff value proposed by this paper, the risk of having two or more indicators of non-adipose MS increased by 4.9 times in pre-menopausal women, and by 3.0 times in post-menopausal women.
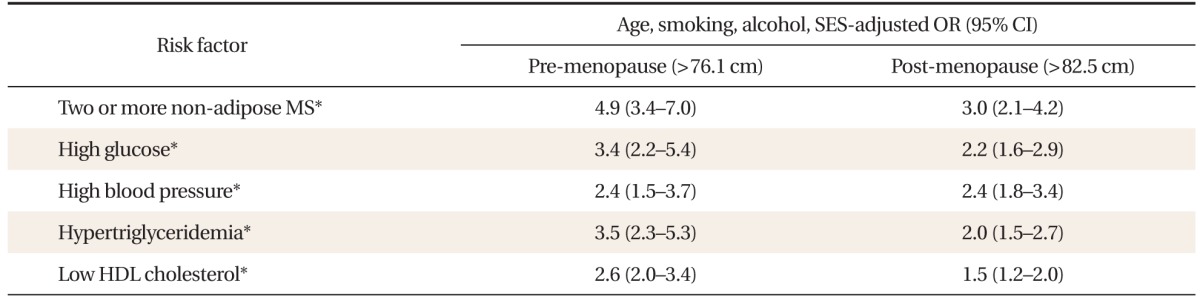
ORs adjusted for age, smoking, alcohol, and SES for risk factors by WC cut off points of 76.1 cm in pre-menopausal and 82.5 cm in post-menopausal women
DISCUSSION
The results of this study show that indicators of central obesity have greater predictive value for metabolic risk factors in pre-menopausal women than in menopausal women. Therefore it can be concluded that indicators of central obesity are effective predictors of risk of MS in pre-menopausal women. Research performed on elderly Koreans over the age of 63 by Seo et al.17) showed that the AUC value of WC as a predictor of the presence of two or more non-adipose components of MS was 0.682, similar to the values seen in our menopausal group. Chu et al.13) showed, in a study targeting Taiwanese women, that the predictiveness of WC for risk of MS was low in the menopausal group. Contrary to the results of our study, research results have also been reported to the effect that WC does not accurately reflect the presence of visceral fat in pre-menopausal women, unlike in menopausal women and men,18) and therefore has low predictive value for assessing risk of metabolic disease in that group. Loss of estrogen is an independent factor concerning many clinical signs relating to MS,19) with other risk factors predisposing menopausal women to metabolic disorders including advanced age, decrease in physical activity,20) and increase in comorbidty.21) Therefore, the significance of obesity as the sole predictor of metabolic risk is comparatively lower in menopausal women compared to pre-menopausal women.
WC cutoff values predictive of the presence of two or more MS components are 76.1 cm and 82.5 cm in pre- and post-menopausal women, respectively, and in post-menopausal women the cutoff value did not differ significantly from the standard for central obesity set by KOSSO. However, in pre-menopausal women, the cutoff value was about 9 cm lower. In a study targeting the adult Korean female population between the ages of 20 and 60, Lee22) proposed a WC cutoff value of 78 cm for pre-menopausal women younger than 55 and 85 cm for women who had undergone menopause or reached the age of 55 as a predictor for the presence of at least one cardiovascular risk factor, with a 7 cm difference between the pre- and post-menopausal groups. A study performed on Chinese women setting the onset on menopause at 50 determined the WC cutoff values were 81.5 cm and 86.3 cm in pre- and post-menopausal women, respectively, and proposed that lower cutoff values must be enforced for pre-menopausal women.23) Hayashi et al.24) calculated the WC cutoff value most predictive of MS in American residents of Japanese descent and determined that WC cutoff values as diagnostic criteria should differ between pre- and post-menopause, at 80.8 cm and 89.0 cm, respectively. Other studies concur with this study's findings that, in order to more accurately predict the risk of MS in pre-menopausal women, lower standard cutoff values must be set for WC. In contrast, the Korean genetic epidemiological cohort study showed that the WC most predictive of cardiovascular disease was 80 cm, and showed no difference between age groups.25)
Age, along with menopause, is a significant factor in the onset of metabolic disorder, as revealed in many studies. In order to correct for the effect of age on the results of this study, a sub-group analysis was performed targeting the age group (range, 46 to 55 years), during which menopause most commonly begins (data not shown). Sub-group analysis results showed that the WC cutoff value for pre- and post-menopausal women were 76.75 cm and 79.05 cm, respectively, showing that even with age taken into consideration, the risk of MS may increase at lower WC values than the current value of 85 cm in pre-menopausal women.
The WC cutoff value of 76 cm set forth in this study for pre-menopausal women and the KOSSO central obesity standard of 85 percent may be compared for sensitivity and specificity. The criteria currently recommended by KOSSO shows high specificity but a low sensitivity of 37.6%, causing many patients in a danger of developing MS to go unnoticed and making this an unsuitable criteria for first-line screening for risk of MS, especially considering that aggressive management for prevention is crucial in pre-menopausal women. The WC cutoff value (76 cm) presented in this study shows greater sensitivity and is better suited for screening to prevent the development of MS. In addition, WC is a highly cost-effective and convenient examination compared to imaging studies to calculate visceral fat, and has been reported to have a high predictive value for the onset of complications of MS.26) The KOSSO standards misdiagnosed as much as 44.7% and 47.4% of central obesity patients who were already diagnosed with MS on the basis of non-adipose components in the pre- and post-menopausal group, respectively. Application of the WC criteria proposed by this study missed only 19.2% and 33% of central obesity patients in the pre- and post-menopausal women, respectively and those trends were more evident in the pre-menopausal group. Thus, the criteria proposed by this study resulted in the discovery of the 25.5% of patients that could have been missed among pre-menopausal women, even before blood testing. Therefore a WC greater than 76 cm in pre-menopausal women implies an increased risk of MS and cardiovascular disease, and therefore a thorough check for other markers of metabolic dysfunction and aggressive maintenance therapy is strongly recommended for such patients.
Lee et al.,7) who determined the KOSSO central obesity criteria for adults of 20 to 80 years of age, set forth a WC cutoff value of 75 to 80 cm as predictive of MS in women. However, this criterion was based on the finding that the OR for possessing two or more non-adipose components sharply rose as WC exceeded 85 cm, and that OR remained steady at 5 when the WC was between 80 and 85 cm. When WC is greater than the cutoff values proposed in this study, the risk of having two or more non-adipose components of MS increases by 4.9 in pre-menopausal women, showing that a WC of 76.1 cm or greater is a comparatively powerful predictor of metabolic dysfunction, these findings being based on an OR value not significantly differing from that set forth in the KOSSO study. Using the cutoff values set forth in this study, the prevalence of MS leaps to 13.4% in the pre-menopausal group, twice the prevalence when applying the KOSSO criteria. While it has been pointed out that strict adherence to a standard for WC of 80 cm may result in an increased rate of diagnoses for abdominal obesity,25) it should be emphasized that overestimation of prevalence is a lesser evil compared to the risk of failing to aggressively prevent and manage metabolic and cardiovascular disorders. Thus, using the stricter obesity criteria is advisable to prevent the development of MS in pre-menopausal women.
In both groups, indicators of central obesity in order of increasing AUC value were WHtR, WC, and BMI, implying that WHtR is a slightly more effective marker for risk of metabolic dysfunction. Many other studies on the predictive value of these indicators confirm the superiority of WHtR to other indicators in predicting metabolic dysfunction27,28) as well as cardiovascular risk.29) Indeed, common sense tells us that it is difficult to assign the same meaning to identical waist measurements on individuals of different heights, and it has been proposed that the WHtR has greater power to determine bodily fat distribution and accumulation of visceral fat.28) The WHtR also has the advantage of fluctuating little between the sexes compared to WC, and is also not affected greatly by age, unlike BMI.30) BMI does not take WC into account and does not reflect the degree of central obesity (known to be a greater risk factor for cardiovascular disease than other types of obesity), or variations in physique according to muscle mass or height. Therefore, it is recommended that primary physicians take the WHtR in addition to WC measurements in order to improve the prediction accuracy of MS, and that further studies be conducted on the value of the WHtR.
This study made use of a representative sample of the general population, by way of the KNHANES, and therefore the subject group used for this experiment can be said to more accurately represent the general Korean female population. The study used results from the more recent 2010 KNHANES as opposed to resources from 1998, making this study more reflective of the current epidemiological status of Korean women. However, this study relied heavily on respondents to reply accurately to survey questions as well as on simplistic anthropometric measurements and did not take into account visceral fat levels as accurately measured by computed tomography or magnetic resonance imaging, or confirm menopause by measuring circulating levels of sex hormones. And because of the limitations of statistical programs, 'complex samples analysis' could not be performed for ROC curve analysis. As a cross-sectional study, this study also has its drawbacks, pointing out the need for future longitudinal studies to elucidate the relationship between markers of central obesity and onset of cardiovascular disease.
Central obesity can be a more effective predictive tool in screening for metabolic risk factors in pre-menopausal women than post-menopausal women. Pre-menopausal women whose WC was lower than the current standard of 85 cm can still be at risk for metabolic dysfunction. Considering that pre-menopausal women have a longer life expectancy than post-menopausal women, early detection and management of metabolic risks is all the more crucial. Therefore, more stringent central obesity criteria are needed in pre-menopausal women for preventing MS. Primary medical personnel have to consider the possibility of MS risks in pre-menopausal patients presenting with WC lower than the current standard of 85 cm, and must take steps to further assess the possibility of other risk factors.
Notes
No potential conflict of interest relevant to this article was reported.