Factors Associated with Serum Levels of Carcinoembryonic Antigen in Healthy Non-smokers
Article information
Abstract
Background
Carcinoembryonic antigen (CEA), a serological marker of malignant tumors, demonstrates a modest increase under nonmalignant conditions such as aging and smoking. Also, recent study results suggested that serum CEA levels may be related to insulin resistance or low-grade inflammation. The aim of this study was to investigate the factors associated with serum CEA levels in healthy non-smokers.
Methods
Data was gathered from 21,501 adults aged 20 and over. We excluded 19,081 subjects who had omissions in anthropometric measurements or laboratory tests, or who had previous or current smoking history.
Results
The mean CEA level was 1.18 ± 0.85 ng/dL in males and 0.93 ± 0.73 ng/dL in females. After adjustment for age, CEA level was positively correlated with fasting glucose, glycosylated hemoglobin (HbA1C), high density lipoprotein (HDL) cholesterol, estimated glomerular filtration rate in males. In females, CEA level was positively correlated with fasting glucose, HbA1C, HDL cholesterol, aspartate aminotransferase, and high-sensitivity C-reactive protein. In both gender groups, HbA1C had a strong influence on CEA levels when all other variables were included in the regression model (P < 0.05).
Conclusion
Within normal range, serum CEA levels were significantly associated with HbA1C levels but not with homeostasis model assessment of insulin resistance in the non-smoking population. These findings suggest that serum CEA levels are influenced by the glucose level itself instead of insulin resistance.
INTRODUCTION
Carcinoembryonic antigen (CEA), an oncofetal glycoprotein, is a widely used tumor marker due to its high expression in adenocarcinomas, particularly colorectal cancer. However, it is also expressed in normal mucosal cells1) and CEA elevation is associated with several non-neoplastic conditions, including chronic renal failure, hypothyroidism, chronic obstructive pulmonary disease, obesity, aging, and cigarette smoking.2-6)
Recently, several studies have reported that the serum level of CEA was independently associated with metabolic syndrome, atherosclerosis, and insulin resistance.7-10) Although the function of CEA has not been fully clarified, previous studies have reported that CEA stimulates monocytes and macrophages to trigger the production of pro-inflammatory cytokines and endothelial adhesion molecules.11,12) Also, these pro-inflammatory features of CEA suggest that CEA could be related with insulin resistance or metabolic syndrome because insulin resistance and low-grade inflammation have been considered important pathogenic components of metabolic syndrome.13)
Because serum CEA levels are often slightly elevated in healthy cigarette smokers, only some information is available on the possible association between serum CEA levels and insulin resistance or low-grade inflammation in non-smokers including males. The aim of this study was to investigate whether the insulin resistance or low-grade inflammation was associated with increased serum levels of CEA in healthy non-smoking males and females.
METHODS
1. Study Subjects
Data was gathered from 21,501 adults aged 20 and over. All subjects had visited the health promotion center of Eulji University Hospital for a periodic health examination between January 2010 and July 2011. Among these subjects, we excluded 19,081 subjects who met one of the following conditions: omissions in anthropometric measurements or laboratory tests (n = 16,534); previous or current history of cancers (n = 56); previous or current smoking history (n = 2,319); pregnancy (n = 2); abnormal liver or renal function (n = 26); high-sensitivity C-reactive protein (hsCRP) > 1 mg/dL (n = 41); or a history of taking medications for diabetes (n = 103). The final analytic sample was confined to 2,420 subjects. This study was approved by the institutional review board of Eulji University Hospital.
2. Data Collection and Anthropometric Measurements
All subjects completed self-reported questionnaires regarding lifestyle-related information, including their smoking, alcohol drinking, and exercise habits. Detailed medical histories were collected from the medical interviews. A smoker was defined as a current smoker and an ex-smoker who had stopped smoking within the last 6 months. Alcohol consumption was defined as more than two bottles (one bottle in females) of soju (a type of distilled spirit containing 56.8 g of pure alcohol) consumed per week. Regular exercise was defined as 30 minutes or more at a time, three times per week regularly. Height and weight were measured in subjects wearing a light robe and no shoes. Waist circumference was measured and body mass index was calculated as body weight (kg) divided by height squared (m2). Blood pressure and heart rate were measured with an automatic instrument (BP-8800C; Colin Electronics, Komaki, Japan) in a sitting position on at least two different occasions after 10 minutes of rest.
Blood samples were collected after an overnight fast (>12 hours) and analyzed within 3 hours after the sampling. Complete blood cell counts were quantified by an automated blood cell counter (ADVIA 2120i analyzer; SIEMENS Diagnostics, Tarrytown, NY, USA). Blood chemistry was measured by an enzymatic technique using an ADVIA 2400 analyzer. The method used to measure the low density lipoprotein cholesterol was the homogeneous assay from International Reagents Corporation. High-sensitivity C-reactive protein (hsCRP) was measured via a turbidmetric immunoassay using a Hitachi 7170S device (Hitachi Hi-Tech, Tokyo, Japan). Estimated glomerular filtration rate (eGFR) was calculated by simplified modification of diet in the renal disease equation. CEA and plasma insulin levels were measured by chemiluminescence immunoassays using an ADVIA Centaur XP device (Siemens Healthcare Diagnostics, Los Angeles, CA, USA). Glycosylated hemoglobin (HbA1C) was assayed by ion-exchange high-performance liquid chromatography using an HLC-723 G7 machine (Tosoh Corporation, Tokyo, Japan), which was calibrated to the Diabetes Control and Complication Trial standard. The homeostasis model assessment of insulin resistance (HOMA-IR) was calculated as [fasting insulin (mIU/mL)-{fasting glucose (mg/dL)/18.1}]/22.5.
3. Definition of Variables
Metabolic syndrome was defined based on the modified National Cholesterol Education Program's Adult Treatment Panel III definition14) and according to the definition of the Korean Society for the Study of Obesity.15) Subjects were classified as having metabolic syndrome if any three of the following were present: abdominal obesity (waist circumference ≥ 90 cm in male, ≥ 85 cm in female); high blood pressure (systolic blood pressure ≥ 130 mm Hg or diastolic blood pressure ≥ 85 mm Hg); high fasting glucose (≥100 mg/dL); high triglyceride (≥150 mg/dL); or low high density lipoprotein (HDL) cholesterol (<40 mg/dL in males and <50 mg/dL in females).
4. Statistical Analyses
All statistical analyses were performed using SPSS ver. 14.0 (SPSS Inc., Chicago, IL, USA). Skewed data were transformed to the natural logarithm scale prior to statistical analysis. To compare the general characteristics of the study subjects according to gender, independent t-test and chi-square tests were used for continuous and categorical variables, respectively. Correlation coefficients between CEA levels and other variables were calculated by partial correlation analysis after adjusting for age. Multivariate linear regression analysis was performed to identify the major determinants of CEA levels. In this model, the independent variables were chosen based on a partial correlation analysis. The mean values of CEA according to HbA1C levels were compared by analysis of variance. A probability value of P < 0.05 was considered significant.
RESULTS
The mean ages of the 543 males (22%) and 1,877 females (78%) were 46.8 ± 11.0 and 47.0 ± 11.5 years, respectively. Thirty-two percent of female subjects were menopausal. There was no difference in the prevalence of metabolic syndrome according to gender. The mean CEA level was 1.18 ± 0.85 ng/dL in males and 0.93 ± 0.73 ng/dL in females (P < 0.001). The mean CEA levels of females with and without metabolic syndrome were 0.91 ± 0.73 ng/dL and 1.07 ± 0.70 ng/dL, respectively (P < 0.05). This difference was significant only in females (data not shown). Fasting glucose levels and hsCRP levels were significantly higher in females. On the other hand, there were no differences in HbA1C. General characteristics of the study subjects are presented in Table 1. Figure 1 shows the mean levels of CEA according to HbA1C in each gender. The mean levels of CEA levels were significantly higher in the highest HbA1C group (P < 0.005) (Figure 1).
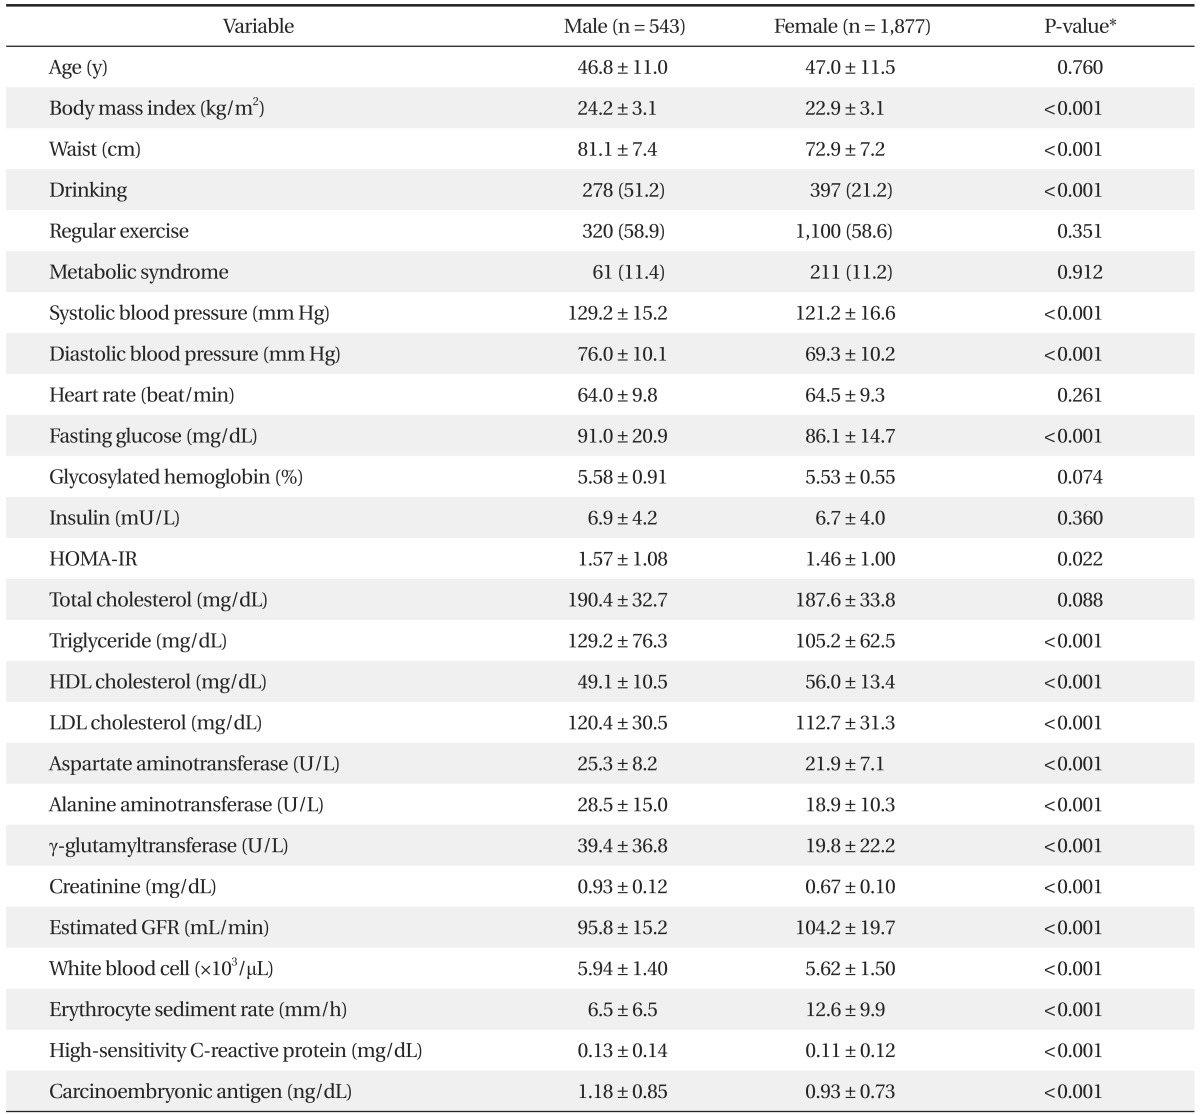
General characteristics of study subjects
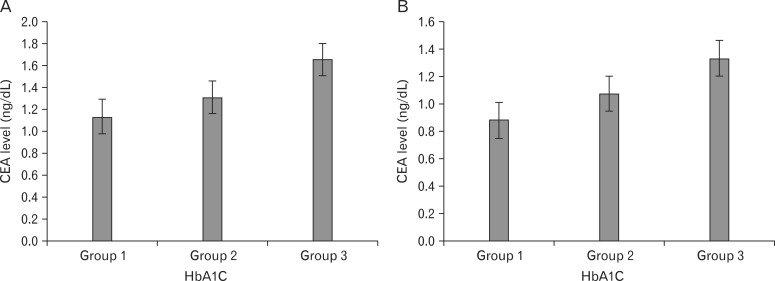
Mean values of carcinoembryonic antigen (CEA) according to glycosylated hemoglobin (HbA1C) groups in males (A) and females (B). Values are presented as the mean ± SE. P-value < 0.005 by analysis of variance in both (A) and (B). The groups were defined as follows: group 1, HbA1C < 5.7%; group 2, 5.7% ≤ HbA1C < 6.5%; group 3, HbA1C ≥ 6.5%.
After adjustment for age, CEA level was positively correlated with fasting glucose, HbA1C, HDL cholesterol, eGFR in males. In females, CEA level was positively correlated with fasting glucose, HbA1C, HDL cholesterol, aspartate aminotransferase, and hsCRP (Table 2).
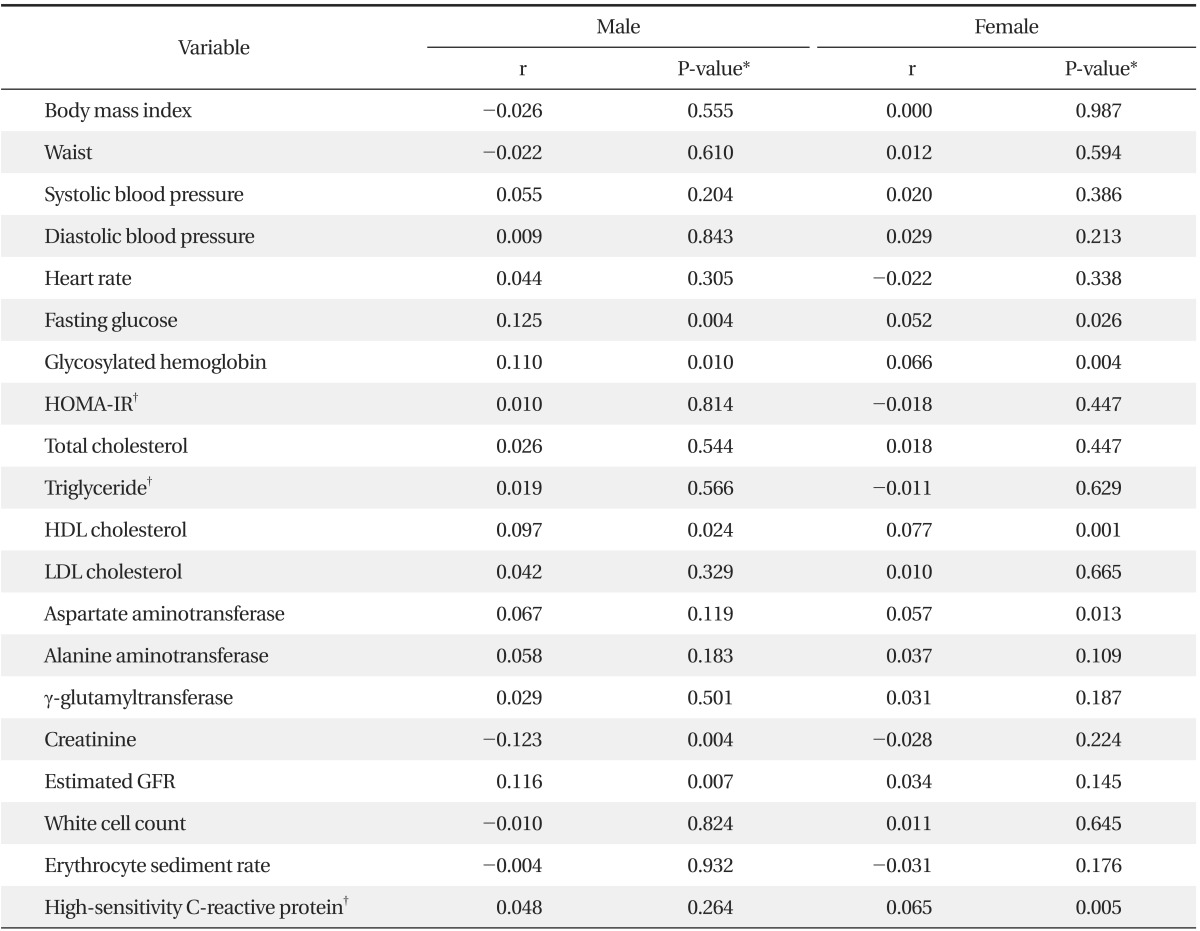
Partial correlation coefficients between CEA levels and other variables
Table 3 shows that HbA1C had the strongest influence on CEA levels when age, waist and all other variables were included in the regression models in each gender. Also, in males, eGFR and age were associated with CEA levels (P < 0.05). On the other hand, age, HDL cholesterol, hsCRP, and exercise were associated with CEA levels in females (P < 0.05). Waist, blood pressure, triglyceride levels, and HOMA-IR were not associated with CEA levels in either gender. All together, these variables explain up to 3.3% and 8.3% of the variation in the CEA levels in males and females, respectively (Table 3).
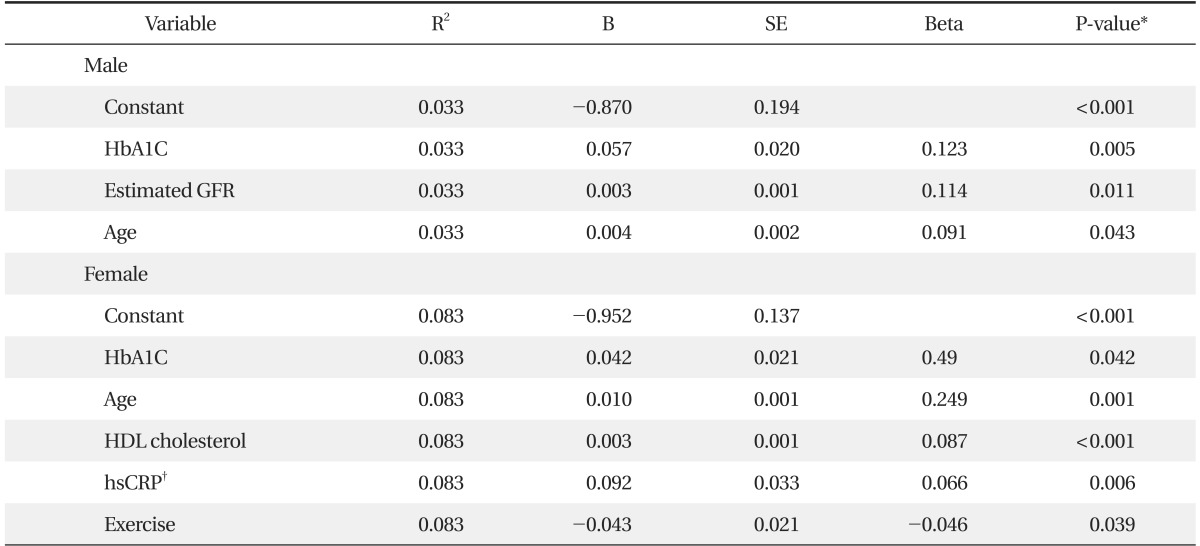
Multivariate regression analyses with CEA level as a dependent variable
DISCUSSION
Although of little use in detecting early colorectal cancer, CEA is a useful indicator for surveillance of patients with diagnosed colorectal cancer. Slightly elevated CEA levels are associated with several conditions,2-6) but very little information exists about the significance of mildly elevated CEA levels over an extended period in individuals who do not have cancer. Recently, some epidemiological studies have demonstrated a possible association between increased CEA levels and metabolic syndrome or atherosclerosis.7-11) Lee et al.7) reported that CEA level was independently associated with metabolic syndrome after adjustment for all covariates in Korean female non-smokers. For the same reason, Kim et al.8) suggested that metabolic syndrome may lead to a misunderstanding of CEA levels. Ishizaka et al.9) reported that CEA was associated with carotid atherosclerosis in Japanese males without serious health problems. The increase in serum CEA was found to be associated with an increased prevalence of carotid plaque independent of blood pressure, fasting glucose, serum lipids, and inflammatory markers. Bae et al.10) reported that CEA level was associated with arterial stiffness in healthy Korean males and females after adjustment for all covariates. These data indicate the plausibility that serum CEA may be associated with increased insulin resistance and low-grade inflammation.
Previous studies have suggested that CEA may stimulate macrophages or monocytes via binding to the CEA receptor which results in the production of pro-inflammatory cytokines such as tumor necrosis factor-α, interleukin-1b and -6, reactive oxygen species, eicosanoids, nitric oxide, and carbon monoxide, and up-regulation of endothelial adhesion molecules, which may play a role in metabolic disturbances and cardiovascular disease in addition to cancer.11,12) Low-grade inflammation is now recognized as the central player in the pathogenesis of atherosclerosis, insulin resistance, and glucose intolerance.16,17) Also serum CEA levels were increased in patients with chronic inflammatory disorders such as inflammatory bowel disease, collagen disease, and chronic viral hepatitis.2,18)
In this study, we investigated the factors associated with CEA levels and whether insulin resistance or low-grade inflammation was associated with high CEA levels in healthy non-smokers including non-smoking males. Although HbA1C and age were shared determinants of CEA levels in both genders, the other factors associated with CEA levels were different in each gender. In male subjects, eGFR was associated with CEA levels, but CEA levels were associated with HDL cholesterol, hsCRP, and exercise status in females. Contrary to expectations, the HOMA-IR was not associated with CEA levels in each gender. This finding suggests that the factor affecting CEA levels is glucose levels rather than insulin resistance. On the other hand, hsCRP is associated with CEA levels in females, but not in males. Shio et al.19) reported that the serum CEA level was significantly associated with fasting glucose levels in diabetic patients. Another study had revealed that serum levels of CEA and carbohydrate antigen 19-9 (CA19-9), a tumor marker of pancreatic cancer, could be influenced by high glucose levels and HbA1C in diabetic patients.20) These results may be due to similar components such as glucose, glycoprotein, and lipid of CEA, CA19-9, and HbA1C.21)
Several variables including HbA1C were associated with CEA levels, and these variables explain up to 3.3% and 8.3% of the variation in the CEA levels in male and female gender, respectively. This finding suggests that many other factors seem to have a stronger influence on CEA levels.
This study has a number of strengths. First, this study subjects include a large number of non-smoking males, though a fewer number than males. Second, there are several factors that influence serum CEA levels and its metabolism. For this reason, we excluded all subjects that had any smoking history including ex-smokers and abnormal liver or kidney function test results, in order to eliminate the influence of these conditions. Third, we also excluded all subjects that had any diabetic medications which may influence HOMA-IR in the identification of the association between insulin resistance and serum CEA levels. For the same reason, we exclude all subjects whose levels of hsCRP > 1 mg/dL, as this may indicate active inflammatory or infectious conditions.
At the same time, this study has some limitations. First, because the study was cross-sectional, we cannot verify the causality between the each variable and the elevation of serum CEA. Second, we cannot rule out selection bias in our subjects, who had visited a health promotion center. Therefore, these results cannot be generalized to other population groups. Third, serum CEA is known to be elevated in other nonmalignant conditions, such as hypothyroidism and end-stage lung diseases. We did not include these disorders as confounding variables, because their prevalence is considered to be very low among study populations.
In conclusion, within the normal range, serum CEA levels were significantly associated with HbA1C levels but not with HOMA-IR in the non-smoking population. These findings suggest that serum CEA levels are influenced by the glucose level itself rather than insulin resistance.
Notes
No potential conflict of interest relevant to this article was reported.