Association between Muscle Loss and Urinary Incontinence in Elderly Korean Women
Article information
Abstract
Background
Incontinence and muscle loss are important senior health issues. Nevertheless, there are no available domestic or international studies on the association between urinary incontinence and muscle loss. The aim of this study was to investigate the association between muscle loss and urinary incontinence in elderly Korean woman.
Methods
Korean women (1,313) ≥65 years of age whose complete body composition data were collected using dual X-ray absorptiometry were analyzed from the Fourth Korean National Health and Nutritional Examination Surveys. Class I and II losses of the appendicular, truncal, and total muscle mass were defined using adjustments for weight and height. Each participant's incontinence status was collected using constructed questionnaires. Multiple logistic regression was performed to examine the association between muscle loss and incontinence.
Results
On the basis of physician-diagnosed incontinence, weight- and height-adjusted muscle loss showed no association with urinary incontinence (weight-adjusted muscle loss: class I adjusted odds ratio [aOR], 0.77; 95% confidence interval [CI], 0.34 to 1.73; class II aOR, 1.37; 95% CI, 0.59 to 3.18; height-adjusted muscle loss: class I aOR, 0.51; 95% CI, 0.18 to 1.51; class II aOR, 1.86; 95% CI, 0.22 to 15.79). Similar results were observed for truncal muscle and total muscle mass as well as self-reported urinary incontinence.
Conclusion
Our study found no association between urinary incontinence and appendicular, truncal, and total muscle loss in elderly Korean women.
INTRODUCTION
Korea currently has one of the fastest aging populations. In 2005, 9.1% of the Korean population was ≥65 years of age. It has been predicted that in 2020, 15.7% of the population will be ≥65 years, and in 2030, this figure will reach 24.1%.1) Therefore, public healthcare for those who are ≥65 years is becoming serious and research on this issue is increasing.2)
Research has shown that the elderly Korean population has decreased bone mineral density as well as an increased fat mass with time.2,3) As a result, there has been a recent increase in attention on sarcopenia.
Sarcopenia is defined as a loss of muscle mass and decreased muscle strength or physical performance with increasing age. These effects cause comorbidities and even death.1,4,5) Muscle mass loss is related to an increase in falls, trauma, physical performance disability, hospital admission rates, and decreased quality of life and mortality.1,2,6,7) Until now, there have been no standard criteria for muscle mass loss. However, using different definitions of muscle loss, previous studies have shown that decreases in muscle mass and strength cause serious chronic diseases such as insulin resistance, metabolic syndrome,1) depression,8) osteoarthritis,4) cardiovascular disease,9) and osteoporosis.10)
Muscle mass loss is related to the aging process throughout the whole body as evidenced by decreases in growth and sex hormone levels, neuromuscular changes, increases in blood inflammation markers, decreases in protein intake, smoking, increases in oxidative stress, increases in fat mass, and decreases in physical activity.11) Although most previous studies on muscle mass loss have focused on appendicular skeletal muscle quality, mass, and strength, decreased muscle mass is understood as a systemic whole-body change.
One of every four women in Korean has urinary incontinence12) that is specifically related to aging. Urinary incontinence affects an individual's quality of life, especially their physical, social, and psychological health statuses.13) Furthermore, urinary incontinence not only increases the incidence of chronic physical diseases including urinary infections, sores, falls, and fractures,14) but also increases the percentage of mental diseases such as low self-esteem, depression, and sexual dysfunction.13) One of the pathogeneses of urinary incontinence is detrusor muscle dysfunction; as a result, increases in residual urine after voiding and overflow urinary incontinence may occur. Stress urinary incontinence occurs in the presence of urethral sphincter dysfunction and a decrease in urethral sphincter pressure.15) In a study of pelvic architecture in patients with urinary incontinence, an elderly group showed decreased pelvic muscle mass along with decreased general muscle mass. Moreover, atrophy and weakness of the pelvic muscles induces changes in pelvic architecture angle and results in urinary incontinence.16) Based on a previous study of urinary incontinence, we assumed that urinary incontinence is associated with muscle mass loss because pelvic muscle and architecture play important roles in the pathogenesis of urinary incontinence.
There is a lack of domestic and international studies of the correlation between urinary incontinence and muscle mass, so more research is needed due to the clinical importance of these diseases. The purpose of this study is to analyze the relationship between a decrease in appendicular skeletal, trunk, and total muscle masses and urinary incontinence using the Korean National Health and Nutrition Examination Survey (KNHNES).
METHODS
1. Study Population
The study design was cross-sectional and we used 2-year data from the KNHANES (KHANES IV; July 2008 to December 2009) supported by the Ministry of Health and Welfare and Korea Centers for Disease Control and Prevention. The KNHANES consists of a health interview survey, health behavior survey, nutrition survey, and health examinations of children, adolescents, and adults that were conducted regularly since 1998 by the Korea Centers for Disease Control and Prevention to produce a broad range of descriptive health and nutritional statistics for the population's sex and age subdomains. The KNHANES IV contains probability samples representative of the entire country that were collected using a rolling survey sampling design method.
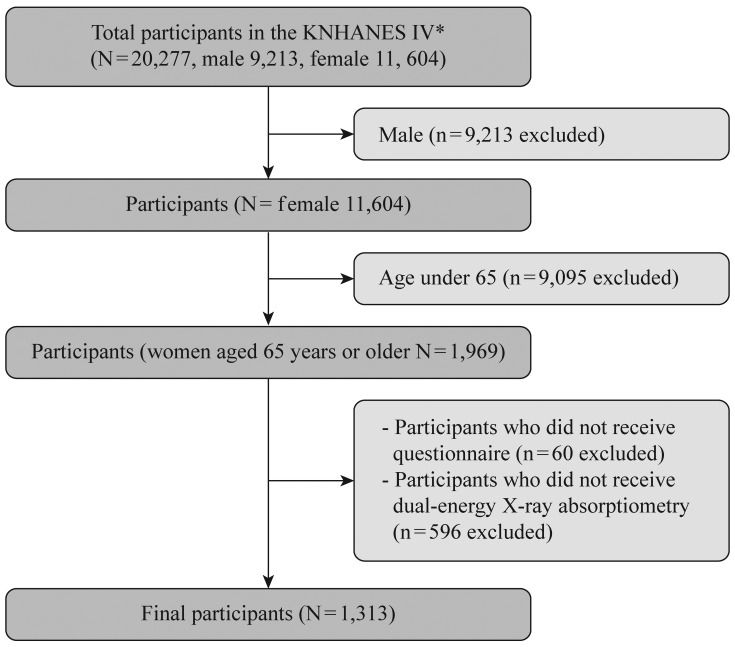
Of the 20,277 patients profiled in the KNHANES IV, 9,213 were men and 11,064 were women. Of the men, only 38 (0.5%) responded that they had urinary incontinence symptoms and 20 participants (0.27%) were diagnosed with urinary incontinence by a doctor. Considering the low prevalence and gender differences in the pathogenesis, the men were excluded from this study. Only women aged ≥65 years (1,969 participants) were included in this study according to the World Health Organization definition about the aged. Of these participants, 1,313 underwent both a urinary incontinence survey and dual-energy X-ray absorptiometry (DXA) examinations and were thus deemed eligible for the study (Figure 1).
2. Appendicular Skeletal and Total Muscle Mass Loss
Appendicular skeletal muscle and fat masses were measured using DXA of 2-year data from the KNHANES IV (July 2008 to December 2009). The cutoff values for muscle mass loss were based on the prevalence of sarcopenia and sarcopenic obesity in the Korean population by Kim et al.17) The cutoff values of class I and II muscle mass loss were determined to be 25.6% and 23.0%, respectively, by the weight-adjusted muscle loss (WAML) definition and 5.38 kg/m2 and 4.59 kg/m2, respectively, by the height-adjusted muscle loss (HAML) definition.17,18)
3. Truncal and Total Muscle Mass
Truncal and total muscle mass were measured using DXA as described above. Total muscle mass refers to the muscle mass of the entire body but the head. Truncal and total muscle masses were analyzed as continuous and quartile variables, respectively, adjusted by height and weight.
4. Urinary Incontinence
Urinary incontinence was defined using the health survey data of the KNHANES IV. Each of the urinary incontinence questions was answered as "yes" or "no." Self-reported urinary incontinence was determined according to the participants' answers ("Have you ever suffered from urinary incontinence?") and urinary incontinence was diagnosed by a doctor using a structured questionnaire ("Do you have urinary incontinence?").
5. Variable Definition
The following health examination and interview data were retrieved from the KNHANES IV. According to previous studies, age is the most important variable of urinary incontinence.19) As such, it was analyzed here as a continuous variable. Body mass index (BMI) was calculated as weight in kilograms divided by the square of the height in meters. The cutoff BMI value was 25 kg/m2 in our study.5,6) Subjective health status was reclassified from the five-point scale ranging from very good to very poor of the KNHANES IV to a three-point scale of good, average, and poor. Pregnancy experience (history of delivering one or more baby) was classified as yes or no and activity limitation was used to answer yes or no using the questionnaire ("Do you have limitations in daily life or social activities because of your current health problems or physical or mental disability?"). According to previous studies about the risk factors of urinary incontinence, neurological diseases, and co-morbidities, abdominal and urological surgical history as well as medication history were the main causes of urinary incontinence.20,21)
Comorbidities were assessed using yes or no answers to questions on the survey of the prevalence of stroke, depression, diabetes, arthritis, and osteoporosis in the KNHANES IV. Profession was classified as a binary variable divided into an economically active person and unemployed or economically inactive person depending on the current economic activities. At-risk alcohol drinking was defined as more than seven drinks per week or three drinks on any single day depending on the standard drinking according to the criteria established by the Alcohol Research Center National Institute on Alcohol Abuse & Alcoholism clinicians' guide in 2005, while the alcohol consumption amount was classified as a binary variable according to the at-risk drink definition.22) Smoking status information was collected by asking whether participants were never, past, or current smokers. Marital status was recorded as with or without spouse (the former included living together, while the latter meant separated, divorced, widowed, or single). Income was assessed using the personal income quartile of the KNHANES IV. Regular exercises were evaluated as the number of moderate-intensity physical activity sessions per week divided into less than three times a week and more than three times a week. Hormone replacement was assessed using a yes or no question and education level was reclassified into four categories: <6 years, ≥6 to <9 years, ≥9 to <12 years, and ≥12 years.
6. Statistical Analysis
The participants' anthropometric characteristics are described as means and SDs. The participants' general characteristics are expressed as numbers and percentages. To compare intergroup differences, continuous variables were tested using analysis of variance and the chi square test to detect differences in the distribution of categorical variables.
The association between appendicular skeletal, truncal, and total muscle mass and urinary incontinence, adjusted for covariates, was analyzed using multivariate logistic regression analysis. Potential covariates included age, occupation, education level, self-reported health status, pregnancy experience, activity limitation, body mass index, and depression. The group without urinary incontinence was used as the reference group. Odds ratio (OR) and 95% confidence interval (95% CI) were obtained from multivariate analysis.
Values of P < 0.05 were considered statistically significant in all analyses. To estimate the significance of the trend, the truncal and total muscle mass variable was considered a continuous variable in the trend analysis. All statistical results were based on two-sided tests. Data were analyzed using Stata ver. 12.1 software (Stata Co., College Station, TX, USA).
RESULTS
A total of 1,313 Korean women ≥65 years of age were included in this study: of them, 1,139 (86.8%) did not have urinary incontinence. Of the 174 participants (13.2%) with urinary incontinence symptoms, 41 (3.1%) were diagnosed by a doctor and 133 reported that they were affected by urinary incontinence despite the lack of a diagnosis.
1. Participants' Anthropometric Characteristics
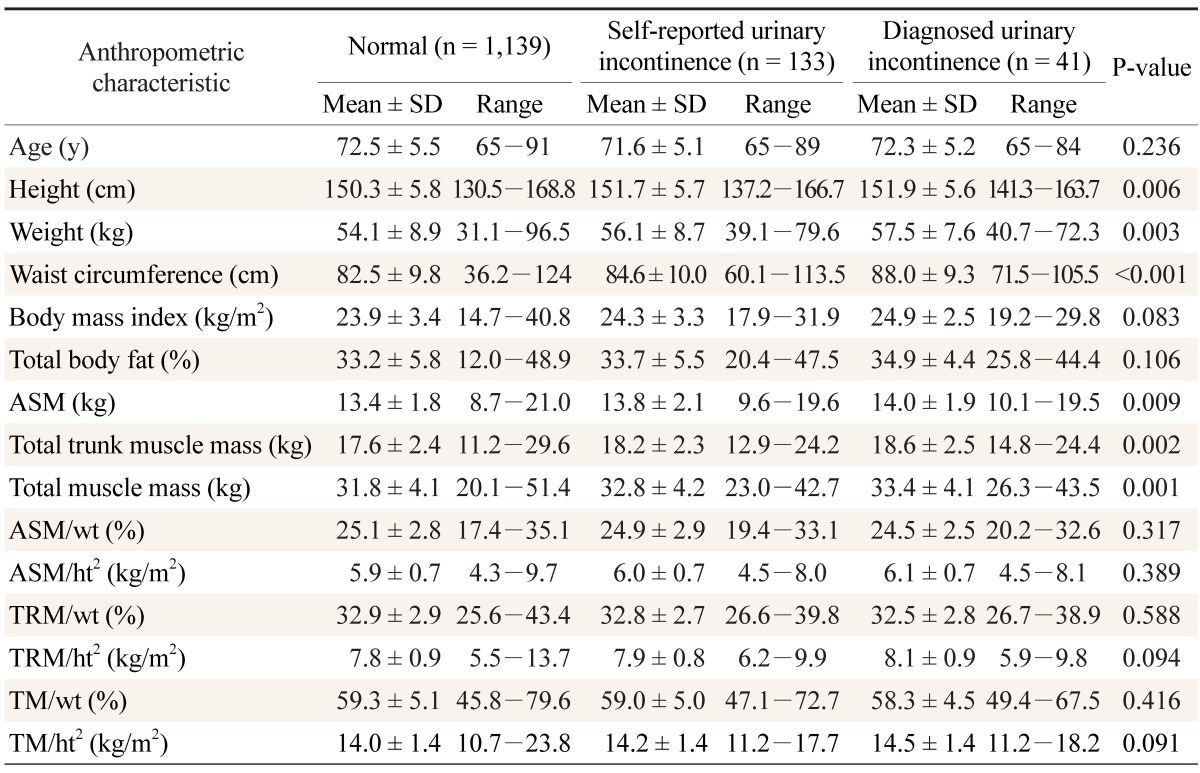
The participants' anthropometric characteristics are shown in Table 1. Patients with urinary incontinence showed higher values of height (P = 0.006), weight (P = 0.003), abdominal circumference (P < 0.001), appendicular skeletal muscle mass (P = 0.009), truncal muscle mass (P = 0.002), and total muscle mass (P = 0.001) than the control group. However, there was no association between urinary incontinence and BMI, total body fat, height- or weight-adjusted appendicular skeletal muscle mass, height- or weight-adjusted truncal muscle mass, or height- or weight-adjusted total muscle mass (Table 1).
2. General Characteristics of Participants
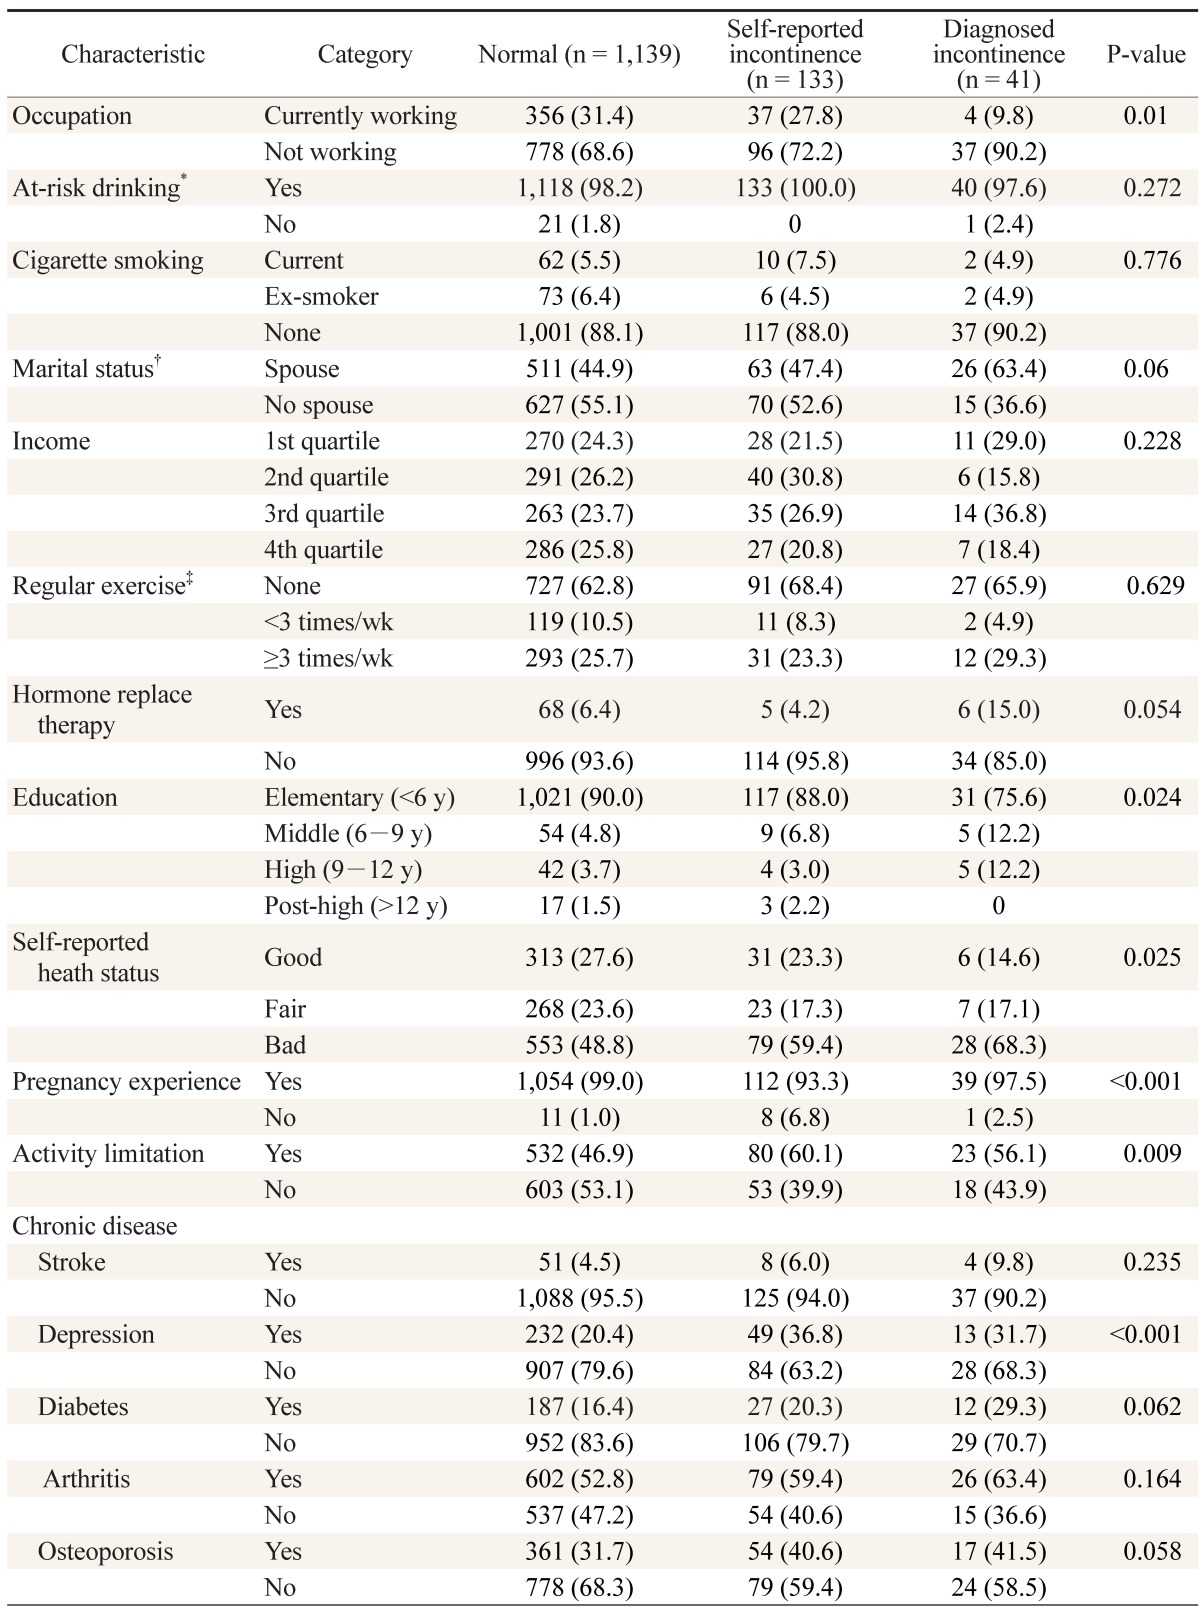
The following parameters were statistically significant: currently employed (P = 0.01), pregnancy experience (P < 0.001), education level (P = 0.02) and subjective self-reported heath status. The percentage of responses involving activity limitations was higher in urinary incontinence group than in the control group (P = 0.009). Of the chronic diseases, only depression was statistically significant (P < 0.001). The following parameters were not statistically significant: at-risk drinking, smoking status, spouse or not, income level, regular exercise, hormone replacement, and chronic diseases including stroke, diabetes, arthritis, and osteoporosis (Table 2).
3. Appendicular Skeletal Muscle Mass and Urinary Incontinence
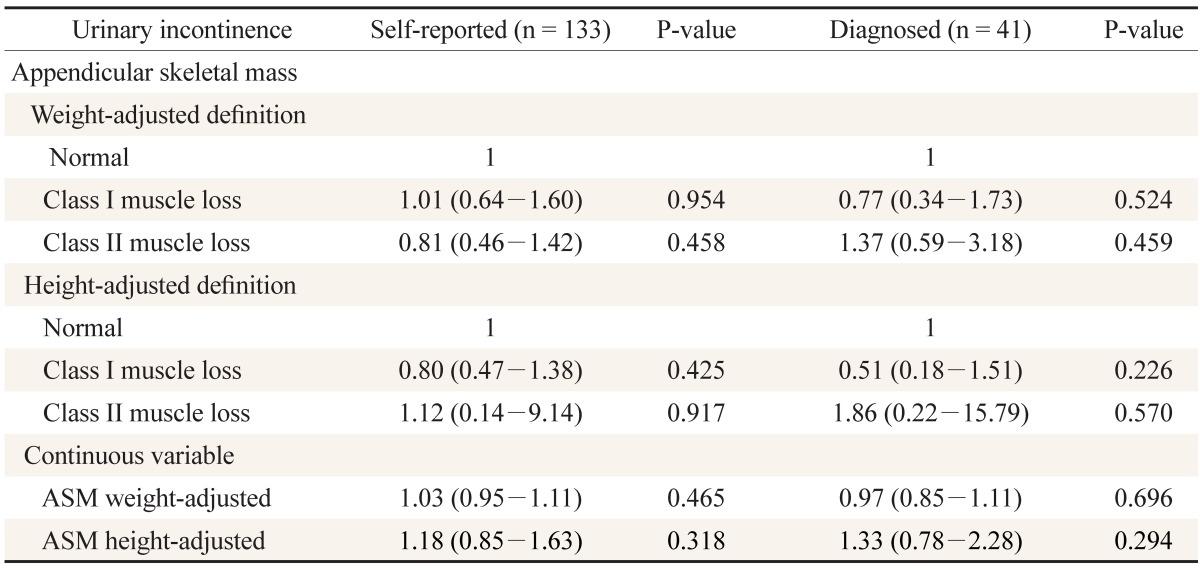
Both WAML and HAML were not associated with urinary incontinence in the 133 self-reported urinary incontinence participants. Those with WAML class I had an adjusted OR (aOR) of 1.01 and 95% CI of 0.64 to 1.60, while those with class IIa had an aOR of 0.81 and 95% CI of 0.46 to 1.42. Those with HAML class I had an aOR of 0.80 and 95% CI of 0.47 to 1.38, while those with class II had an aOR of 1.12 and 95% CI of 0.14 to 9.14. The 41 participants diagnosed with urinary incontinence by a doctor had similar results. Those with WAML class I had an aOR of 0.77 and 95% CI of 0.34 to 1.73, while those with class II had an aOR of 1.37 and 95% CI of 0.59 to 3.18. Those with HAML class I had an aOR of 0.51 and 95% CI of 0.18 to 1.51, while those with class II had an aOR of 1.86 and 95% CI of 0.22 to 15.79. The differences were not statistically significant (Table 3).
4. Truncal and Total Muscle Mass and Urinary Incontinence
Truncal and total muscle mass were classified into quartiles after adjustment for height and weight. On the basis of self-reported urinary incontinence, weight-adjusted truncal muscle loss showed no association with urinary incontinence (P for trend = 0.981) and similar results were observed for height-adjusted truncal muscle loss (P for trend = 0.412). Similar results were observed for weight-adjusted truncal muscle loss (P for trend = 0.757) and height-adjusted trunk muscle loss (P for trend = 0.225) in participants with doctor-diagnosed urinary incontinence. In addition, our study found no association between urinary incontinence and WAML or HAML (Table 4).
DISCUSSION
This study has important meaning because it is the first domestic or international examination of the association between appendicular skeletal, truncal, and total muscle mass and urinary incontinence. According to recent studies, >30% of patients with urinary incontinence are not diagnosed by doctors because they do not undergo a medical checkup even though urinary incontinence symptoms affect their quality of life.23) Therefore, we assumed that more individuals have urinary incontinence symptoms than the number diagnosed by doctors and analyzed two different groups: those diagnosed by doctors and those with urinary incontinence symptoms but no diagnosis (self-reported).
Results of multivariate analysis adjusted for confounding variables related with urinary incontinence showed no definite relationship between height- and weight-adjusted appendicular skeletal, truncal, or total muscle mass and urinary incontinence and no statistically significant difference in values.
First, since we could not control the dependent variable (urinary incontinence), the results showed no relationship between muscle mass and urinary incontinence. The EPINCONT (Epidemiology of Incontinence in the County of Nord-Trondelag) study of women in Norway showed that 50% of urinary incontinence patients had stress incontinence, 36% had mixed incontinence, and 11% had urge incontinence.24) The rate of stress incontinence changed by age. The rate of urge incontinence increased and mixed urinary incontinence was more prevalent than stress urinary incontinence in those elderly patients.25) Pelvic floor or urethral sphincter muscle weakness causes stress urinary incontinence, while the main cause of urge incontinence is bladder dysfunction.26) We could not investigate urinary incontinence types in this study. Therefore, we cannot exclude the possibility of these results of muscle mass loss because there is little influence of muscle weakness on urge or mixed incontinence in elderly women, although aging influences all types of urinary incontinence.
Second, this study used a variety of methods to measure muscle mass loss due to no standardized diagnostic criteria for it. However, we could not find a relationship between appendicular skeletal muscle mass and urinary incontinence. Additionally, we analyzed the relationship between urinary incontinence and truncal muscle mass, including pelvic muscles related to urinary incontinence, but obtained the same results.
Third, this study used simple muscle mass factors without evaluating muscle strength or physical performance in the KNHNES IV. According to previous research about the relationship between comorbidity or mortality and muscle mass or muscle strength, decreased muscle strength is the more important risk factor predicting physical disease and death.18,27) Considering that muscle strength is the most important risk factor even after adjustment for muscle mass, it will be necessary to carefully interpret our findings of muscle mass loss only without information about muscle strength. Stav et al.16) reported on the characteristics of the pelvic structures of patients with urinary incontinence and found that their pelvic muscle masses were significantly lower, which affects the pathogenesis of urinary incontinence regardless of type. Therefore, this study might be important despite its lack of significant results.
Fourth, BMI is the single independent risk factor of urinary incontinence; even after controlling for relevant variables, it influences urinary incontinence incidence and severity.20,28,29,30) However, it is already known that BMI is not a reliable indicator of obesity in the elderly.27) Previous studies used body fat mass and abdominal circumference rather than BMI to define obesity. Therefore, we did additional analyses of total body fat mass and abdominal circumference and used BMI cutoff values of 27.5 and 23 but found no significant differences in the results.
Finally, this study had a small sample size. Of the 1,131 participants, only 41 were diagnosed with urinary incontinence by a doctor. Therefore, our data will likely fail to sufficiently reflect the characteristics of the general population and may have limited usefulness on statistical analysis.
In conclusion, urinary incontinence is not significantly associated with muscle mass loss. Further research is required to confirm the associations observed in this study. Studies examining the relevance of muscle mass loss by urinary incontinence type are necessary, as are those that focus on explaining the relationship between musculoskeletal conditions and urinary incontinence by considering muscle strength and physical performance as well as muscle mass loss.


