Discrepancy between Self-Reported and Urine-Cotinine Verified Smoking Status among Korean Male Adults: Analysis of Health Check-Up Data from a Single Private Hospital
Article information
Abstract
Background
Enquiry into smoking status and recommendations for smoking cessation is an essential preventive service. However, there are few studies comparing self-reported (SR) and cotinine-verified (CV) smoking statuses, using medical check-up data. The rates of discrepancy and under-reporting are unknown.
Methods
We performed a cross-sectional study using health examination data from Healthcare System Gangnam Center, Seoul National University Hospital in 2013. We analyzed SR and CV smoking statuses and discrepancies between the two in relation to sociodemographic variables. We also attempted to ascertain the factors associated with a discrepant smoking status among current smokers.
Results
In the sample of 3,477 men, CV smoking rate was 11.1% higher than the SR rate. About 1 in 3 participants either omitted the smoking questionnaire or gave a false reply. The ratio of CV to SR smoking rates was 1.49 (95% confidence interval [CI], 1.38–1.61). After adjusting for confounding factors, older adults (≥60 years) showed an increased adjusted odds ratio (aOR) for discrepancy between SR and CV when compared to those in their twenties and thirties (aOR, 5.43; 95% CI, 2.69–10.96). Educational levels of high school graduation or lower (aOR, 2.33; 95% CI, 1.36–4.01), repeated health check-ups (aOR, 1.45; 95% CI, 1.03–2.06), and low cotinine levels of <500 ng/mL (aOR, 2.03; 95% CI, 1.33–3.09), were also associated with discordance between SR and CV smoking status.
Conclusion
Omissions and false responses impede the accurate assessment of smoking status in health check-up participants. In order to improve accuracy, it is suggested that researcher pay attention to participants with greater discrepancy between SR and CV smoking status, and formulate interventions to improve response rates.
INTRODUCTION
Cigarette smoking is a leading risk factor for cancer, cardiovascular, and pulmonary disorders. It is also one of the most important reversible risk factors ensuring their prevention.1) It has hence been highly recommended, with a high level of evidence, that primary physicians enquire about patients' smoking statuses and recommend cessation of smoking during every medical consultation.2) Reliable information regarding smoking status is necessary to provide appropriate medical advice regarding the health check-up results and to plan follow-up visits and examinations including low dose computer tomography. This has particular significance in Korea where more than 70% of adults (≥40 years old) undergo regular health screening.3)
Self-reported (SR) smoking status is generally considered reliable. However, a few studies have demonstrated that smoking tends to be minimized in self-reports as compared to counter-verification with biological markers, in populations that are pressurized to abstain from cigarette smoking for medical or social reasons, such as pregnant women,4) teenagers,5) those undergoing treatment for smoking cessation,6) and those with pulmonary diorders.7) Many female smokers hide or underreport smoking status according to the Korea National Health and Nutrition Examination Survey (KNHANES).8) KNHANES had a non-response rate of less than 1%,9) since the response was checked by examiners during face-to-face interviews. However, in surveys during general health check-up programs, participants complete the questionnaires by themselves, and the responses are not reviewed until the day of consultation. To the extent of our knowledge, no study has compared the rates of SR and cotinine-verified (CV) smoking using private health check-up data. Although the data is from a single private healthcare center, the questions regarding smoking status were identical to KNHANES; thus, we could also compare the face-to-face interview method employed in KNHANES with the unsupervised self-reporting methods used in private health check-up programs.
Through this study, we verified the rate of non-response to questions on smoking status using urinary cotinine, a metabolite of nicotine. The study also planned to evaluate the difference between SR and CV smoking rates and explore factors related to these differences if any.
METHODS
1. Subjects
The study sample included 3,581 males aged 19 years and above who underwent health check-ups at a private healthcare center in Seoul between January 2, 2013 and December 31, 2013. After excluding those with missing values, 3,477 were eventually taken up for the analyses. All participants provided written informed consent, and the study protocol was ethically approved by the institutional review board of the Seoul National University Hospital (IRB no. 1506-101-681).
2. Operational Definitions and Measurements of Variables
1) Self-answered questionnaire
The questionnaires were mailed to the participants one week ahead of the appointed date for check-up, and they were asked to complete it prior to the check-up. On the day of check-up, administrative attendants verified that the questionnaire was completed, and asked to complete the questionnaire during the check-up program in case of defaulters. The answers in the survey sheet were recorded through an optical character recognition system. The questionnaire assessed the following variables.
(1) Smoking status
We used the question, "Have you smoked more than 5 packs of cigarettes (equals to 100 cigarettes) in your life time?" Based on their answers—(1) no; (2) yes, but have quit now; and (3) yes, currently smoking— participants were categorized into three groups. Non-smokers were defined as individuals who had never smoked or had smoked less than 100 cigarettes in their lifetime. Past smokers were defined as individuals who had smoked more than 100 cigarettes and had quit smoking at the time of answering the questionnaire. Current smokers were defined as individuals who had smoked more than 100 cigarettes and were continuing to smoke at the time of answering the questionnaire.
(2) Sociodemographic factors and life style
We considered the following as sociodemographic factors: (1) age, (2) educational level (high school graduates, college/university graduates, and graduation school graduates), (3) marital status (married, separated, un-married, and divorced/bereaved), and (4) monthly household income (<5,000,000 won, ≥5,000,000 won and <10,000,000 won, ≥10,000,000 won and <20,000,000 won, and ≥20,000,000 won). Alcohol consumption habits and physical exercise pattern were included as lifestyle factors. Based on alcohol consumption habits, participants were categorized into the risky drinking group (≥5 drinks at a time) and the non-risky drinking group (<5 drinks at a time). Those who regularly participated in moderate intensity exercise for greater than 150 minutes per week were categorized as exercise group, while others were placed in the non-exercise group. The short form of International Physical Activity Questionnaire10) was used for assessment.
2) Number of check-ups
This indicated the number of times a participant repeated the health check-up at the same healthcare center from 2003 to 2013.
3) Anthropometric values
We computed the body mass index (BMI, kg/m2) from height and weight, measured after at least 12 hours of fasting while wearing a light gown. Cut-off values for obesity were defined as per the Asia-Pacific Standards by the World Health Organization, according to which BMI <18.5 was defined as 'low body weight,' ≥18.5 and <25.0 as 'normal or overweight,' and ≥25.0 as 'obese.'11)
4) Urine cotinine test
Urine samples were collected in plastic cups on the day of check-up. Urine cotinine levels were measured using Architect Ci8200 (Abbott Laboratories, Abbott Park, IL, USA), through DRI Cotinine Assay (Microgenics Co., Fremont, CA, USA) with a detection threshold of 34 ng/mL. The cut-off value of urine cotinine level to determine a positive smoking status was set at 50 ng/mL in accordance with a previous study.12)
3. Statistical Analysis
We compared SR and CV smoking rates in relation to demographic characteristics. In order to verify the inconsistency between SR versus CV rates, we computed Cohen's kappa value of SR smoking with urine cotinine level as a gold standard. We performed t-tests and chi-square tests to distinguish variables that were significantly different between the group in which SR and CV was corroborative and the group in which the two values were inconsistent (P-value<0.1). Multivariate logistic regression was performed using these variables to identify the ones that were associated with inconsistency between SR and CV rates. We used STATA ver. 13.1 for statistical analysis (Stata Co., College Station, TX, USA). A P-value of <0.05 was considered statistically significant.
RESULTS
1. Characteristics of Participants
Characteristics of participants are described in Table 1. Out of the total 3,477 participants, 218 (6.3%) were less than 40 years of age, 2,399 (69.0%) were aged 40–59 years, and 860 (24.7%) were 60 years or older. Thirty-two (0.9%) were underweight, 2,069 (60.0%) were normal or overweight, and 1,349 (39.1%) were obese. Those who underwent check-up more than once numbered 2,502 (72.0%). Majority of the participants had educational level higher than college/university graduates (85.0%), were married and living with their spouses (90.0%), and had household incomes greater than 5,000,000 won (90.0%). Non-response rate to questions on smoking status, including multiple answers to the question (n=37), was 26.4% (n=917), which was greater than non-response rate to other questions. Non-response rates to questions regarding alcohol consumption and physical exercise were 7.7% (n=269) and 24.1% (n=838) respectively. Non-response rate to the other questions (educational level, marital status, and monthly household income) were less than 5.0%.

General characteristics and smoking status of participants (n=3,477)
2. Discrepancy between Self-Reported versus Urine Cotinine-Verified Smoking Rate
A comparison of SR and urine CV smoking status is presented in Table 2. SR smoking rate was 22.5% in the total sample and 30.5% after excluding non-respondents. CV smoking rate among non-respondents (39.1%) was higher than in the total sample (33.8%). A small portion, 5.2% of professed past smokers, and 2.6% of professed non-smokers also tested positive for urine cotinine.
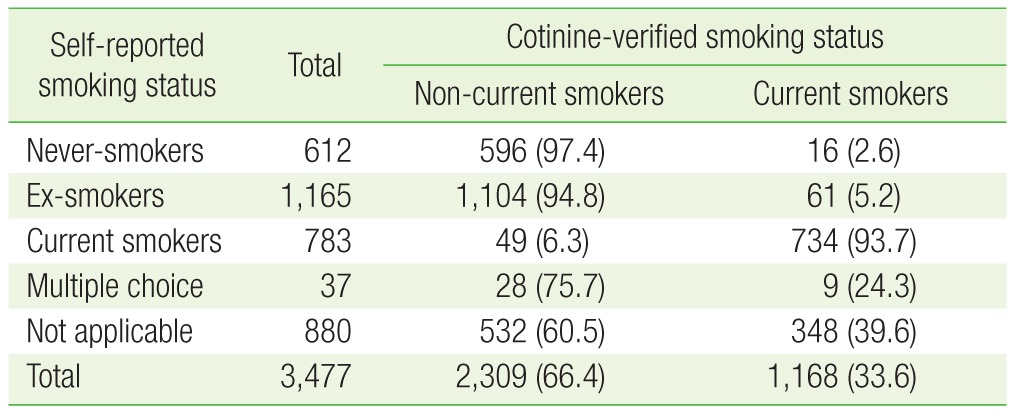
Comparison of self-reported smoking status with cotinine-verified status
We analyzed the differences between CV and SR, and the ratios of CV to SR relative to study variables (Table 3). CV smoking rate was 11.1% higher than SR smoking rate (95% CI, 9.0–13.2), and the ratio of CV to SR rate was 1.49 (95% CI, 1.38–1.61). When non-respondents were excluded, the difference decreased to 1.1% (95% CI, 1.38–1.61), and ratio to 1.04 (95% CI, 0.95–1.12) (data not shown). The ratio of CV to SR tended to be greater in the groups with older age, lower educational level, low household income, and multiple visits to the health care center. The kappa coefficient was 0.89 (P-value<0.001) in the sample of 2,560 participants after excluding non-respondents. Their inclusion reduced the kappa coefficient to 0.66 (P-value<0.001).
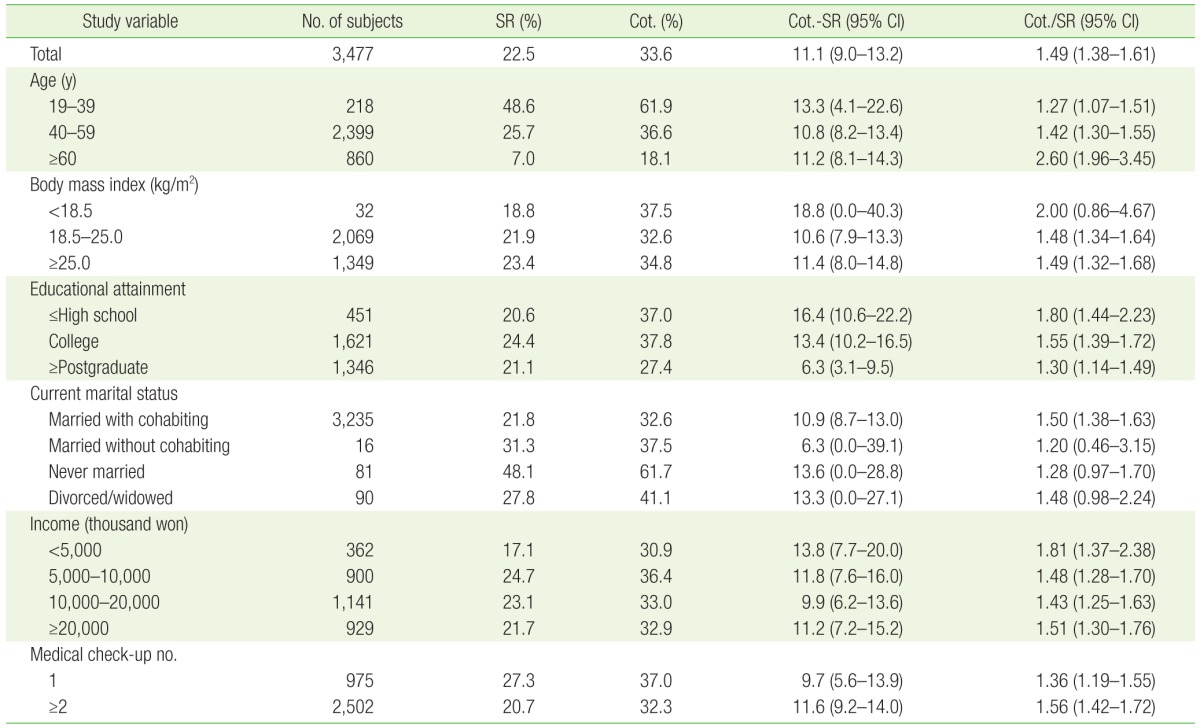
Percentage differences and ratios of SR and Cot. smokers relative to study variables
3. Factors Associated with Discrepancy between Self-Reported and Cotinine-Verified Smoking Rates
We analyzed variables for association with consistency between SR and CV rates using multivariate logistic regression (Table 4). Age, educational level, marital status, household income, number of health check-ups received, physical exercise, and alcohol consumption habits were found to have statistically significant associations. Participants older than 60 years were 5.43 times more likely than those younger than 40 years to show discrepancy between SR and CV rates (adjusted odds ratio [aOR], 5.43; 95% CI, 2.69–10.96). Subjects who visited the center for the first time had aOR of 1.45 in regard to subjects who had visited the center before (95% CI, 1.03–2.06). Those with urine cotinine levels ≥1,500 ng/mL were less likely to have SR-CV discrepancy than those with levels <500 ng/mL with an aOR of 2.03. Those with educational levels of high school graduation or lower were 2.3 times more likely to show discrepancy between SR and CV rates compared to graduates from graduation school (aOR, 2.33; 95% CI, 1.36–4.01). Analyses after excluding non-respondents showed that those with urine cotinine <500 ng/mL had greater discrepancy between SR and CV rates compared to the group with urine cotinine ≥1,500 ng/mL. Age, educational level, and number of check-ups did not show significant correlation when non-respondents were excluded from analyses.
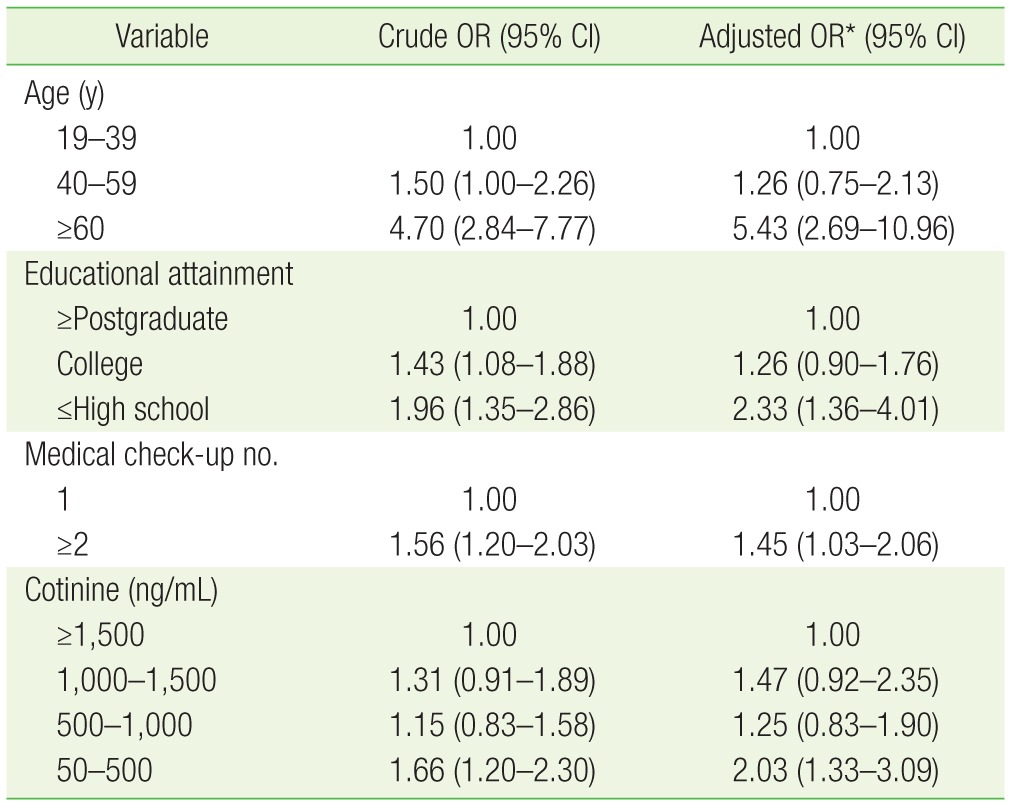
Factors associated with discordance between self-reported smoking status with cotinine-verified status among current smokers
DISCUSSION
In this study, we found that biologically verified smoking rates were 11.3% higher than SR smoking rates, and 33.0% of male smokers had either falsely reported or not reported their smoking status. Analyses showed that age older than 60 years, educational level of high school graduation or lower, multiple health check-ups, and urine cotinine levels <500 ng/mL were associated with discrepancy between SR and CV rates.
Non-respondents included those who did not participate in the survey at all (survey non-respondents), and those who had not answered specific questions in the questionnaire (item non-respondents). In our study, survey non-respondents were excluded prior to analyses. In KNHANES, item non-response rate regarding smoking status was small enough to ensure exclusion during analyses without significantly affecting results.813) However, in our study the item non-response rate to smoking status was too high (26.4%) to be ignored. Although non-respondents can be considered as non-smokers in actual clinical settings, we had to maintain the category of non-respondents so that they are not assumed to be non-smokers in view of their relatively high proportion in the sample.
Previous studies have shown that individuals with older ages and lower educational levels tend to report their smoking status inaccurately.1415) According to a KNHANES study, older ages correlated with lower consistency between SR and CV rates, similar to our findings. However, educational level which did not show any correlation in KNHANES13) showed significance in our study. The relationship between the number of check-ups and discrepancy in smoking rates is unknown. In our study, subjects who participated in health check-up multiple times had 50.0% greater discrepancy compared to those with first visits. We could postulate that participants tend to get disinterested while answering the same survey questions when the check-ups are repeated. There was no dose-dependent increase in discrepancy with increase in the number of check-ups. In previous studies using KNHANES data, the false response rate in smokers was found to be 33.6% in individuals with urine cotinine <500 ng/mL and 1.9% in individuals with urine cotinine ≥1,500 ng/mL,8) which is also consistent with our study.
Individuals who smoke only a small amount of cigarettes and those undergoing treatment for smoking cessation, may hide or underreport their smoking status. Urine cotinine levels and daily nicotine consumption vary across individuals. However, average daily cigarette consumption in a single individual tends to be consistent, and urine cotinine level correlates with the degree of nicotine absorption.12)
Discrepancy between SR and CV could be explained as follows. It can be considered as a reporting error secondary to a tendency to deny smoking status. Participants are prone to respond in a manner that is compatible with the societal expectations of being healthy and desirable.1617) Face-to-face interviews have been shown to be related to underreporting in smoking.1618) Paper surveys on the other hand, are deemed more accurate19) probably owing to the sense of anonymity that it provides.
Additionally, the verbatim question as to whether the participant has 'smoked more than 100 cigarettes in their life time,' tends to invite a negative response as compared to a question that asks whether the participants have smoked within the previous month.20) If smoking status is defined based on the number of cigarettes smoked during the life time of the individual, then, transient smokers, light smokers, and people who have just begun to smoke would be excluded. The survey questionnaire used in the health check-up program provided by the National Health Insurance Services (NHIS) also asks if participants had smoked more than 100 cigarettes during their life time.21) This suggests that the non-response rates shown in our study could be reproduced in the NHIS health check-up program as well.
The urine cotinine cut-off value could also influence the result. Cotinine, a metabolite of nicotine, has half-life of 18 hours, which is longer than that of nicotine. Cotinine has high specificity and sensitivity to detect smoking status. Unless a participant is under nicotine replacement therapy, cotinine is a valuable marker for verifying smoking status. 1222) While 50 ng/mL is the most widespread cut-off value used in studies,12) the use of 100 ng/mL also provided the same results in Koreans.8) A few participants whose urine cotinine was lower than 50 ng/mL reported they were currently smoking. Since the half-life of cotinine is about 18 hours,22) it may not be detected in those who do not smoke every day12) or in those attempting cessation of smoking. Urine cotinine would also be negative if a smoking participant answered the survey questionnaire a week prior to the check-up, and quit smoking after answering the questionnaire.
The limitations of this study include the following. Urine cotinine levels can also be elevated in nicotine replacement therapy, electronic cigarettes, and indirect smoking.12) Our study may have had a selection bias owing to relatively higher levels of education and household incomes in the sample. The participants were limited to males older than 18 years; hence, the results cannot be generalized sex differences could not be evaluated.
This is the first study that used health check-up data from a private healthcare center to verify the difference between SR smoking rate and urine cotinine level. Also, we identified, for the first time, that the number of health check-ups was a factor influencing discrepancy in smoking reports.
To conclude, omissions and false replies impede the accurate assessment of smoking status in health check-up participants. In order to improve accuracy, it is suggested that researcher pay attention to participants with greater discrepancy between SR and CV smoking status, and formulate interventions to improve response rates. Further studies are needed to investigate the differences based on age and sex, and to develop methods to manage non-response during health check-up surveys.
Notes
CONFLICT OF INTEREST: No potential conflict of interest relevant to this article was reported.