INTRODUCTION
Vitamin D is involved in the absorption and distribution of calcium, and the correlation between vitamin D and bone health has been proven through numerous studies.1) In 2006, vitamin D deficiency was found in 92.1% of Korean women, which is the highest prevalence rate worldwide.2) According to the Korea National Health and Nutrition Examination Survey (KNHANES) in 2008, the average blood vitamin D levels was 21.2 ng/mL for males and 18.2 ng/mL for females, which were below the normal vitamin D level of 30 ng/mL. Also, the average vitamin D level in those aged 20–59 was lower than that for ages 50–79, which is presumed to be caused by a decrease in sun exposure for young and middle-aged adults.3) Vitamin D dietary supplementation is recommended worldwide; in 2011, the Institute of Medicine recommended 600 IU/d for adults over 19 years of age, and 800 IU/d for those over 70 years of age.4) There have been many studies on the correlation between chronic diseases and vitamin D, and groups with serum levels over 30 ng/mL or with vitamin D consumption beyond the recommended minimum displayed lower prevalence rates of cancers, autoimmune diseases, osteoarthritis, diabetes, and cardiovascular diseases than groups with levels less than 30 ng/mL or with insufficient intake.5,6,7)
As the relationship between vitamin D and various diseases or health conditions has become known, interest in the contribution of vitamin D to overall health-related quality of life has increased. A study in Canada examined the correlation between vitamin D and health-related quality of life (HRQOL) in those over 70 years of age, and reported that vitamin D level was partially associated with HRQOL.8) A study performed in the USA by including war veterans who supplemented vitamin D showed improvements in pain, quality of sleep, and quality of life.9) The KNHANES showed that vitamin D level and average daily sleep hours were related,10) and a study on Korean women over 60 showed that vitamin D level was an independent risk factor for depression.11) However, no studies have directly considered vitamin D and overall HRQOL. Therefore, this study examined the correlation between vitamin D level and HRQOL in adults.
METHODS
1. Subjects
This was a cross-sectional study. Of 45,811 participants in the KNHANES from 2007–2012, a total of 17,183 participants aged 20–50 were initially selected, excluding 28,628 participants below 19 or over 50 years; of these, 14,104 were selected as the final study subjects by excluding 3,079 participants with missing values for variables such as quality of life survey, vitamin D level, body mass index (BMI), or history of alcohol consumption (Figure 1).
2. Measurement of Vitamin D
Serum 25-hydroxyvitamin D level was measured as ng/mL, using the 1470 WIZARD gamma-Counter (PerkinElmer, Turku, Finland); for radioimmunoassay, the 25-hydroxyvitamin D 125I RIAKit (DiaSorin, Stillwater, MN, USA) was used. Clinically, vitamin D level below 20 ng/mL is considered deficiency, 20–29 ng/mL is insufficiency, and over 30 ng/mL is sufficiency.12) In the subject group, 9.8% had a level less than 10 ng/mL, while only 5.6% had over 30 ng/mL. Therefore, the vitamin D level intervals were set at 0–9.99, 10–19, 20–29.99, and ≥30 ng/mL in this study.
3. Health-Related Quality of Life Evaluation
The HRQOL survey used in the 2007–2012 KNHANES was the EuroQol-5 dimension (EQ-5D), which consists of 5 components asking about current health status. These include mobility, self-care, usual activities, pain/discomfort, and anxiety/depression, for which the respondent is to select one of 3 choices: "no problem," "moderate problem," or "extreme problem." Combinations of these problems result in 243 different health conditions. The EQ-5D index score is calculated as a weighted index value from 1, completely healthy, to -0.171, which is the lowest score.13) Since there is no reference point defining a poor quality of life, the lowest quintile of the EQ-5D index score was arbitrarily set as the reference point in defining a poor quality of life. For the 5 HRQOL items, "moderate problem" and "extreme problem" were combined as "problem exists."
4. Other Factors
In addition to a health survey and a health knowledge and behavior survey, age, gender, income level, education level, marital status, alcohol consumption, and smoking were also evaluated. Age groups were divided into 20–29, 30–39, and 40–49 years. Income level was bisected into the bottom 25% and top 75%, and education level was divided into <6, 6–8, 9–12, and ≥12 years. Marital status consisted of single, married, divorced (or separated), or widowed; smoking consisted of current smoker, past smoker, and nonsmoker; and alcohol consumption consisted of frequency of less than once a month, 1–4 times a month, and more than 5 times a month. BMI was divided into 0–22.9, 23–24.9, and ≥25 kg/m2. Lastly, subjects were questioned for diseases including hypertension, osteoarthritis or rheumatoid arthritis, asthma, diabetes, and depression.
5. Statistical Analysis
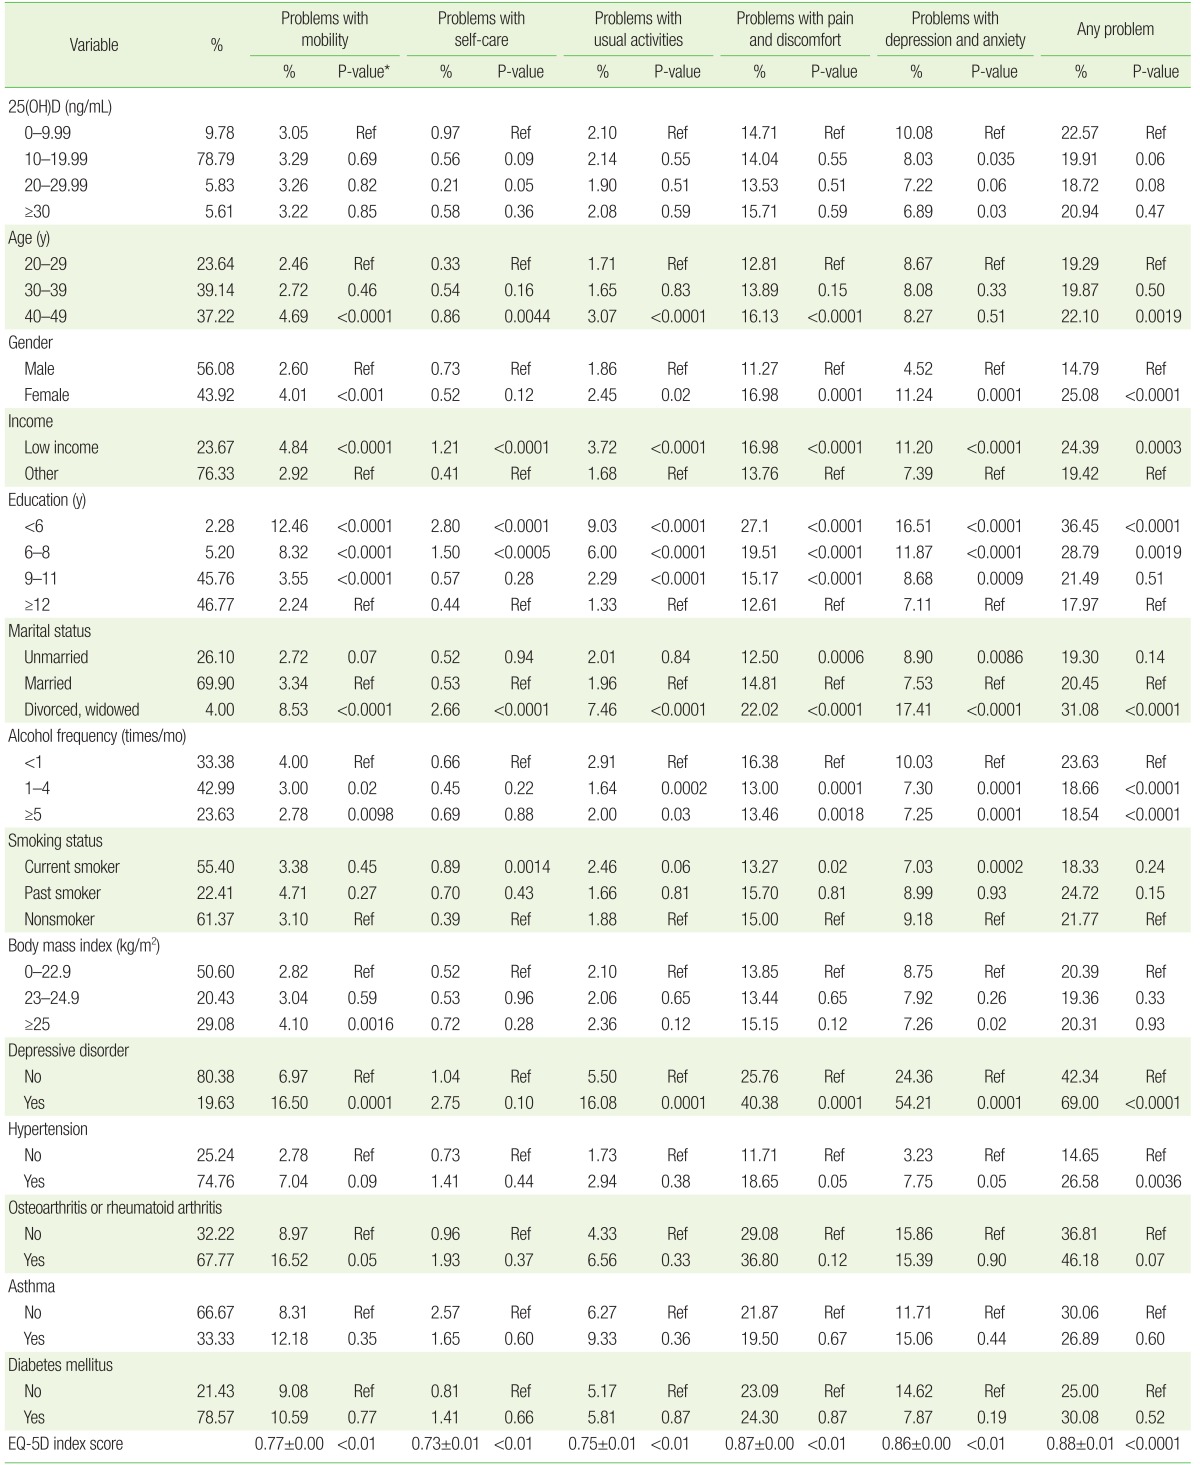
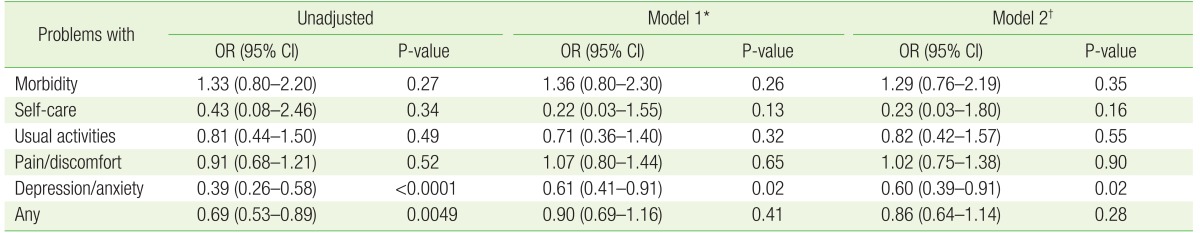
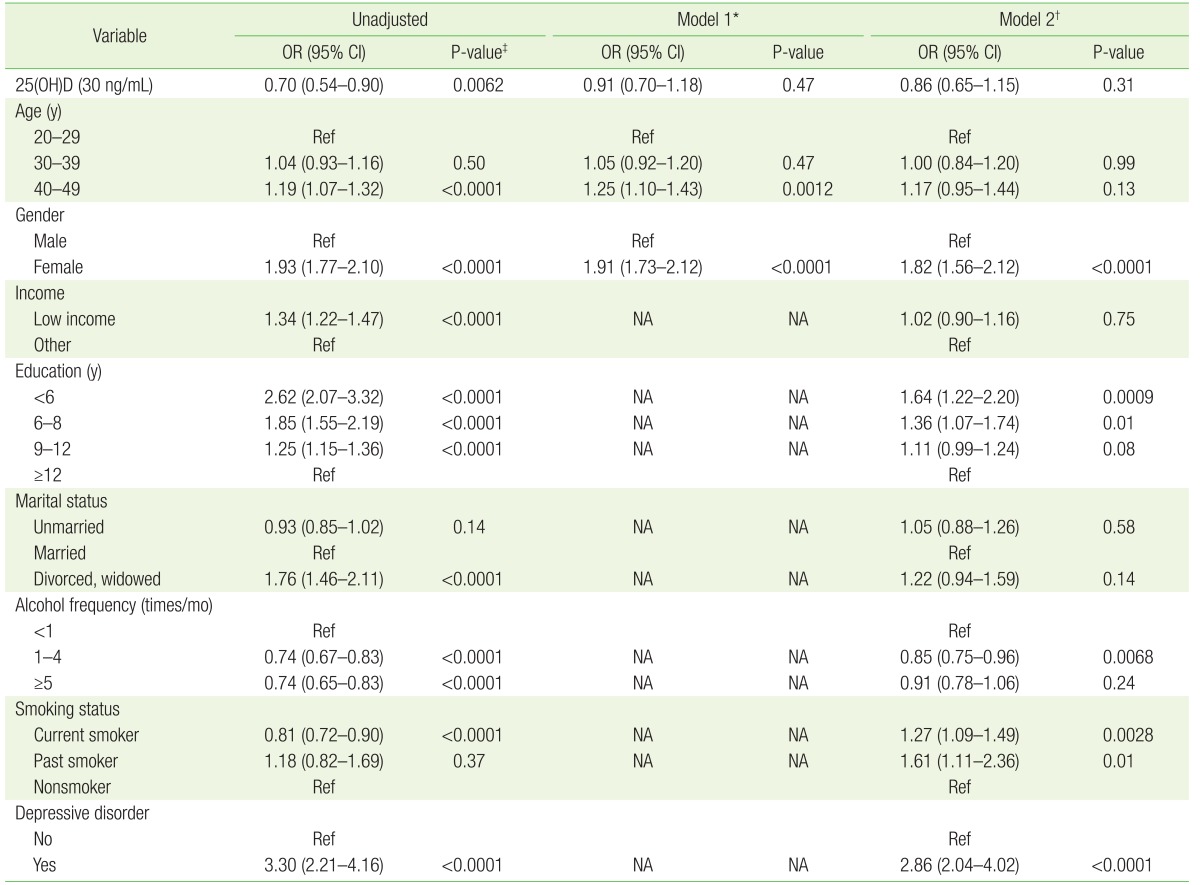
Table 1 shows the prevalence of 5 problems in the HRQOL survey based on vitamin D level category and subject age, gender, income level, education level, marital status, alcohol consumption, and smoking status, and diseases including hypertension, osteoarthritis or rheumatoid arthritis, asthma, diabetes, and depression. The study on the difference between vitamin D level category and prevalence in the HRQOL was conducted by simple regression analysis. Table 2 shows the relevance of 5 qualities of life based on vitamin D level and health-related problem status, by using simple and multiple regression analysis. Table 3 shows simple regression analysis and multiple regression analysis for other factors (age, gender, income level, education level, marital status, alcohol consumption, smoking status, and depression) relevant to decline in quality of life. All results were considered statistically significant at a P-value <0.05.
All statistical analyses were performed using SAS ver. 9.2 (SAS Institute Inc., Cary, NC, USA). Statistical analysis of the survey was performed using weighted values according to the guidelines of the Korea Centers for Disease Control and Prevention for the raw data of the KNHANES.
RESULTS
The average serum vitamin D level for all subjects was 16.94 ng/mL, ranging from 2.95 ng/mL to 58.66 ng/mL. In subjects with vitamin D levels of <10 ng/mL, the weight ratio (number) was 9.78% (1,379), that of subjects 10–20 ng/mL was 78.79% (11,112), that of subjects 20–30 ng/mL was 5.83% (822), and that of subjects over 30 ng/mL was 5.61% (791) (Table 1). Table 1 shows the prevalence of each EQ-5D item based on vitamin D level interval and the prevalence of any problem. As the vitamin D level interval increased, depression/anxiety significantly decreased. Table 1 also displays the relevance to age, gender, income level, education level, marital status, alcohol consumption, and smoking status, and diseases including hypertension, osteoarthritis or rheumatoid arthritis, asthma, diabetes, depression, and HRQOL. Subjects in their 20s displayed increased prevalence of 4 out of 5 quality of life indicators compared with subjects in their 40s. Prevalence significantly changed in 3 out of 5 EQ-5D problems based on gender, income level, education level, marital status, alcohol consumption frequency, smoking status, and depression. The average EQ-5D index score for the prevalence of any problem was 0.88±0.01.
Table 2 shows the relevance of vitamin D level and 5 problems of the EQ-5D before and after adjustment. Adjustments were made for age and gender first, and were compared with the adjustment results including other variables (age, gender, income level, education level, marital status, alcohol consumption frequency, smoking status, and depression). Prevalence in the group with levels over 30 ng/mL did not show statistically significant differences compared with the group with less than 30 ng/mL in terms of mobility (+33%), self-care (-57%), usual activities (-19%), and pain/discomfort (-9%), and there was no statistical significance after adjustment. However, the prevalence of anxiety/depression decreased 61% before adjustment, and the decrease was statistically significant both before and after adjustment. The odds ratio for the prevalence of any problem was 0.69 (95% confidence interval [CI], 0.53–0.89), but was not statistically significant after adjustment.
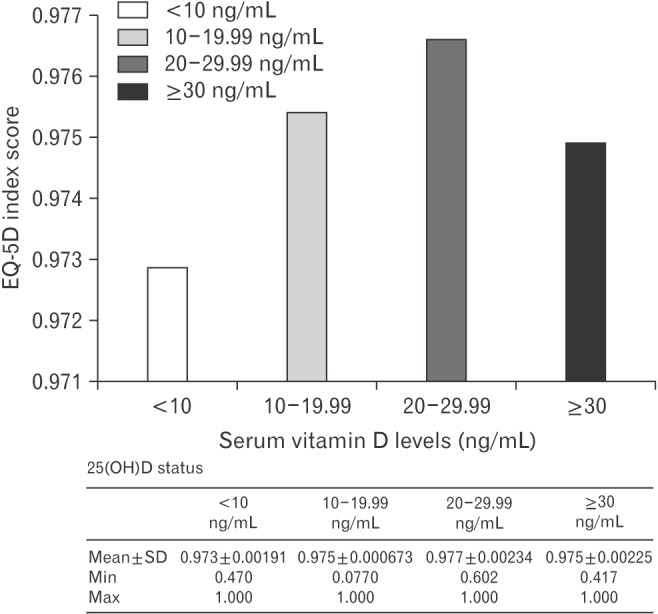
Figure 2 shows the average EQ-5D index score based on vitamin D interval as a graph, in which the EQ-5D index score did not display a tendency to increase as vitamin D level interval increased, showing no statistical significance (P=0.42).
Table 3 shows the odds ratio of the EQ-5D score index of the lowest quintile based on variables including vitamin D, age, gender, income level, education level, marital status, alcohol consumption frequency, smoking, and existence of depression. Based on an odds ratio of 1, the odds ratio of the group with levels ≥30 ng/mL was significantly lower than prior to adjustment, but was not significant after adjustment. The group over 40 years of age displayed a higher odds ratio of 1.25 (95% CI, 1.10–1.43) than the group over 20 after adjustments in age and gender (P=0.0012). The odds ratio of women before and after adjustment was 1.82 (95% CI, 1.56–2.12), and was higher than that of men (P<0.0001). In terms of education level, the odds ratio after adjustment was higher in the group with less than 6 years of education than the group with 12 years or more (1.64; 95% CI, 1.22–2.20; P=0.0009). Alcohol consumption frequency 1–4 times/mo displayed a lower odds ratio than frequency less than once/month (0.85; 95% CI, 0.75–0.96; P=0.0068). Smokers displayed a higher odds ratio than nonsmokers (1.27; 95% CI, 1.09–1.49; P=0.0028), and the non-depression group displayed a higher odds ratio than the depression group after adjustment (2.86; 95% CI, 2.04–4.02; P<0.0001).
DISCUSSION
Numerous studies have shown that groups with increased vitamin D levels or consumption had increased muscular strength and a decrease in fall risk compared with the group without vitamin D supplementation.5,14,15,16,17,18,19) In other words, decreased vitamin D level may be related to increased prevalence of mobility, self-care, and usual activity deficits related to muscular strength. Studies have shown that low vitamin D level increases sensitivity to pain,20) and that moderate vitamin D level reduces osteoarthritis knee pain in middle-aged women.21) Thus, it can be predicted that lower vitamin D levels lead to an increase in pain/discomfort prevalence. Decreased vitamin D levels during pregnancy also led to increased prevalence of postpartum depression,22) and a meta-analysis of studies from 2008–2013 on the relationship between vitamin D deficiency and depression in seniors confirmed a significant association between vitamin D decline and increased prevalence of depression in 6 out of 10 studies.23)
Recently, a study in Korea compared vitamin D levels and HRQOL in osteoarthritis patients over 50 years of age, and the ratio of the EQ-5D index score of the lowest quartile was higher in the vitamin D-deficient group (<10 ng/mL) than the normal group (≥10 ng/mL), but there was no significant difference in the prevalence of pain/discomfort and depression/anxiety based on vitamin D level.24) In our study, the increase in prevalence was significant for depression/anxiety alone, which is presumably because the reference point for the normal vitamin D group was different and age over 50 was a confounding factor that influenced the increase in depression/anxiety.
The results of this study did not reveal a significant relationship between vitamin D and the problems of HRQOL except for depression/anxiety. This may be because various clinical and social factors are related to the quality of life in a complex manner, making it difficult to deduce a clear correlation based simply on the measurement of vitamin D levels. This study excluded older adults and seniors (over 50), and targeted a relatively healthy age group (20–49), so there may have been little difference in mobility, self-care, usual activities, and pain/discomfort. The fact that vitamin D was measured only once and that vitamin D consumption, exposure to sun, and the amount of exposure were not taken into consideration may have affected the result as well. Moreover, vitamin D production may have decreased because of decreased sun exposure due to depression. Study of such aspects in the future would lead to more persuasive and meaningful results.
There are limitations to this study. First, this was a cross-sectional study and could not explain the causal relationship between vitamin D and quality of life. Second, although this study used the highly credible KNHANES data and obtained sufficient samples, the rate of "problem exists" responses was relatively lower for self-care than for other problems, and this may have interfered with accurate analysis. Moreover, although this study was performed after adjusting for age, gender, income level, education level, marital status, drinking, smoking, and presence of depression, and restricted the target to the ages of 20–49 to minimize the prevalence of chronic diseases, it did not completely eliminate confounding factors that may affect the relevance of vitamin D to HRQOL. Lastly, although the EQ-5D is a simple and easy accredited measuring tool for quality of life, it is a self-survey that is susceptible to information error.
In conclusion, the results of a cross-sectional study targeting a large Korean population showed that the correlation between vitamin D and HRQOL is either weak or nonexistent. A correlation may be revealed through future prospective studies.