INTRODUCTION
Korea is one of the nations with a rapidly aging population. Korean, as a result of the increased lifespan and the reduced birth rate, has become an aging society where people over the age of 65 have accounted for more than 7% of the population since 2000. It is anticipated that by 2026, Korea will become a ‘super-aged’ society with as much as 20% of its population comprising elderly people over the age of 65.1) The increased burden of chronic diseases, disabilities, and the economic burden of medical expenditures due to the increasing elderly population are social problems the nation has faced for a long time. Therefore, identifying ways in which the elderly can live independently while maintaining long-term health has become increasingly important.
From this perspective, there is a growing interest in the health-related quality of life (HRQoL) in the elderly. According to the World Health Organization, the HRQoL is defined as “the quality of life directly associated with health of an individual including physical, mental and social well-being.”2) As the concept of health is gradually transforming from a relief from past diseases to a concept emphasizing on an individual's ability to perform daily activities, there is a growing interest in the association between various diseases and the quality of life.
Obesity is one of the most common diseases that cause a variety of chronic diseases in the elderly. The prevalence of obesity in Korean adults, defined as a body mass index (BMI) of ≥25 kg/m2, has increased from 26.3% to 32.5% between 1998 and 2013 with the greatest increase in obesity prevalence observed in the elderly (>60 years).3,4) This mirrors the global obesity trend wherein the ‘big and weak’ elderly population is increasing gradually.5)
Obesity in the elderly can lead to chronic diseases and can affect daily life as it aggravates disease-related symptoms. Thus, it is a factor that significantly decreases the quality of life; however, Korean research in this field is lacking. A previous study using the Korean obesity-related quality of life survey (KOQoL) reported that even as the quality of life of the elderly normal-weight subjects was lower for some of the domains, the quality of life of obese subjects was low for the general adult population.6) Another study conducted on elderly subjects using the same survey reported that a higher obesity level is related to a lower quality of life.7) However, the questionnaire used in these studies has some possible limitations related to the overall quality of life as it chiefly consists of questions directly related to obesity.
Consequently, it is essential to perform further studies using a questionnaire that can evaluate physical and mental health in a broader context of the quality of life. Thus, this study was designed to investigate the association between obesity and HRQoL in the elderly Koreans using the Korean version of the Medical Outcome Study 36-Item Short-Form Health Survey (SF-36).
METHODS
1. Study Subjects
A survey was conducted among the elderly (>60 years) outpatients and inpatients of a university hospital, two senior welfare centers, and a community health center in Seoul and Chungju from March to June 2008. Subjects with dementia and psychiatric disorders were excluded from the study population. Surveyed inpatients were limited to those who were hospitalized for less than 2 weeks and had received only minor surgeries or procedures. The survey questionnaire was administered by family medicine physicians or medical students who were trained, and the participants' responses were obtained via a one-to-one interview. Disease history was defined based on previous diagnosis by a doctor. Among the responders, 35 cancer patients, 47 stroke patients, and 52 depression patients were excluded, and the final study population comprised of 542 subjects was further analyzed.
2. Variables
In addition to evaluating the quality of life, the questionnaire collected information on demographic characteristics such as age, sex, height, weight, marital status, family status, education level, monthly income, and past medical history; and lifestyle factors such as smoking, alcohol consumption, and exercise frequency. Height and weight were measured by researchers, and the study subjects were classified based on the BMI quartiles.
We used the SF-36, a tool developed by Ware and Sherbourne in 1992, to evaluate the HRQoL. The SF-36 has been translated into Korean, and has been verified for reliability and validity.8) It consists of eight subdomains including physical components (10 questions on physical functioning [PF], four questions on role limitation-physical [RP], two questions on bodily pain [BP], and five questions on general health [GH]) and mental components (four questions on vitality [VT], two questions on social functioning [SF], three questions on role limitation-emotional [RE], and five questions on mental health [MH]).9) Responses were recorded using a grading system based on the Likert scale, and all scale values were added and reported out of a total of 100 points, with a higher score indicating a better quality of life.10)
3. Statistical Analysis
The general characteristics of the study subjects were compared between sexes using a t-test, and between the BMI quartiles using a Pearson's chi-square test. The BMI quartile-based SF-36 scores were further analyzed through a regression analysis, and the results were expressed as adjusted means with 95% confidence interval. All statistical analyses were performed using Stata ver. 13.0 (Stata Corp., College Station, TX, USA), and the significance level was P-value <0.05.
RESULTS
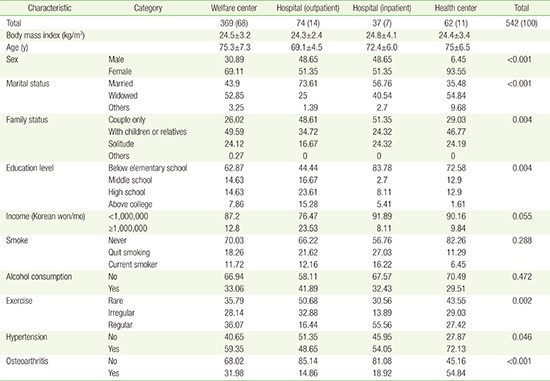
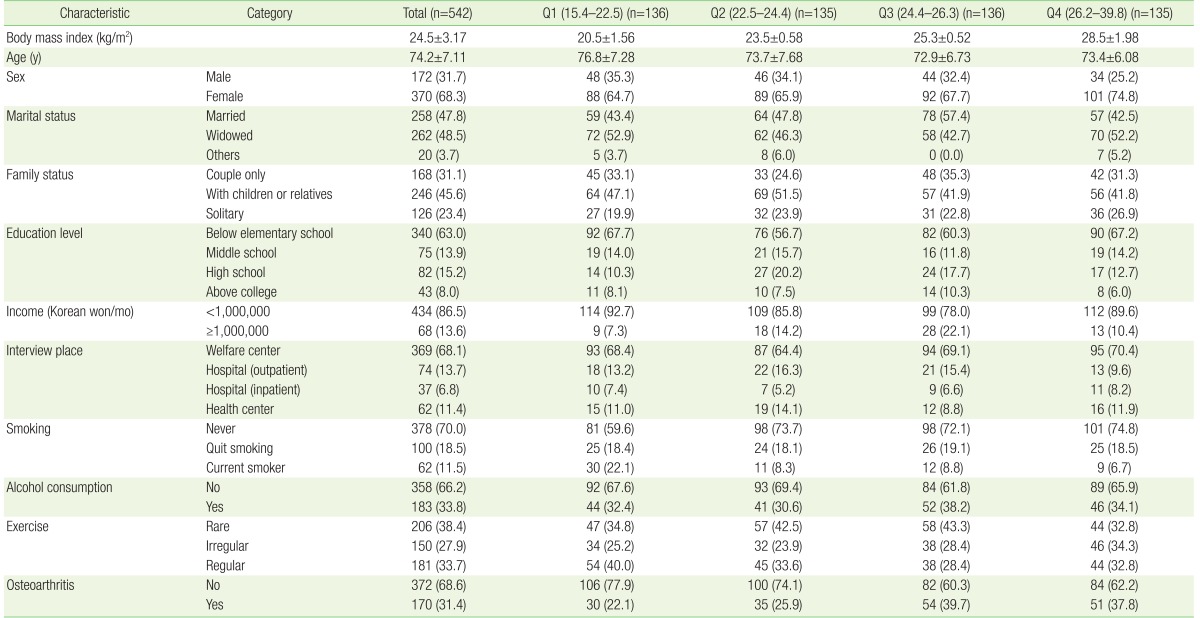
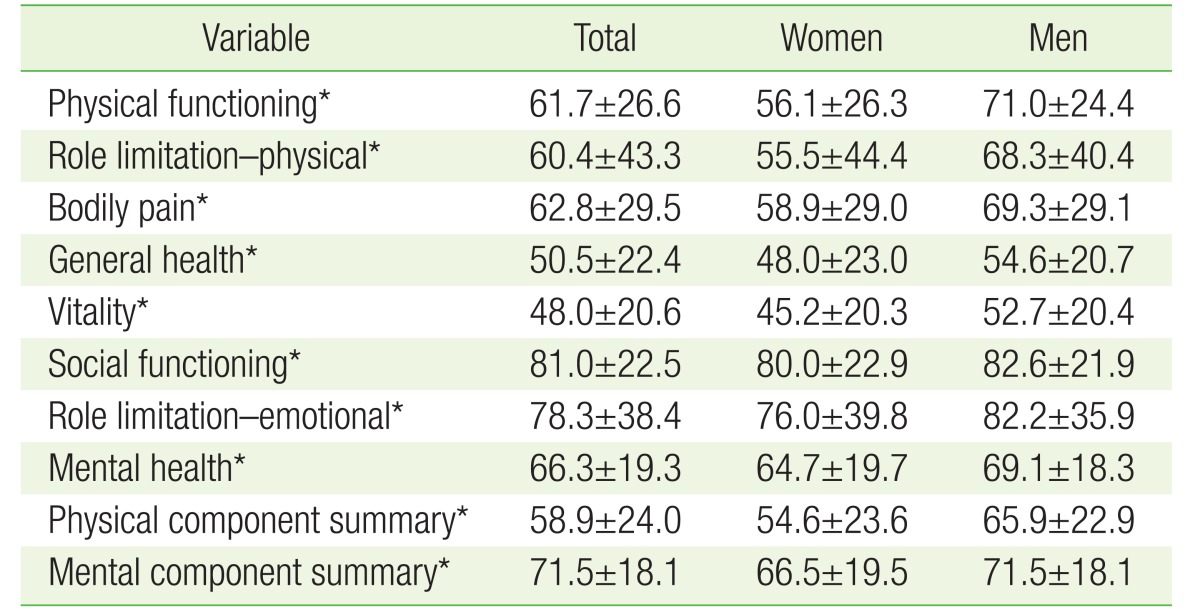
Of the 542 subjects included in the analysis, 172 were men (31.7%) and 370 were women (68.3%). The mean age was 74.2±7.1 years, and the mean BMI was 24.5±3.2 kg/m2. The proportion of underweight (BMI <18.5 kg/m2), normal (BMI 18.5–22.9 kg/m2), overweight (BMI 23.0–24.9 kg/m2), obese class I (BMI 25.0–29.9 kg/m2), and obese class II (BMI ≥30 kg/m2) subjects were 3.1%, 27.7%, 27.9%, 37.8%, and 3.5%, respectively. The general characteristics of the study subjects according to the BMI quartiles are summarized in Table 1 and in Appendices 1 and 2. There were no significant differences in BMI of the study subjects according to the interview locations (Appendix 3). We observed a difference in the SF-36 scores between the sex; men scored significantly higher than women in six of the eight subdomains-PF, RP, BP, GH, VT, and MH. There were no significant differences between the SF and RE scores between the surveyed men and women (Table 2).
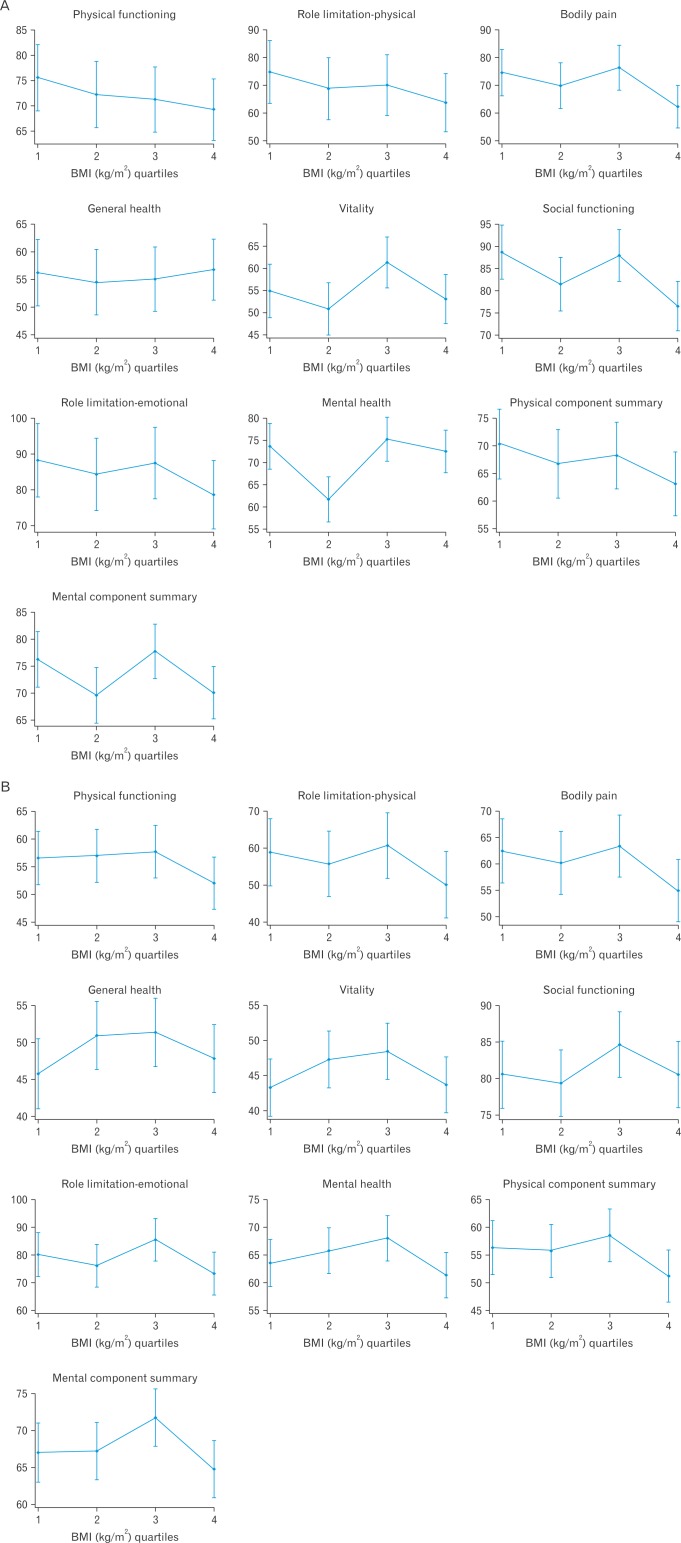
After adjusting for age, education level, income, smoking, alcohol consumption, and diagnosis of osteoarthritis, the SF-36 scores of men and women were compared according to the BMI quartiles (Table 3, Figure 1). Men in the Q3 and Q4 BMI quartiles exhibited higher MH scores than men in Q2, while men in the Q3 quartile exhibited higher SF scores than men in the Q2 and Q4 quartiles. However, there were no significant differences between the four BMI quartiles for the other six SF-36 domains. No statistical differences were observed among women in the four BMI quartiles for the various SF-36 domain scores.
DISCUSSION
This study was designed to investigate the association between obesity in elderly subjects (>60 years of age) and the quality of life. The quality of life scores evaluated using the SF-36 questionnaire was different between men and women, with overall scores of men being higher than those of women. When analyzed based on the BMI quartiles, differences in two SF-36 domain scores were noted between men in some BMI quartile groups, while no differences were observed for the other domains. However, among women in the four BMI quartiles, no significant differences were observed in any of the SF-36 domain scores.
Few studies have investigated the association between obesity and the quality of life in the Korean population. One such study evaluated the quality of life of adults who visited hospitals to manage chronic diseases or frequented a health examination center, using the KOQoL survey. The quality of life of women in the normal-weight group (BMI <23.0 kg/m2) was higher than those in the overweight group (BMI ≥23.0 kg/m2), while no significant differences were noted for men. Further subgroup analysis of subjects older than 45 years of age revealed that the quality of life scores were lower for some of the survey domains in the normal-weight group than in the overweight group.6) In contrast, another study conducted among the over 65-year-old elderly subjects from two welfare centers using the KOQoL questionnaire reported that a greater obesity level was associated with a lower quality of life.7) Although these two studies used the same questionnaire, the age-based segregation of the study population was different, and may have contributed to the differences in the study results.
Unlike previous studies, we did not observe a significant association between obesity and a lower quality of life in the elderly subjects in this study. The subjects of this study were more diverse as we included subjects from welfare centers, community health centers, and hospitals, and this resulted in a reduced selection bias. Moreover, the quality of life measurement tool we utilized also differed from the previous studies. The KOQoL survey questionnaire includes information on body image, sexual life, and diet distress, which may have little impact on the quality of life of the elderly subjects.
Several western studies have reported a negative correlation between obesity and the quality of life in the elderly. In a study by Yan et al.,11) the BMI and quality of life of the elderly participants (>65 years) of the Chicago Heart Association Detention Project in Industry study were surveyed via mail. The quality of life of the 7,080 responders was investigated using the 12-item Health Status Questionnaire (HSQ-12).11) When adjusted for age, race, education level, smoking, and alcohol consumption, compared with normal-weight subjects (BMI 18.5–24.9 kg/m2), a higher obesity level was associated with significantly lower quality of life for both sexes. In another study among elderly subjects (mean age, 72 years) using the Quality of Well-Being Scale (QWB) and a generic HRQoL measure, the quality of life score was lowest in the obese subjects, followed by overweight and underweight subjects compared to the normal-weight subjects.12) Another study was conducted on 3,605 relatively healthy elderly Spanish people (>60 years), and showed that the quality of life score was significantly lower in the obese subject group (BMI ≥30.0 kg/m2) compared to the normal-weight group (BMI 18.5–24.9 kg/m2) for both men and women. This study further noted that the subjects in the overweight group (BMI 25.0–29.9 kg/m2) showed no difference in the quality of life scores compared with those in the normal-weight group.13)
Previous studies investigating the quality of life in elderly people from the western countries have generally employed simple questionnaires such as the HSQ-12 or QWB for data collection. Consequently, it was difficult to identify studies that utilized the SF-36, which includes a broad range of quality of life questions. A simple questionnaire are appropriate for the elderly subject, but may pose limitations in the evaluation of the overall quality of life.14) However, despite the use of the simple questionnaires, previous western studies have consistently reported an association between high BMI and low quality of life, whereas results from Korean studies have been discrepant, including the results of our study. This discrepancy may be due to the different criteria used to define obesity and its prevalence in these studies; while obesity is defined as a BMI of ≥25.0 kg/m2 in Korea, it is defined as a BMI ≥30.0 kg/m2 in the western countries. In a number of western studies including those conducted in the United States and Europe, morbidly obese subjects had substantially lower scores in all subdomains of the SF-36. The lack of association between obesity and a low quality of life in our study may be because of the lower BMI cut-off used to define obesity than those used in the western studies. Further, the number of morbidly obese (BMI ≥35.0 kg/m2) study subjects was very low in our survey population. Moreover, the mean BMI of the group with the highest body weight was 26.3 kg/m2 in this study, which was relatively low compared to those reported in the international studies. This may be the reason for not observing a low quality of life in our obese study subjects.
In our study, the MH scores of men in the Q3 and Q4 BMI quartile groups were higher than those of men in the Q2 group, and the SF scores of the men in the Q3 group were higher than those of Q2 and Q4 group. Although the scores of the Q3 group were significantly higher than the Q2 for some of the survey domains, this should be interpreted carefully as the scores in the Q2 group were the lowest among the four BMI quartile groups. Several previous studies have shown that in elderly subjects, a BMI in the overweight range (25.0–30.0 kg/m2) is associated with lower morbidity and mortality compared with a BMI in the normal weight range (<25.0 kg/m2).15,16,17) However, only a few previous studies have reported similar results in the context of specific diseases and the HRQoL. In our study, the mean BMI of the subjects in the Q3 group was 24.2–25.7 kg/m2, which is lower than the BMI values reported for overweight groups in previous studies. Furthermore, the MH and SF domains that showed significant differences in scores between the BMI quartile groups in our study assessed the subjects' mental health status. Considering these factors, further investigations may be required to elucidate the association between BMI and the comprehensive quality of life, including mental health, in the elderly.
This study has several limitations. First, as the study subjects were segregated based on BMI quartiles, both the underweight (BMI <18.5 kg/m2) and the normal-weight (BMI 18.5–22.9 kg/m2) subjects were included in the same quartile group although being underweight can have a negative effect on the quality of life. However, in our study, the proportion of underweight subjects was low (3.1%). Moreover, our results remained unchanged when we excluded the underweight group from the analysis. Second, the elderly can have lower comprehension and concentration capabilities compared to young adults, which may have resulted in a lower reliability of the quality of life estimates. However, in order to minimize this limitation, we collected data using one-to-one interviews rather than through self-administered questionnaires. This also ensured an accurate evaluation of the study variables, including the variables used for the quality of life measurements. Third, as the questionnaire was administered in 2008, the applicability of our study results to the present-day elderly population may be limited. However, as the questionnaire collected comprehensive data for the HRQoL assessment and was filled by trained interviewers on a one-to-one basis, the data remains meaningful in the present. Moreover, only a few studies have assessed the HRQoL in elderly Koreans since 2008. Fourth, due to the cross-sectional nature of our study, a causal association between obesity and the quality of life could not be identified. Fifth, although this limitation is also due to the cross-sectional study design, weight change could not be considered. In the elderly, previous studies have reported that a significantly large change in weight is associated with a low quality of life.18,19) Future studies should focus on the assessment of causality as well as the change in the quality of life according to the change in body weight.
In this cross-sectional study conducted on the elderly (>60 years) in- and outpatients of hospitals and welfare centers, there was no significant association between a high BMI and a low quality of life, which was assessed using the SF-36 survey questionnaire. It would be essential to perform prospective studies in the future to investigate the effect of obesity on the quality of life in the elderly.