INTRODUCTION
Metabolic syndrome, diabetes, and obesity are highly correlated with hypertriglyceridemia, high low-density lipoprotein (LDL) cholesterol, and low high-density lipoprotein (HDL) cholesterol.1) Conventionally, statins have been widely used to treat hyperlipidemia; these 3-hydroxy-3-methylglutaryl-coenzyme A reductase inhibitors have a significant role in reducing the risk of cardiovascular diseases and stroke.2) It has recently emerged that high serum triglyceride (TG) levels are a significant risk factor for arteriosclerosis.3)
The American College of Cardiology/American Heart Association Guidelines, published in 2013,4) did not include recommendations for the treatment of elevated TG levels. The first goal of the previously published Adult Treatment Panel III5) was to reduce LDL cholesterol levels to a target level, when TG levels were between 200 mg/dL and 499 mg/dL. The second goal was to reduce non-HDL cholesterol to a target level. Drug treatments are recommended for TG levels ≥500 mg/dL, in order to reduce TG levels and prevent acute pancreatitis. Among the drugs used to reduce TG levels, fibrates have been more widely used than nicotinic acid because of their relative efficacy and lower risk of adverse reactions.6) Fibrates are peroxisome proliferator-activated receptor (PPAR)-α agonists that reduce serum TG levels and increase serum HDL cholesterol levels.1,7)
Even though fibrates have been reported to show fewer adverse reactions than other agents, they increase the frequency of myopathy, gallstones, and phlebothrombosis.3,8) While they are not associated with an increased risk of renal failure, they may increase serum creatinine (Cr) levels.9,10,11,12,13) However, most of the previous studies have been conducted in patients with chronic diseases such as diabetes, hypertension, and chronic renal failure.14) A large-scale randomized controlled clinical trial of the efficacy of fenofibrate in coronary artery disease prevention was performed in patients with diabetes who were treated for 5 years. In this study, 2% of subjects showed elevated serum Cr levels >2.3 mg/dL, with mean levels that were 0.11–0.14 mg/dL higher than those of the control group (CG) during the study period. In addition, serum Cr levels declined in some patients after they stopped taking fenofibrate.10)
These findings indicated that fenofibrate increased serum Cr levels in patients with chronic diseases such as diabetes, hypertension, and chronic renal failure. We were interested in whether this compound affected renal function in relatively healthy adults without cardiovascular disease who are commonly seen in the primary care setting. Thus, the present study aimed to investigate the relationship between fibrate treatment and changes in renal function in relatively healthy adults with no cardiovascular diseases.
METHODS
1. Study Subjects
The present retrospective study identified 146 patients with hypertriglyceridemia who had visited the department of family medicine in Wonkwang University Sanbon Hospital in Gunpo-si between November 2007 and July 2015 and had been prescribed 160 mg fenofibrate. The study was approved by the institutional review board (IRB) of Wonkwang University Sanbon Hospital (IRB no. 7302-201610).
Patients with coronary artery, peripheral vascular, or cerebrovascular diseases were excluded from the study. Eighty-three patients for whom serum Cr data prior to treatment and for 1–12 months after treatment initiation were available were selected as subjects. Subsequently the following patients were excluded: two patients with renal dysfunction and Cr levels >1.5 mg/dL prior to treatment; 10 patients with treatment duration <1 month; and nine patients whose medical records did not include height or body weight information. For eight patients, serum TG levels were reduced by <90 mg/dL after treatment; these patients were also excluded because they were regarded as untreated with fenofibrate. Thus, 54 patients were included in the experimental fenofibrate group (FG).
For the CG, patients with high LDL cholesterol who were prescribed atorvastatin, instead of fenofibrate, were selected. Atorvastatin is mainly metabolized in the liver by cytochrome P45015) and has not been associated with kidney damage; instead, a protective effect on the kidney has been reported in diabetes.16) A retrospective analysis of the same hospital department from August 2007 to October 2015 showed that 412 patients were prescribed 10 mg atorvastatin; of these, 298 patients for whom serum Cr data prior to treatment and for 1–12 months after treatment initiation were available were selected as study subjects. In this group, two patients who had renal dysfunction with Cr levels >1.5 mg/dL prior to treatment were excluded, as were 35 patients with treatment duration <1 month, and 14 patients whose medical records did not include height information. Finally, 246 patients were selected as the CG.
2. Test Methods
Blood samples were collected from patients after an 8-hour fast, and total cholesterol levels were measured using an enzymatic colorimetric method on an automatic analyzer (ARCHITECT c8000 or ARCHITECT c16000; Abbott Laboratories, Abbott, IL, USA). TG levels were measured using the glycerol-blanking method; LDL- and HDL cholesterol levels were directly measured using the selective solubilization and modified enzymatic methods, respectively; and serum Cr levels were measured using the kinetic Jaffe reaction method. These analyses were performed using an automatic analyzer. The estimated glomerular filtration rate (eGFR) was calculated using the Chronic Kidney Disease Epidemiology Collaboration formula. Although the method developed by the Modification of Diet in Renal Disease Study is currently the most popular, this formula tends to overestimate GFRs in Asian patients, and is less accurate in individuals with normal or slightly reduced GFRs.17)
Patients with hypertension were defined as either those who were taking anti-hypertensive medications at the time of fenofibrate or statin treatment initiation, or those with a mean blood pressure (out of three measurements at the outpatient department) ≥140 mm Hg (systolic) or ≥90 mm Hg (diastolic). Patients with diabetes were defined as those who were taking anti-diabetic medications at the time of fenofibrate or statin treatment initiation or those with glycated hemoglobin values ≥6.5%, as determined by the blood test conducted at the outpatient department. All patients who used injected insulin were excluded from this study.
Patient alcohol intake was categorized as none, moderate, or at risk. Moderate intake was defined as ≤14 units/wk and ≤7 units/wk for male and female subjects, respectively. At risk intake was defined as ≥15 units/wk and ≥8 units/wk for male and female subjects, respectively. One unit of alcohol corresponded to 14 g, based on the standard employed by the National Institute on Alcohol Abuse and Alcoholism, USA. Body mass index (BMI) was defined as weight divided by height squared. Smoking status was categorized as current smoker, former smoker, or never smoked. A former smoker was defined as an individual who had smoked during their life but did not smoke at the time of the hospital visit.
3. Outcomes
The present study compared changes in serum Cr levels and eGFR between FG patients and CG patients before and after administration of 160 mg fenofibrate or 10 mg atorvastatin, respectively, for 1–12 months. In each group, the primary outcome was defined as the percentage change in serum Cr levels and eGFR. The secondary outcome was defined as the proportion of patients with a serum Cr level increase ≥0.1 mg/dL and an eGFR reduction ≥10 mL/min·1.73 m2 after treatment.
4. Statistical Analysis
Statistical analyses were conducted using the IBM SPSS software ver. 22.0 (IBM Corp., Armonk, NY, USA). Continuous variables were expressed as mean values and were compared between two groups by independent t-tests; the before and after values were compared using paired t-tests. TG levels were log transformed because they were analyzed using a nonparametric test. TG levels were presented as the median and the interquartile range (25th and 75th percentiles). Categorical variables were expressed as percentages and were compared using the chi-square test; when the expected frequency of the cell was <5, the nonparametric Fisher's exact test was used.
To match FG and CG patients, a propensity score matching (PSM) was carried out that considered age, gender, BMI, presence or absence of hypertension or diabetes, alcohol intake, smoking status, pre-treatment serum Cr level, and treatment duration. The caliper width was set to 0.2 standard deviations, which is known to eliminate 98% of the bias.18) As a result, the PSM matched 49 pairs of patients between FG and CG at a 1:1 ratio. The significance level for all statistical analyses was set to a P-value <0.05.
RESULTS
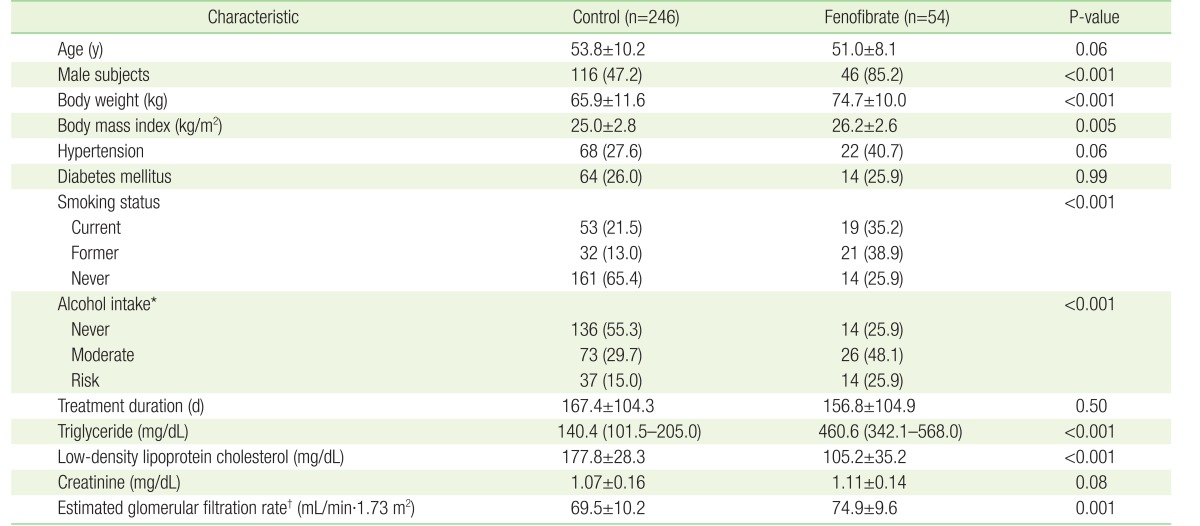
The number of CG and FG patients before PSM was 246 and 54, respectively. The patient demographic and clinical indices are presented in Table 1. The percentages of CG and FG patients with hypertension were 27.6% and 40.7% (68 and 22 patients, P=0.06), respectively, while 26.0% and 25.9% (64 and 14 patients, P=0.99), respectively, had diabetes. The mean treatment durations were 167.4±104.3 and 156.8±104.9 days (P=0.50) for CG and FG patients, respectively. The serum Cr levels before treatment in CG and FG patients were 1.07±0.16 mg/dL and 1.11±0.14 mg/dL (P=0.08), respectively. However, there were significant differences in gender, BMI, smoking status, alcohol intake, and eGFR between CG and FG patients (Table 1).
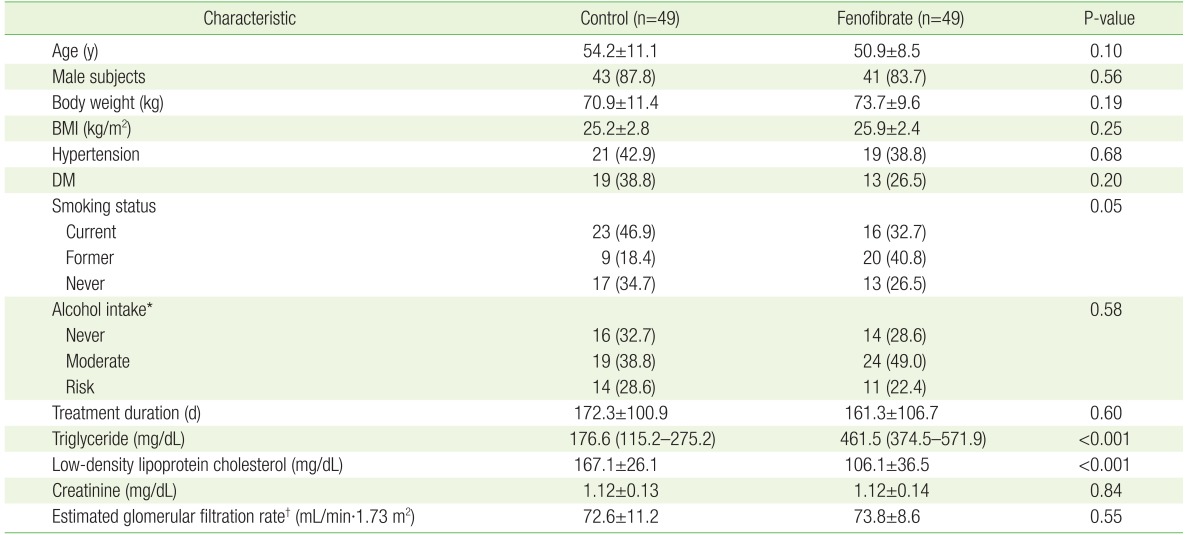
After performing PSM using gender, age, BMI, presence or absence of hypertension and diabetes, smoking status, alcohol intake, treatment duration, and serum Cr level, there were 49 patients in each group. The demographic and clinical indices of the 1:1 matched groups are presented in Table 2. With the exception of TG and LDL cholesterol levels before treatment, there were no significant differences between these patients. TG levels before treatment were 176.6 mg/dL (115.2–275.2 mg/dL) and 461.5 mg/dL (374.5–571.9 mg/dL) in CG and FG patients, respectively (P<0.001). The LDL cholesterol levels before treatment were significantly higher in CG patients than in FG patients (167.1±26.1 mg/dL versus 106.1±36.5 mg/dL, respectively; P<0.001) (Table 2). After treatment, the median TG level in FG patients was 148.8 mg/dL (94.8–207.1 mg/dL) (versus pre-treatment, P<0.001), while the LDL cholesterol level in CG patients was 107.5±32.1 mg/dL (versus pre-treatment, P<0.001).
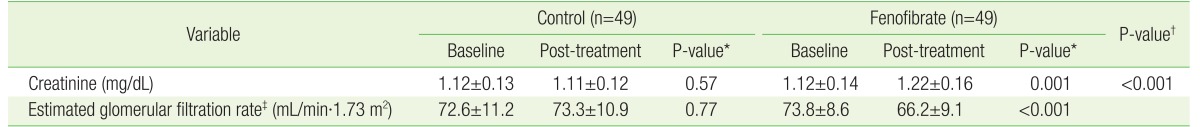
The serum Cr level in FG patients significantly increased from 1.12±0.14 mg/dL before treatment to 1.22±0.16 mg/dL after fenofibrate treatment for 1–12 months (P=0.001). In contrast, the serum Cr level in CG patients was unchanged after atorvastatin treatment for 1–12 months (1.12±0.13 mg/dL before treatment versus 1.11±0.12 mg/dL after treatment, P=0.57) (Table 3).
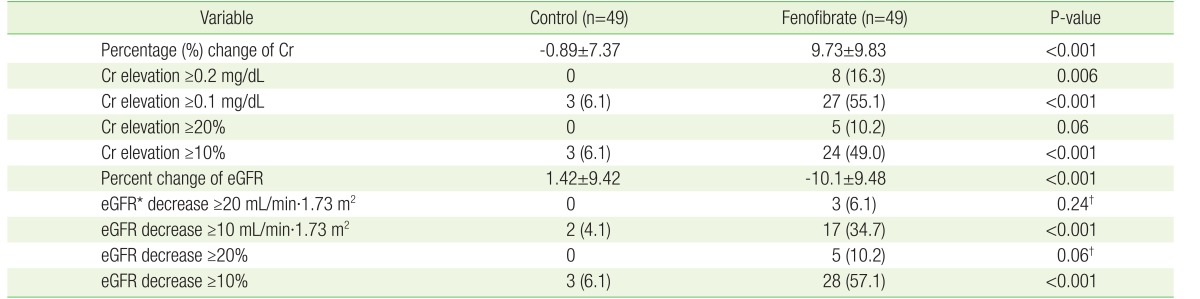
As the primary outcome, the mean serum Cr level in FG patients increased by 9.73%±9.83%, while that of CG patients decreased by 0.89%±7.37% (P<0.001) (Table 4). The eGFR of FG patients decreased by 10.1%±9.48%; this differed significantly from that of CG patients, in which eGFR was elevated by 1.42%±9.42% (P<0.001). As the secondary outcome, the proportion of FG patients whose serum Cr level increased by ≥0.1 mg/dL was significantly higher than the proportion of CG patients with such as a increase (27 [55.1%] versus 3 [6.1%], P<0.001). The proportion of FG patients who demonstrated a decrease in eGFR ≥10 mL/min·1.73 m2 was significantly higher than the proportion of CG patients with such a decrease (17 [34.7%] versus 2 [4.1%], P<0.001).
DISCUSSION
The present study investigated the effects of 1–12 months of fenofibrate treatment in patients with hypertriglyceridemia who did not have a history of cardiovascular disease. These patients are frequently seen in primary care settings and show a significant increase in their mean serum Cr levels (by 0.10 mg/dL or 9.73%, P=0.001), and a significant decrease in their mean eGFR values (by 7.6 mL/min·1.73 m2 or 10.1%, P<0.001) following treatment.
Fenofibrate was approved by the US Food and Drug Administration in 1998 for the treatment of hypertriglyceridemia and atherogenic dyslipidemia.19) It is a synthetic ligand that activates PPAR-α and has been shown to elevate HDL cholesterol by 10%–25% and reduce LDL cholesterol and TG levels by 5%–20% and 20%–50%, respectively.19,20,21)
Although fenofibrate-related nephrotoxicity has not been well-recognized clinically,22) this side effect was recently highlighted by a number of studies.19,23,24) There are several hypotheses relating to the mechanisms underlying fenofibrate-associated nephrotoxicity. Fenofibrate may impair the generation of vasodilatory prostaglandins, leading to decreased dilation of the afferent arteriole; this compromises glomerular capillary pressure and reduces the perfusion of the kidneys.25,26,27) Alternatively, fenofibrate may competitively inhibit Cr secretion in the proximal tubular lumen,28,29,30) or increase endogenous Cr production.31)
Broeders et al.25) studied 27 patients (eight with renal failure and 19 who had undergone a kidney transplant) who showed nephrotoxicity after taking fibrates; this study defined nephrotoxicity as a serum Cr level increase ≥0.2 mg/dL. These results showed that the mean serum Cr level increased by 40%, causing 24 patients to discontinue the treatment. The mean time taken to observe this serum Cr level elevation was 1.9 months, and the serum Cr levels reverted back to pre-treatment values in 18 of the 24 patients who discontinued fibrate medication. In the present study, a serum Cr increase ≥0.2 mg/dL over initial levels was observed in 16.3% of patients who took fenofibrate. Furthermore, Lipscombe et al.28) studied 10 male patients with a past history of renal failure who showed a mean serum Cr increase of 35% after fibrate treatment, with a mean time of 78 days to elevation. These serum Cr levels also decreased after drug withdrawal. In the present study, the mean serum Cr level increased by 9.73%±9.83% after fenofibrate treatment. These two studies indicate that fibrate treatment increased serum Cr levels in patients with nephropathy.14) The results of the present study indicate that elevation of serum Cr levels was reported in subjects with normal renal function, but that the elevations were less marked than in previous studies.25,28) A retrospective study of 428 subjects conducted in 201232) reported that 115 patients (27%) showed a serum Cr level increase ≥0.3 mg/dL within 6 months of fenofibrate treatment initiation; multivariable regression analysis found that nephrotoxicity correlated with a past history of renal disease and high initial levels of fenofibrate. The present study was also a retrospective study, but it used PSM in order to address the limitations of this previous study.
Recent large-scale, long-term, follow-up studies of fenofibrate include the Fenofibrate Intervention and Event Lowering in Diabetes (FIELD)10) study and the Action to Control Cardiovascular Risk in Diabetes (ACCORD) study.11) The FIELD study included 9,795 subjects with type 2 diabetes10); fenofibrate was administered for 5 years, although patients with renal dysfunction (as indicated by initial serum Cr levels ≥1.5 mg/dL) were excluded. The results revealed that mean serum Cr levels increased by 1.0 mg/dL and 0.9 mg/dL in the treatment and placebo groups, respectively (P<0.001). The FIELD Helsinki follow-up study33) investigated albumin excretion and renal function after the administration of fenofibrate to 170 patients with type 2 diabetes. The results also revealed elevated serum Cr levels (P<0.001), as well as a reduced eGFR (P<0.001), after fenofibrate treatment. The ACCORD study was a large-scale 4.7-year study that included 5,518 subjects with type 2 diabetes11); it reported a 0.93–1.10-mg/dL increase in serum Cr levels within 1 year of the initiation of fenofibrate administration. However, no statistical significance was reported. The ACCORD Renal Ancillary Study34) was a prospective follow-up study of the ACCORD study that was conducted to investigate the reversibility of serum Cr levels in patients who took fenofibrate for 5 years. This study showed that 51 days after fenofibrate administration was stopped, there were no differences between the serum Cr levels and eGFR of patients who received fenofibrate and the CG (P=0.3 and P=0.4, respectively). In South Korea, a retrospective study was performed for 36 patients with hypertension who took fenofibrate for 1–3 years.3) The serum Cr levels of the FG increased by 17.8%±14.0% (P<0.001), whereas the CG showed no significant changes (P=0.79). This study differed from the present study in that all the subjects had hypertension.
Furthermore, the present study is distinct from previous studies because the subjects were patients who had visited the clinical examination room; this was not a clinical research study. In addition, we selected patients who did not have cardiovascular disease; the subjects were taking medication for the primary prevention of cardiovascular disease and these patients are usually seen in the primary care setting. Even though this was a retrospective study, we used PSM to identify groups that were adjusted for age, chronic diseases, and lifestyle, in order to reduce the limitations usually associated with retrospective observational studies.
However, one limitation of the present study is that it would be challenging to generalize the results because the subjects were outpatients at the family medicine department of the only one hospital in Gunposi. However, this facility is not expected to differ significantly from a primary care setting because most patients were there for primary preventive treatment. In this study, we investigated the period 1–12 months after fenofibrate initiation. A previous study showed decreased renal function after taking fibrates for only 1 week, which was still maintained 1 year after the medication was started.28) A further limitation of this study is that we could not analyze renal dysfunction according to the period of medication. In addition, we could not consider whether or not the treatment goal was achieved. Moreover, this study could not analyze the detailed characteristics of patients who showed renal dysfunction because of the small number of subjects. As another limitation, we could not consider the control status of hypertension and diabetes, or whether or not the patients were taking drugs for diseases other than hypertension and diabetes. A future prospective study could address this by considering the influence of hypertension, diabetes, and drugs administered for diseases other than hypertension and diabetes. Regarding exclusion criteria, patients who demonstrated a serum TG level reduction <90 mg/dL after fenofibrate treatment were excluded because they were regarded as untreated with fenofibrate. Fenofibrate resulted in a 38% reduction in TG levels by treatment week 12.35) When TG was 500 mg/dL, a reduction of 190 mg/dL was noted after treatment. Considering patient compliance, a fenofibrate treatment effect was defined as a serum TG reduction >90 mg/dL. However, the present study included fenofibrate treatment for just 1 month, and selecting a 90 mg/dL reduction in serum TG levels as the cut-off point was somewhat arbitrary. In hyperlipidemia management, lifestyle modifications such as diet and exercise are as important as medication. Lifestyle modification was recommended alongside medication for the patients included in this study, but validation of its efficacy was limited. Finally, the present study could not determine whether normal renal function was restored after fenofibrate administration had stopped. This is a common limitation of retrospective observational studies and a large-scale prospective study should be conducted in the future to investigate this and to identify the risk factors for renal dysfunction.
There have been very few studies of the effects of fibrates on renal function in Asian populations, including South Korean populations, and the present study was particularly significant because it investigated renal dysfunction in a patient group that is frequently seen in the primary care setting. FG patients showed significant increases in their mean serum Cr levels (0.10 mg/dL, P=0.001), and significant decreases in their mean eGFR values (7.6 mL/min·1.73 m2, P<0.001) compared with CG patients. These findings suggest that it is necessary to monitor patient renal function regularly, in addition to the standard follow-up employed during fibrate treatment. Furthermore, it would be expedient to conduct a large-scale clinical trial to determine which patients are at the highest risk for fibrate-induced renal dysfunction, as well as determining the reversibility of this effect, particularly after long-term fibrate administration.