Does Economic Instability Affect Healthcare Provision? Evidence Based on the Urban Family Physician Program in Iran
Article information
Abstract
Background
The main aim of this study was to evaluate the achievements of some important goals of Iran's urban family physician plan. This plan was implemented when the country experienced economic instability. We examine whether an economic crisis affects the efficacy of a healthcare program.
Methods
We used the household income and expenditures survey data for 2011 (before program implementation) and 2012 (after program implementation). Changes in out-of-pocket payments and healthcare utilization were investigated using the propensity score matching estimator. Furthermore, changes in inequality in these two dimensions were examined.
Results
No changes in out-of-pocket payments and healthcare utilization were found after the implementation of this program; however, inequality in out-of-pocket payments increased during the reform.
Conclusion
The urban family physician program was not implemented completely and many of its fundamental settings were not conducted because of lack of necessary healthcare infrastructure and budget limitations. Family physician programs should be implemented under a strong healthcare infrastructure and favorable economic conditions.
INTRODUCTION
The family physician (FP) plan is an integrated plan for providing primary health care (PHC) to the citizens of Iran.1) The FP plan for the rural population of Iran was launched in 2005, and today, it covers all rural and urban areas with a population below 20,000. This plan has been successful in improving health indicators, including life expectancy and infant mortality rate. Subsequently, in 2011, the urban FP plan was implemented as a pilot program in two provinces: Fars and Mazandaran. Currently, all residents of these two provinces are covered by either the rural or urban FP plan.2)
Under the urban FP plan, a general practitioner (GP) provides health services package at the first level of the healthcare system. In addition, other health workers like nurses, public health professions, and midwiferies provide primary health and rehabilitation services for clients who are covered by the FP plan.3) The team, which is headed by the GP, is responsible for population health, preventive, and PHC services, ensuring continuity of health services for the covered population and referral of patients to higher levels for necessary cases. Payments for FP services and other levels are made by insurance organizations, which are calculated on the basis of the proportion of covered population and service quality. Therefore, patients at the first level have access to services at low or no cost, and if referral to higher levels of care is needed, insurance organizations pay the major share of expenditures. However, if patients do not use the referral system, insurance organizations have no liability for payments.45)
Prior to the implementation of the urban FP plan, the country experienced a surge in revenue from oil exports in the wake of growing oil prices. At the commencement of the plan, however, the country was abruptly faced with the United Nations economic sanctions. Furthermore, the general inflation rate, and therefore, the inflation rate in the healthcare sector increased in the country (nearly 30%). Currencies had a surprising increase during this period. For example, US dollars increased from 10,140 Iranian rials at the beginning of 2011 to 30,780 Iranian rials in the end of 2012.6) The country was also experiencing an economic recession with increasing unemployment and bankruptcy of many factories, while the economic growth (gross domestic product growth rate) was near zero and sometimes became negative in these two years.7) The percentage of out-of-pocket payments (OOP, as a % of total healthcare spending) varied between 50% and 52% at the beginning of the reform.8) Imported drug prices increased suddenly because of decrease in Iranian rials, and the Ministry of Health budget was insufficient to buy these types of drugs.910) Shortage of the drugs increased at it harmed vulnerable population.9) The government through the administration of the Ministry of Health attempted to reduce OOP by using government resources for healthcare financing. In addition, health insurance companies did not have enough power to control healthcare quality and utilization.11)
Fars province is one of the two provinces that experienced the pilot implementation of the FP plan. Fars ranked fourth in terms of provincial population with a total of 4,596,658 residents. Urbanization rate was estimated as 67.6% with 102 cities and the capital city is Shiraz, which has a population of 1,549,453 with its suburbs.12) Fars is located in the south of Iran and its population consists of several ethnic groups, including Fars, Turk, Lor, Arab, and other minor groups. Fars has one of the largest medical universities in Iran and because of its modern public and private hospitals has become one of the most important centers for medical services in Iran. Consequently, this province served as a suitable setting for the implementation of the pilot FP program.12)
Each health reform must eliminate the financial barriers related to changes in payments for healthcare services. OOP is one of these financial barriers. High OOPs may result in less access to healthcare services, especially for the poor.131415) In addition, healthcare utilization must be distributed on the basis of the health of each person, not of income. Having a less unequal distribution of healthcare utilization is another goal of the FP plan.5) In this study, we intend to examine whether the pilot urban FP plan has achieved these two goals in Fars and the effects of the urban FP plan on the healthcare utilization and OOP in the presence of economic instability. Furthermore, we attempt to analyze the changes in inequality in OOPs and healthcare utilization.
METHODS
1. Population and Data
The Urban Household Income and Expenditures Survey (HIES) data for Fars province were used. These data are gathered annually by the Statistical Center of Iran (SCI) for calculating economic indicators. SCI is an independent organization and is not associated with Shiraz University of Medical Sciences, the institution responsible for the pilot implementation of FP program in Fars province. Data for 2011 (before FP program) and 2012 (after FP program) were extracted from the database. Since 2013, a reform in Iran's health system named Health Transformation Plan was launched simultaneously with the FP program; therefore, the year 2012 is the most suitable year for evaluating the FP program. Some parts of HIES data were measured at the individual level and some others at the household level. For utilizing more possible data, we converted individual-level data to household level. For example, we converted the individual-level variable of “being illiterate” into a household-level variable of “the number of illiterate people in the household.” After cleaning and eliminating defective data (four household data) at the end, data for 1,239 households were used for statistical analysis.
2. Variables
1) Outcome variables
Changes in healthcare utilization and OOP were calculated and compared before and after implementation of FP program and inequality for these two variables were measured.
In this study, healthcare utilization was divided into five subcategories: inpatient services, outpatient services, paramedical services, dental services, and drug services. For each sub-category, utilization and OOP data were extracted from the HIES database. To avoid the confounding effects of increase in OOP due to inflation, OOPs were adjusted by each type of inflation rate in the health sector linearly.
2) Potential confounding variables
Household income, number of children less than five years old, number of people more than 70 years old, number of women, and number of illiterate people in each household were extracted from the HIES database. If each of these variables seemed to be significantly different before and after the FP program, they were used for controlling the confounding effects.
3. Statistical Analysis
1) A comparative analysis of before and after implementation
To compare outcome variables before and after the FP program implementation, propensity score matching estimator was applied. Propensity score matching is an appropriate technique for previously gathered data to control the effects of confounding variables. This estimator eliminates the effects of confounding variables and shows the average intervention (treatment) effect for the treated. Propensity score matching compares matched sets of before and after subjects who share a similar value in scores.16)
2) Identifying confounding variables
Multivariate logistic regression was used for identifying confounders. The dependent variable of this regression was the intervention (0=before intervention, 1=after intervention). Potential confounding variables were added as independent variables. If each of these variables had a statistically significant relationship with the dependent variable (significance=90%), this could indicate the difference in two groups that should be matched.
3) Calculating inequality
Concentration indices (C) were calculated to show the relative inequality of the two groups. These indices show the distribution of each health outcome. C is a standard tool for calculating inequality in health economics.17) C is the calculated as twice the area between the concentration curve and equality line. It is calculated using the following formula:

where n is the number of observations, µ is the average of outcome, xi is the outcome of each household, and Ri is the income of each household. As shown in the formula, in concentration indices, inequality is ranked by income. We used income as the socioeconomic index of each household. C has values ranging between -1 and +1. Positive values of C show pro-rich distribution of outcome and negative ones show pro-poor distribution of it. A zero value shows that there is no inequality in outcome.1819) Erreygers20) shortcomings to C index are not related to this study's data.
RESULTS
1. Descriptive Results
Table 1 shows the results of absolute value of utilization of services without considering the confounding variables. As shown in the table, healthcare utilization was 3.18 before the reform and 3.12 after the reform. Monthly utilization of outpatient services was 0.88 before the reform and 0.89 after it. Annual inpatient services utilization was 0.171 before the reform and 0.175 after it. The results of monthly drug, dental, and paramedical services utilization are presented in Table 1 as well.
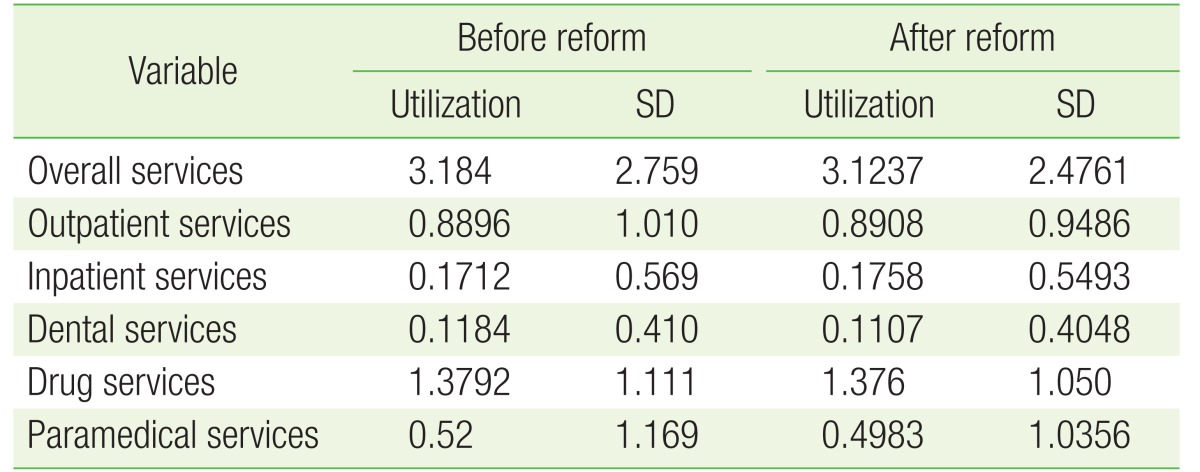
Absolute value of healthcare utilization before and after the urban family physician program
2. Confounding Variables
Table 2 shows the results of the logit model with the year as the dependent variable and potential confounding variables as independent variables. As shown in the table, household size, number of females in each household, number of people aged 70 and above in each household, number of illiterate people in each household, and household income were different between the before and after groups. Thus, to eliminate bias, these variables must be adjusted and controlled in the propensity score matching estimator.

Results of the logit model for finding potential confounding variables for the years 2011 and 2012
3. Propensity Score Matching Results
Table 3 shows the comparison of utilization in the two groups after controlling the effects of confounding variables, using the propensity matching technique. As shown in the table, the P-values of all utilization variables were greater than 0.05, indicating that no statistically significant changes in the utilization of all types of services were found after the implementation of FP program in Fars province. Table 4 shows the results of changes in OOP in each type of healthcare service utilization. Because of calculating overall OOPs (not percentages) we added utilization variable beside other confounding variables. As shown in the table, the overall OOP did not change after the urban FP program. Outpatient and dental services OOPs have increased after the program; however, these results were significant at 90%. Inpatient, drug, and paramedical services OOPs statistically did not change after the program as well.
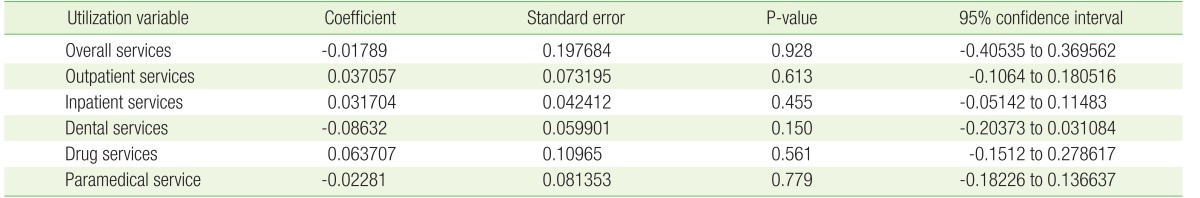
Changes in healthcare utilization after the family physician program in Fars, Iran

Changes in OOPs after family physician program in Fars, Iran
4. Inequality in Healthcare Utilization
Table 5 shows the results of inequality in healthcare utilization before and after the urban FP program. In this table, concentration indices and their standard errors are added. Concentration indices are calculated for each type of utilization.

Inequality in healthcare utilization before and after the urban FP program
As shown in the table, the inequality in healthcare utilization has increased significantly from 0.0072 to 0.707 after the urban FP program implementation. Increase of inequality is in favor of the rich, and thus, it is not acceptable. The subcategories of health services showed that inequality has increased in drug services utilization in favor of the rich. The P-value of drug services was less than 0.05, in contrast to that for other services, which was more than 0.05. Thus, it is clear that the urban PF program of Iran did not have any significant effect on inequality in utilization of other services.
5. Inequality in Out-of-Pocket Payment
Table 6 shows the results of comparison in inequality in OOP and its subcategories. As shown in the table, inequality in OOP has not changed after the implementation of urban FP plan. All P-values of the overall OOP and its subcategories were greater than 0.05, indicating no statistically significant changes.

Inequality in OOP before and after the urban FP program
DISCUSSION
No changes in utilization and OOPs were observed after the urban FP program in Iran. In addition, inequality in utilization and OOPs was adverse in some types of utilization services. The main aim of the urban FP program was to decrease unnecessary costs and improve accessibility of health services. One of the major barriers to increased access to health services is related to financial concerns. After the implementation of FP program, OOP did not decrease, and therefore, healthcare access and utilization remained constant. The FP program is a useful plan, which is recommended by the World Health Organization (WHO) to improve universal access to healthcare services. Its useful effects have been proven worldwide. As defined by the WHO, family physician program contains comprehensive efforts not only in healthcare services but also in education and research.21) The urban FP program of Iran was implemented in a time when the country was faced with a serious economic crisis, including high inflation rate, economic sanctions, decrease in government budget, and risk of investment.7) In such conditions, the Ministry of Health did not have enough budget to provide the necessary infrastructure for the FP program and it was only limited to the referral system. To have an efficient FP program, provision of infrastructure for the plan is necessary, including an efficient electronic health information system, in-service training of physicians, universal health insurances, focus on outcomes, quality measurement, and constant financing of the program.222324) Although, some of these factors, such as the universal health insurance system, have been implemented recently, no attempts have been observed for other reforms in the healthcare system to provide the country with the necessary infrastructure for the urban FP plan.
In addition, during high inflation, the purchasing power of the poor would decrease because of a decline in real income. Consequently, even though the prices of health services did not change, households might decrease their healthcare utilization. Furthermore, the side effects of inflation are more for the poor compared to the rich. Thus, inequality in utilization of services would change in favor of the pro-rich population.2526)
Another problem in the implementation of the urban FP program was the price of drugs. People were able to buy cheap drugs out of the referral system and were able to pay for them. In some cases, if the physician refused to prescribe a drug considered by the patient, the patient was able to turn round the referral system and buy cheap drugs independently. This phenomenon was applicable to specialists' visit as well.27) Furthermore, as discussed before, economic sanctions lead to an increase in the price of imported drugs. Thus, access to these types of drug, which are sometimes vital for vulnerable groups, decreased.928) For example, a study in Fars has shown that access to thalassemia and hemophilia drugs in Iran decreased dramatically during the sanction period.29) Some types of these drugs were produced in Iran, but they were not as efficient as imported drugs; consequently, an increase in mortality in some chronic diseases like end-stage cancer patients was observed.930)
The urban FP plan was implemented without any reforms in health insurance. Estimations had shown that at the time of implementation of the plan, nearly 14% Iranians were not covered by health insurance. Most of these people had low socioeconomic conditions and did not have access to cheaper healthcare services. However, in the recent reform of the healthcare system, health insurance coverage increased to nearly 98%.31)
The GPs of Iran are not trained for the FP program. They lack innovation in improving healthcare and their education is focused solely on treatment. There are no efforts to change the contents of medical education. To be prepared for the FP program, no in-services courses were provided for the practitioners. This might be a reason for constant OOPs during the period. However, the effects of improvement in health would not appear after one or two years.27) Iran's Ministry of Health must take efforts to prepare physicians for working in FP programs. Many countries have undertaken such efforts in this direction.233233)
Many similar studies showed that in the presence of economic crisis, the FP program might not achieve its goals. For example, Schwarz et al.34) found that OOP payments increased in the period of rural FP program in Tajikistan. Similar to Iran, Tajikistan experienced inflation during the FP program implementation. Drug expenditures had the highest increasing rate and doubled during the period. Furthermore, informal payments had not been increased after the implementation of family medicine program.34) Erus and Aktakke35) tested the effects of Turkey's health reform in 2003 on OOPs and showed that the share and level of OOP decreased after the reform. This reform contained both the family practitioner program and health insurance reform, and the country experienced economic stability during its health reform period.35) Evaluating Iran's rural FP program in Fars province (which was implemented during a stable economic condition) showed that not only the costs decreased, but also the healthcare utilization increased.36) Other evidence indicated that the FP program was successful and increased the health of the population.223738)
This study has some limitations. First, data for additional years after the urban FP program was combined with a new reform named the health evolution program. If we add other years in the study, it is difficult to investigate the sole effects of the urban FP program. Furthermore, we were not able to adjust the effects of this new reform at the household level. Second, some other potential confounding variables, such as quality of life, might be different between the two groups; however, because of the use of household income and expenditures survey, data on other variables were not available. Future research must investigate other reforms of Iran, such as the health evolution program and rural FP program.
In conclusion, after the implementation of Iran's FP program, inequality has increased in favor of the rich. OOPs did not change during the implementation of the program. The FP program is recommended by the WHO for improving universal access to health care services. However, this program was implemented in Iran at a time when the country was experiencing high inflation, economic recession, and United Nations sanctions. It is suggested to implement some changes, such as training the physicians, to increase the effectiveness and benefits of the FP program.
Notes
CONFLICT OF INTEREST: No potential conflict of interest relevant to this article was reported.