Association of Occupational Class with Healthcare Utilization among Economically Active Korean Adults from 2006 to 2014: A Repeated Cross-Sectional Study of Koreans Aged 19 Years and Older
Article information
Abstract
Background
To investigate the impact of indicators of occupational class on healthcare utilization by using longitudinal data from a nationally representative survey.
Methods
Data were obtained from the Korean Welfare Panel Study conducted from 2006 (wave 1) through 2014 (wave 9). A total of 5,104 individuals were selected at baseline (2006). Analysis of variance and longitudinal data analysis were used to evaluate the following dependent variables: number of outpatient visits and number of days spent in the hospital per year.
Results
The number of annual outpatient visits was 4.298 days higher (P<0.0001) in class IV, 0.438 days higher (P=0.027) in class III, and 0.335 days higher (P=0.035) in class II than in class I. The number of days spent in the hospital per year was 0.610 days higher (P=0.001) in class IV, 0.547 days higher (P<0.0001) in class III, and 0.115 days higher (P=0.136) in class III than in class I. In addition, the number of days spent in the hospital in class IV patients with unmet healthcare needs showed an opposite trend to that predicted on the basis of socioeconomic status (estimate,−8.524; P-value=0.015).
Conclusion
Patients whose jobs involved manual or physical labor were significantly associated with higher healthcare utilization. Thus, the results suggest that healthcare utilization in different occupational classes should be improved by monitoring work environments and promoting health-enhancing behaviors.
INTRODUCTION
Rising incomes and medical advancements in South Korea over the past 30 years have resulted in dramatic improvements in health status, with life expectancy at birth rising from 64.4 years in 1976 to 79.1 years in 2006. Accordingly, total health expenditures and medical care utilization rates have increased sharply.1)
Many factors such as copayment level, physician-induced demand, healthcare access, residential factors, physiological processes, psychosocial variables, and health behaviors contribute to the utilization of healthcare services. Moreover, an economic recession may also affect medical care utilization2) by contributing to an increase in unemployment rates and the associated interruptions in health insurance coverage.3) However, these factors do not fully explain socioeconomic status (SES)-related health disparities.4)
Several health disparity studies have suggested that SES is correlated with diverse health outcomes,5) including cardiovascular disease (CVD)-related morbidity and mortality.6) The Whitehall II study reported that psychosocial factors related to occupation could play an important role in explaining occupational inequalities in the incidence of coronary heart disease.7) In addition, health behavior plays a role in the creation of socioeconomic health inequalities because major health behaviors such as cigarette smoking are concentrated among individuals with lower SES.8)
Low SES is associated with poorer health outcome across age ranges. For example, low SES is associated with poorer functional status among older people and with higher obesity and depression rates among youth.9) Low SES is also related to biological risk factors including higher heart rate, greater abdominal fat deposition, greater morning rise in cortisol levels, and greater susceptibility to infection following rhinovirus exposure compared to that in individuals with high SES.10)
The most frequently used socioeconomic indicators to explain SESrelated inequalities in health are education and occupation.11) However, education does not capture differential on-the-job training and other career investments made by individuals with similar levels of formal schooling, or the volatility in economic status during adulthood that has recently been shown to adversely affect health.12)
In addition, a previous UK study found that occupational class was a better discriminator of socioeconomic differences in mortality rates than education was.13) Conversely, a recent South Korean study reported that differences in mortality rates due to occupational differences (manual versus nonmanual labor) were relatively small.14) The results of a previous study showed that occupation was not a statistically significant predictor of healthcare utilization among hypertensive patients in Korea15); however, study participants were only divided into regular and non-regular worker groups because of the cross-sectional nature of the database. In addition, there is a lack of empirical evidence regarding hospital utilization in Korea by different occupational groups, obtained through longitudinal analysis. Therefore, the objective of the present study was to investigate the impact of indicators of occupational class on healthcare utilization by using longitudinal data from a nationally representative survey.
METHODS
1. Study Sample and Design
The data used in this study are from the 2006 (wave 1) Korean Welfare Panel Study (KOWEPS) conducted by the Korea Institute for Health and Social Affairs and Seoul National University. The KOWEPS, an annual longitudinal panel survey that began in 2006, uses a proportional systematic stratified cluster sampling of 2005 census data to select a representative sample of households in South Korea.
The panel consists of 18,856 individuals from a national probability sample of 7,072 households residing in South Korea that have been surveyed annually since 2006. KOWEPS includes post-stratification weights based on 2005 census data; it is weighted (1) by the primary sampling unit, and (2) for the intentional oversampling of low-income households. Further details of the sampling design, methods, and data sets can be found elsewhere (http://www.koweps.re.kr/). Results of our analysis were applied to weights of complex sample design. Because the current study data are publicly available, no ethical approval or patient consent was needed.
Respondent samples comprised a total of 18,856 individuals from 7,072 households, 17,478 individuals from 6,580 households, 16,613 individuals from 6,314 households, 16,255 individuals from 6,207 households, 15,625 individuals from 6,034 households, 14,696 individuals from 5,735 households, and 14,604 individuals from 5,732 households from wave 1 (2006) to wave 7 (2012), respectively. For the years from 2006 to 2014, we excluded 4,267, 3,830, 3,552, 3,448, 3,247, 2,971, 2,898, 3,300, and 3,042 individuals who were aged 18 years or younger, respectively. We excluded 9,462 individuals who were unemployed, family volunteers, and economically inactive in 2006; 12,585 in 2007; 11,813 in 2008; 11,511 in 2009; 10,989 in 2010; 10,244 in 2011; 10,102 in 2012; 12,496 in 2013; and 11,945 in 2014. For individuals without information on unmet need experience, we excluded 23 in 2006, 54 in 2007, 13 in 2008, 12 in 2009, 14 in 2010, 10 in 2011, 15 in 2012, 12 in 2013, and 10 in 2014.
2. Study Variables
In this study, we analyzed the number of annual outpatient visits and number of days spent in the hospital per year as dependent variables. Numbers of outpatient visits and days spent in the hospital were extracted from responses to the questions: “How often did you visit a hospital as an outpatient last year?” and “How long did you stay in the hospital last year?” respectively. Age, sex, residential region, marital status, income, type of national health insurance, unmet healthcare need, annual frequency of alcohol use, and duration of chronic disease were included in the analyses as covariates. Residential regions were categorized as urban (Seoul, Daejeon, Daegu, Busan, Incheon, Kwangju, or Ulsan) or rural (not classified as a city). To determine unmet healthcare need, the survey queried respondents regarding whether they had needed health care during the past year but not received the needed services because of financial reasons. The unmet healthcare need was coded 0 if the respondent answered that they did not experience the need for health care, and 1 if their need for health care was unmet because of financial burdens. Marital status was classified as currently married or single, with the latter group including individuals who were previously married, widowed, separated, and divorced. Duration of chronic disease was also included in our models. Duration of chronic disease was operationalized into three different categories: none, 1–3 months, 3–6 months, and ≥6 months.
1) Occupational spectrum indicators
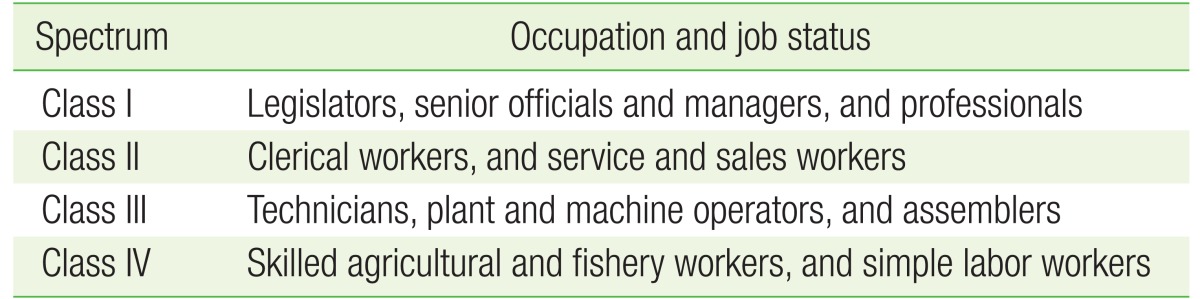
Occupational position was determined using the occupation type according to the South Korean standard, which is based on the International Labor Organization's occupational classification.16) Occupational positions were divided into four classes: class I: professionals, legislators, and senior officials and managers; class II: clerical workers, service and sales workers (white collar); class III: technicians, plant, machine operators, and assemblers (blue collar); and class IV: skilled agricultural and fishery workers and simple labor workers (Table 1).17)
Classification of socioeconomic spectrum groups*
3. Analytical Approach and Statistical Analysis
Analyses of variance and longitudinal data analyses with Poisson distributions were used to investigate the impact of occupational spectrum indicators on healthcare utilization (i.e., number of annual outpatient visits, and number of days spent in the hospital per year). We used a generalized linear mixed model with the Poisson distribution to determine the numbers of outpatient visits and days spent in the hospital per year.
The criterion for significance was two-tailed P≤0.05. All analyses were conducted using the SAS statistical software package ver. 9.2 (SAS Institute Inc., Cary, NC, USA).
RESULTS
Table 2 lists the general characteristics of the subjects at baseline (2006). The study included 5,104 research samples representing the economically active population (Figure 1). The weighted mean number of annual outpatient visits at baseline was 7.269 (standard deviation [SD]=20.324), and the weighted mean number of days spent in the hospital at baseline was 1.118 (SD=8.630) per year. The mean number of annual outpatient visits for class I was 3.890 (SD=7.240), and that for class IV was 18.504 (SD=34.867). The mean numbers of days spent in the hospital per year for class I and IV were 0.749 (SD=4.162) and 1.661 (SD=9.804), respectively.

Association between socioeconomic spectrum and healthcare utilization at baseline (2006)

Flow chart depicting the sample selection process.
Table 3 shows the association between occupational class and healthcare utilization patterns, after adjustment for potential confounding variables. The number of annual outpatient visits was 4.298 days higher (P<0.0001) in class IV, 0.438 days higher (P=0.027) in class III, and 0.335 days higher (P=0.035) in class III than in class I. The number of days spent in the hospital per year was 0.610 days higher (P=0.001) in class IV, 0.547 days higher (P<0.0001) in class III, and 0.115 days higher (P=0.136) in class III than in class I. Tables 4 and 5 show the association between occupational class and healthcare utilization, after adjustment for potential confounding variables, according to unmet healthcare need. The number of days spent in the hospital in class IV individuals with unmet healthcare need showed the exact opposite trend to that predicted on the basis of SES.
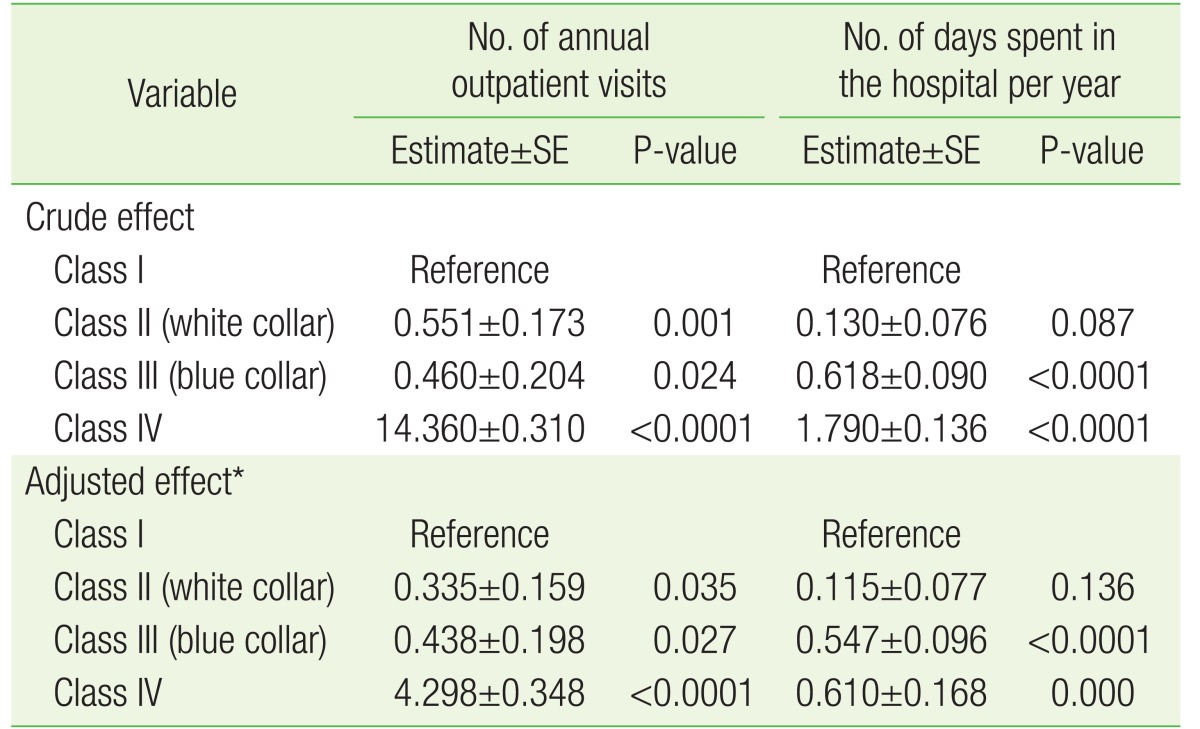
Adjusted effect of occupational class on healthcare utilization patterns
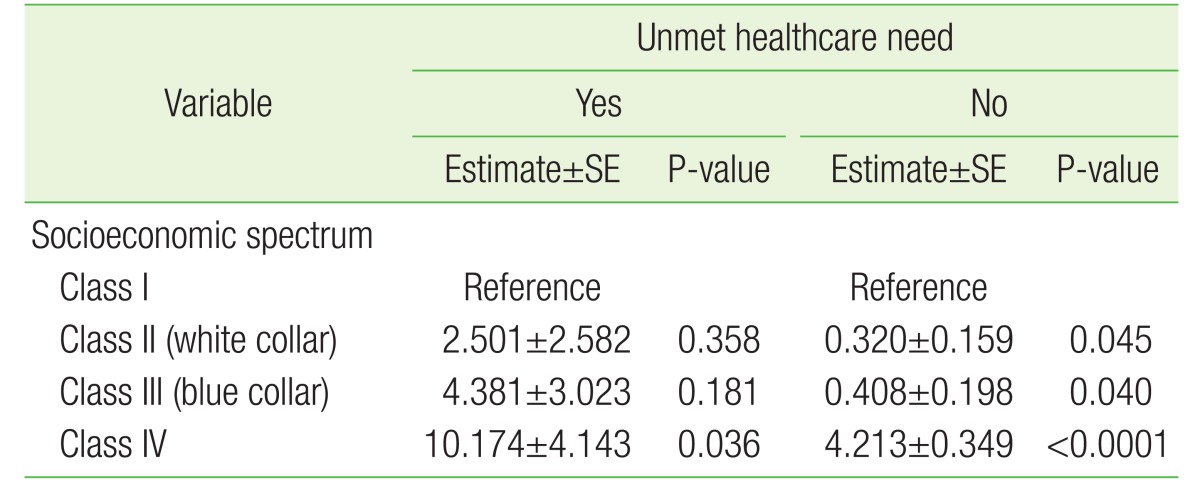
Adjusted effect of occupational class on the number of annual outpatient visits, according to unmet healthcare need
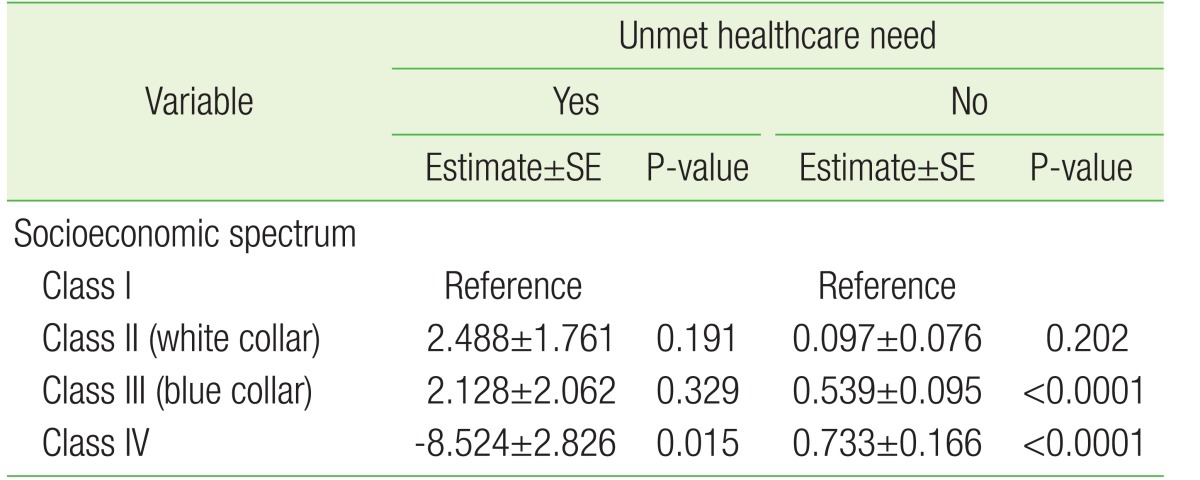
Adjusted effect of study variables on the number of days spent in the hospital per year, according to unmet healthcare need
DISCUSSION
The primary purpose of this study was to investigate the impact of indicators of occupational class on healthcare utilization by using 9-year longitudinal data from a nationally representative sample of the general South Korean population. The associations found in our study were independent of sociodemographic variables (age, sex, residential region, marital status, income, and type of national health insurance), health-risk behavioral variables (alcohol consumption), health status (duration of chronic disease), unmet healthcare need, and year.
We found that a lower employment level was significantly associated with a higher possibility of healthcare service utilization, after adjusting for multiple confounding factors. The main findings of our study can be summarized as follows. First, physical work demands and other typical blue collar job characteristics, such as monotony and low autonomy at work or low flexibility of working hours, were associated with significantly more frequent healthcare utilization. This is consistent with our hypothesis because poorly qualified workers usually have low-status manual labor and physically demanding jobs. Second, adverse working conditions, such as those for blue collar, agricultural, and fishery workers, are very likely to increase the risk for poor general and physical health outcomes. Moreover, such adverse working conditions are strong risk factors for adverse health outcomes related to physical and emotional exhaustion,18) which is more likely to result in increased healthcare service use.
Agricultural, forestry, and fishing industry workers often work long hours under significantly hazardous conditions.19) They perform tasks such as operating equipment, driving machinery, applying pesticides, handling crops, and working with livestock, and face excessive exposure to chemicals.20) Therefore, these workers are adversely affected by numerous occupational injuries, diseases, and other adverse health conditions.21)
Adverse working conditions may have a greater negative effect on worker health in lower status groups because of the increased vulnerability of these workers. Several studies have shown that susceptibility to the negative effects of adverse working conditions and the risk of CVD is higher among lower status workers.22) Furthermore, several studies have reported that the higher prevalence of high job strain or low job control among subjects with lower social status explains part of the risk for adverse health outcomes such as CVD,23) which are more likely to result in increased healthcare service use.
The Whitehall studies have been a rich source of data on social disparities in health. The finding of a graded association between employment grade and mortality24) indicated the ability of SES to influence health, with occupation playing an especially strong role.25) Gradients between SES and health outcomes have been found in other countries, but direct comparisons with Whitehall findings are difficult because the primary SES measure in that study was employment grade, which is specific to the civil service.
In 1995, the National Institutes of Health conference on Measuring Social Inequalities in Health called for inclusion of occupation as a core SES variable in the US health status reporting system.26) Since then, indicators of occupational class are widely used as an SES indicator in other developed countries. Occupational class can have direct and indirect effects on health outcome and can robustly predict variations in health status27) by representing exposure to the psychosocial and physical dimensions of work arrangements,28) as well as a range of expected earnings and social capital in the form of relative standing or prestige.
In summary, our findings suggest that lower-level workers are more vulnerable to adverse work environments than higher-level workers are. Skilled agricultural and fishing industry workers with unmet healthcare needs should be targeted to ensure appropriate healthcare utilization. Even if we recognize health inequalities between employment levels, it is difficult to eliminate occupational inequality. However, we can improve the harmful work environments related to occupational class. Appropriate measures such as monitoring stress and redesigning work conditions should be adopted to alleviate adverse occupational circumstances, especially among lower level workers.
This study has a number of strengths. The major strength is that the participants were likely representative of the overall population. We included a large sample size so that the results could be generalized to the adult South Korean population. No prior study of this research topic has explored associations over a broad range of job characteristics and healthcare utilization. The study sample covered a wide spectrum of social status groups from unskilled industrial and construction workers, who mainly perform manual or physical work, to highly skilled nonmanual workers, who perform professional, administrative, or managerial work. In contrast to other population studies whose samples included only small proportions of low-status individuals,29) we included a relatively high proportion of blue collar workers. Nevertheless, we do acknowledge a possible sample bias.
This study also has some limitations. First, although we estimated longitudinal data, the results possibly reflect reverse causality and bidirectional relationships in the association between job characteristics and healthcare utilization. Second, because certain KOWEPS questions solicit self-reported healthcare utilization, these data were subjective and subject to recall bias. Additionally, these data were not corroborated by medical records because of the cost and scope of work that would have entailed. Third, the increases in worker healthcare utilization observed in this study did not take into account the issue of increases induced by changes in supply and demand of healthcare services. Fourth, cyclic fluctuations in healthcare utilization have been frequently observed,30) particularly during winter and summer holidays, and weekends. Although our study included dummy years from 2008 to 2012, we could not consider seasonal factors because of a lack of information. Fourth, although smoking status may be an important confounding variable, it was excluded because this information was not available for all participants. Finally, although diseases or comorbidities were the most important factors in determining healthcare utilization, we could not control for other factors because of limitations of data availability.
Notes
CONFLICT OF INTEREST: No potential conflict of interest relevant to this article was reported.