Comparison of Fatigue Severity and Quality of Life between Unexplained Fatigue Patients and Explained Fatigue Patients
Article information

Abstract
Background
Recently, despite the high prevalence of fatigue in patients, there is a lack of research on the quality of life (QoL) in unexplained fatigue patients, indicating that they are not properly diagnosed and treated. The aim of this study was to compare fatigue severity and QoL between patients with explained and unexplained fatigue.
Methods
The study consisted of 200 Korean adults who complained of fatigue without underlying disease. Fatigue Severity Scale, Short Form Health Survey-36 version 2 (SF-36v2), and Beck Depression Inventory-II (BDI-II) self-questionnaires were administered. Participants were dichotomized to two groups, namely, patients with unexplained or explained fatigue, sorted according to laboratory examination results. The chi-square test, t-test, and Wilcoxon rank-sum test were used, and analysis of covariance was calculated after adjusting for age, sex, body mass index, smoking status, and physical component summary (PCS) of SF-36v2 or BDI-II.
Results
PCS of SF-36v2 between the two groups showed significant difference. Compared to patients with explained fatigue, those with unexplained fatigue showed lower physical component scores of QoL.
Conclusion
QoL of patients with unexplained fatigue could largely diminish than those with explained fatigue. The primary clinician should be aware of poor QoL in patients with unexplained fatigue to identify who is in need of more attention and intervention.
INTRODUCTION
Fatigue is a universal symptom that occurs in everyday life [1]. The definition of fatigue covers subjective and multidimensional symptoms, including a lack of vitality and a feeling of exhaustion and tiredness [1]. The prevalence rate of fatigue is 7% to 45% worldwide depending on the research method [2]. Depression and anxiety were reported as related factors affecting fatigue [3]. In addition, acute liver disease [4], anemia [5], cancer [6], diabetes [7], and thyroid disease [8] can cause fatigue. Therefore, these diseases are considered differential diagnosis, and the choice of treatments is based on these diseases. However, patients in fatigue without these underlying diseases can be easily neglected because of the lack of research to understand these patients. Continuously untreated fatigue reduces energy, motivation, and concentration, affects the individual’s psychological well-being, and disables daily functioning [9]. This exacerbation may eventually lead to chronic fatigue syndrome (CFS), that is, an unexplained fatigue lasting for more than 6 months and not substantially relieved by rest [9].
Quality of life (QoL) is widely used as a powerful tool to evaluate an individual’s holistic health condition and well-being including several aspects such as physical functioning, psychological functioning and social functioning, role activities, overall life satisfaction, and perception of health status [10]. In recent years, the concept of health is merely expanding from simply without any disease state to physical, mental, and socially well-being state, so that the evaluation of the QoL in the general population is emphasized [11]. However, previous studies were conducted to measure either fatigue severity or QoL, or to explain the association between fatigue severity and QoL in particular gender, age [12], and occupational state [13]. A few studies compare fatigue severity and QoL in the undiagnosed population of any disease that can cause fatigue [14]. A few studies on the relationship between QoL and fatigue severity in chronic diseases such as cancer were conducted [6].
Therefore, this study was designed to compare fatigue severity and QoL by dividing undiagnosed population into the patients with explained and unexplained fatigue.
METHODS
1. Study Design
A cross-sectional study design was used. The study’s setting was the Health Promotion Center of Chung-Ang University Hospital in Seoul, Korea. Records of health examinations from October 2015 to December 2015 were used. This study has been reviewed and approved by the Institutional Review Board of Chung-Ang University Hospital (IRB approval no., C2015166-1624).
2. Participants
Among those who visited the Health Promotion Center, 200 individuals who complained about fatigue voluntarily participated in the study. All participants provided written informed consent.
3. Data Collection
The participants were asked to fill out a structured questionnaire that included the following: age, height (cm), weight (kg), marital status, smoking status, alcohol intake, and past medical history. Body mass index (BMI, kg/m2) was calculated based on the height and weight values of the answers on the questionnaire. The participants also asked to complete a set of three self-administered questionnaires, one each on fatigue, QoL, and depression, following brief instructions pertaining to the survey on the day of the hospital visit.
Participants were excluded if they had any physical or psychological disorder in their self-reported past medical history such as malignancies, endocrine disease or metabolic disease, including diabetes mellitus, thyroid diseases, chronic kidney or liver diseases, acute infectious diseases, sleep disorders, including sleep apnea or restless leg syndrome, or depression; or those who do not fill out the questionnaires completely.
In addition, blood pressure, visual acuity, hearing test, pulmonary function test, oral examination, electrocardiogram, tumor marker, esophagogastroduodenoscopy or colonoscopy, low-dose chest computed tomography (CT) or echocardiography, chest X-ray, abdominal ultrasonography, Pap smear in women aged 35 years below, mammography from 35- to 50-year-old women, bone mineral density in women aged over 50 years old were checked to exclude participants with underlying cause of fatigue.
4. Measurements
1) Clinical assessment
The following laboratory results were recorded: white blood cell count, hemoglobin, glucose, liver function test (alanine transaminase, aspartate aminotransferase, and alkaline phosphatase), kidney function test (blood urea nitrogen-to-creatinine ratio), thyroid-stimulating hormone, electrolytes, total protein, albumin, globulin, urinalysis (hematuria and proteinuria), C-reactive protein, and erythrocyte sedimentation rate. These laboratory items were regarded as causes of fatigue based on CFS’s diagnosis criteria in the Center for Disease Control and Prevention [15]. The normal range of these items followed the standard of Chung-Ang University Hospital. ADVIA 120 automated hematology analyzer (Siemens, Tarrytown, NY, USA) and ADVIA 1650 Chemistry System (Siemens) were used.
2) Fatigue assessment
Fatigue was assessed with Fatigue Severity Scale (FSS) questionnaires. The total scores of the FSS, which ranges from 9 to 63, were calculated by adding the rating for each of the nine 7-point Likert scale items. FSS mean was calculated by dividing the total scores into nine, which is the number of items. Higher scores indicate a higher level of fatigue.
3) Quality of life assessment
The Short Form Health Survey version 2 (SF-36v2 Health Survey) is the most widely used measurement of general health and QoL [16]. The survey was calculated based on the eight aspects of physical functioning, role-physical, bodily pain, general health, vitality, social functioning, role-emotional, and mental health. The physical and mental component scores were calculated based on the six aspects which are described above. SF-36v2 was based on the norm-based scoring algorithms that were standardized by the same average 50 and the same standard deviation [10]. Higher scores indicate a higher QoL.
4) Depression assessment
Beck Depression Inventory version 2 (BDI-II) is one of the most commonly used instruments to measure the presence and severity of depression [17]. Scores on each of the 21 4-point Likert scale items, ranging from 0 to 63, were summed up for the total score on the BDI-II, with high scores indicating a high level of depression. In this study, the cutoff score for depression is set at 18 because this score is considered to have highest sensitivity and specificity, based on a validation study of BDI-II in Korean version [18].
5. Statistical Analysis
All analyses were conducted using a SAS ver. 9.1 statistic package (SAS Institute Inc., Cary, NC, USA). Two-tailed P-values <0.05 were considered statistically significant. All data were evaluated for the normality assumption by using a Kolmogorov-Smirnov test. Continuous data which satisfied normality were summarized using a mean±standard deviation. A nonparametric test was performed for data which did not satisfy normality and represented as median (interquartile range). Categorical data were summarized in number and percentage.
According to the results in laboratory examination, all participants were dichotomized into patients with explained fatigue who had abnormal results or patients with unexplained fatigue who had normal results. The chi-square test or t-test was used to compare the demographic and baseline characteristic variables between patients with explained fatigue and those with unexplained. Drinking habits were assessed to quantify the current frequency of alcohol intake; participants were categorized into three groups: non-drinkers (never or rarely drink alcohol), occasional drinkers (drink alcohol only occasionally, 1–3 d/mo or less), and regular drinkers (drink several times per week, 1–2 d/wk or more). Moreover, smokers were categorized into three groups: non-smokers (never smoke), past smokers (do not smoke now but smoked in the past only), and current smokers (smoke daily or occasionally).
The FSS score, which satisfied normality, was analyzed by t-test; SF-36v2 and BDI-II scores, which did not satisfy normality, were analyzed by a Wilcoxon rank-sum test. Analysis of covariance (ANCOVA) was used to compare FSS, SF-36v2, and BDI-II independently after adjustment for covariate factors between the two groups.
RESULTS
1. Demographic and Characteristic Analysis
A total of 213 participants took part in the study initially. We excluded patients who did not fill in the questionnaires (n=5) or patients who had any physical or psychological disorder (n=8). Finally, 200 participants were involved in the study. All participants were 21–68 years old. Table 1 presents the comparison of demographic factors between patients with unexplained and explained fatigue. Sixty-one patients were found to have only one item of abnormality in their laboratory examination results, 12 patients identified two items of abnormalities, three patients identified three items of abnormalities, and one patient identified four items of abnormalities. Finally, 123 participants (61.5%) were included in the unexplained fatigue group and 77 participants (38.5%) in the explained fatigue group. Significant differences for BMI were found (P=0.04), which was greater in the explained fatigue group than the unexplained fatigue group. Other values had no statistically significant differences.

Demographic and characteristics of patients with unexplained and explained fatigue
2. Comparison of Scores in Questionnaires between Patients with Unexplained and Explained Fatigue
Table 2 shows that physical component summary (PCS) of SF-36v2 is lower (P<0.01) and BDI-II (P=0.02) is higher in patients with unexplained fatigue than those with explained fatigue.
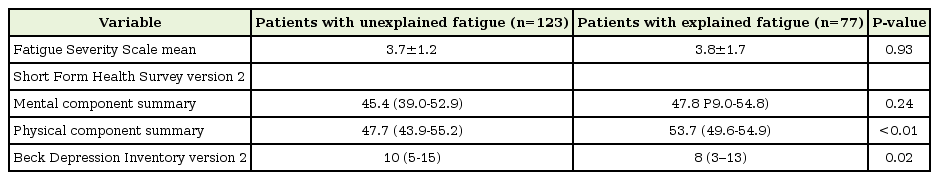
Comparison of scores between patients with unexplained and explained fatigue (n=200)
3. Analysis of Covariance in Questionnaires between Patients with Unexplained Fatigue and Those with Explained Fatigue
Table 3 displays the PCS of SF-36v2 of patients with unexplained fatigue, which is lower than those of patients with explained fatigue after adjustment for age, sex, BMI, BDI-II, and smoking status (P<0.01). Other values had no statistically significant differences.

ANCOVA between patients with unexplained and explained fatigue (n=200)
DISCUSSION
The purpose of this study was to compare fatigue severity and QoL between patients with explained fatigue and those with unexplained fatigue. This study confirmed that patients with explained fatigue had a higher PCS of QoL than those with unexplained fatigue. The difference in the PCS of SF-36v2 between patients with unexplained and explained fatigue is 3.1 points. Previous study shows that a 3-5 point difference in SF-36 scale score noted minimal clinically important difference (MICD) [19]. Since the differences between the two groups are within the range of the MICD, the difference can be considered significant.
Studies found that the physical factors affecting QoL are BMI [20], smoking status [21], alcohol intake habits [22], and exercise [11]. Even after adjusting all these factors that affect QoL, the results of this study proved that patients with unexplained fatigue have lower QoL than those with explained fatigue. Our finding is important because the known cause of fatigue did not directly diminish the PCS of QoL. This implies that not only known factors causing fatigue but also various other factors are involved in determining the QoL of patients with fatigue.
Anderson and Ferrans [23] found that QoL of patients with CFS whose cause of fatigue is unknown is more disrupted than patients with other chronic illness. This result is consistent with our findings. In addition, Anderson et al. explained that the result has significant health implication in that psychosocial factors may affect the progression and recovery of patients with CFS. Among the psychosocial factors affecting QoL identified in previous studies, causal attribution type may be one possible explanation for the results of this study. Somatic attribution is the thought that considers physical factor as the cause of a specific situation or symptom. On the contrary, normalizing attribution accepts that external or environmental factor is the main cause. Although there is no specific disease or cause of symptoms, individuals who are making more somatic attributions are more obsessed with the fear or thought that they have serious illness and suffered from pain and diminished QoL [24]. In this study, 36.6% (45 patients) in the unexplained fatigue group and 18.2% (14 patients) in the explained fatigue group did not have any medical checkup within the past 5 years. We logically suspect that patients who already knew that they have no pathological problems through previous medical checkup are more likely obtain a normalizing attribution, that is, the present symptom is simply caused by external factors such as overwork or temporary lack of sleep. However, if there is no information about their health status, they more likely make somatization attribution about their current symptom. Therefore, we postulate that differences in the QoL of the two groups may be due to the variance in attribution methods. Unfortunately, this study did not investigate the attribution methods of subjects, but if further evaluation will be conducted, it will greatly help in understanding the results.
One of the potential limitations of our study can be that the stress state of participants was not particularly investigated. Stress is known as one of factors of fatigue that are negatively associated with QoL [14]. According to Kim et al. [13], job stress was associated with fatigue level and other negative effects on the QoL of workers in Korea. Moreover, in middle-aged women in Korea, stress was not the causative factor of fatigue but the most explained variable that ultimately affects QoL by inducing a defensive reaction or decreased mood and concentration [25]. Although the BDI-II questionnaire was assessed to check for the participants’ mental status, further evaluation of stress status in patients with fatigue and its relationship with their QoL could be helpful. Additional physical examination was not conducted, but all participants’ physical status was fully assessed by various laboratory and examinations, such as blood pressure, visual acuity, hearing test, pulmonary function test, oral examination, electrocardiogram, esophagogastroduodenoscopy or colonoscopy, low-dose chest CT or echocardiography, chest X-ray, and abdominal ultrasonography. One of the strengths of this study is that we were able to analyze the abovementioned data from the Health Promotion Center.
In conclusion, this study emphasizes the importance of attention for patients with unexplained fatigue. In the actual primary care environment, patients with unexplained fatigue are easily ignored because of the lack of criteria for diagnosis and treatment and some do not show laboratory abnormalities or diagnosed with disease. However, this study proved that the QoL of patients with unexplained fatigue could be more severely diminished than those with explained fatigue. Therefore, the primary physician should not ignore patients with unexplained fatigue and perform appropriate intervention. Some recommendations are available for effective intervention to patients with unexplained fatigue, such as those with CFS. Cognitive behavior therapy (CBT) is based on the fear avoidance theory that CFS is reversible and its behavioral responses are associated with physiological processes to sustain fatigue. Treatment strategies are not only recognizing unnecessary fear about symptoms or activities but also planning for changing the belief and gradually increasing both physical and mental activities [26]. Moreover, the graded exercise therapy (GET) initially sets a target heart rate range to avoid overexertion and then gradually increase the intensity and frequency of the exercise through feedback. The effectiveness of GET is greater than supportive listening and similar to that of CBT [27]. More effective interventions for patients with unexplained fatigue are likely to require additional research.
The primary physician should at least be aware that unexplained fatigue may not be as mild as frequently assumed. The results of this study indicate the possibility that the QoL of patients with unexplained fatigue can be more diminished than those with explained fatigue. This cognizance may help primary physicians to provide appropriate intervention to those patients.
Notes
No potential conflict of interest relevant to this article was reported.