• KAFM
  • Contact us
  • E-Submission
ABOUT
ARTICLE CATEGORY
BROWSE ARTICLES
AUTHOR INFORMATION

Articles

Original Article

Influence of Offspring on Self-Rated Health among Older Adults: Evidence from the Korean Longitudinal Study of Aging (2006–2012)

Korean Journal of Family Medicine 2018;39(3):191-199.
Published online: May 18, 2018

1Department of Health Administration, Dankook University College of Medicine, Cheonan, Korea

2Institute of Health Promotion and Policy, Dankook University, Cheonan, Korea

3Department of Preventive Medicine, Yonsei University College of Medicine, Seoul, Korea

4Institute of Health Services Research, Yonsei University, Seoul, Korea

5Department of Preventive Medicine, Ajou University School of Medicine, Suwon, Korea

6Institute on Aging, Ajou University Medical Center, Suwon, Korea

7Department of Hospital Management, Yonsei University Graduate School of Public Health, Seoul, Korea

*Corresponding Author: Sang Gyu Lee Tel: +82-2-2228-1524, Fax: +82-2-392-7734, E-mail: LEEVAN@yuhs.ac
• Received: May 11, 2016   • Revised: December 30, 2016   • Accepted: January 9, 2017

Copyright © 2018 The Korean Academy of Family Medicine

This is an open-access article distributed under the terms of the Creative Commons Attribution Non-Commercial License (http://creativecommons.org/licenses/by-nc/4.0/) which permits unrestricted noncommercial use, distribution, and reproduction in any medium, provided the original work is properly cited.

  • 5,651 Views
  • 70 Download
  • 6 Web of Science
  • 4 Crossref
  • 4 Scopus
prev next
  • Background
    We investigated whether offspring protect or jeopardize in parents.
  • Methods
    We used data from the Korean Longitudinal Study of Aging and performed a longitudinal analysis of 10,236 individuals at baseline (2006) to estimate the association between offspring-related factors and self-rated health among individuals ≥45 years of age.
  • Results
    The estimate for self-rated health was 0.612 times lower (95% confidence interval [CI], 0.503–0.746; P<0.0001) for those with zero offspring. The estimate for self-rated health was 0.736 (95% CI, 0.635–0.853; P<0.0001) for those with five offspring or more. The estimate for self-rated health was 0.707 (95% CI, 0.528–0.947; P=0.020) for males with zero offspring. The estimate for self-rated health was 0.563 (95% CI, 0.422–0.751; P<0.001) for females with no offspring and for females with five or more offspring. The estimate for self-rated health was 0.686 times lower (95% CI, 0.573–0.822; P<0.0001) for those with five or more offspring compared to females with two offspring.
  • Conclusion
    Those with more offspring (≥5) and those with no offspring tended to have an increased probability of low self-rated health. Overall, our results suggest that offspring have a significant positive effect on self-rated health, which was evident graphically as an inverted U-shape.
Self-rated health (SRH) is a health measure used to rate participants’ general health by asking them a simple question. This question has frequently been employed as a health indicator in sociological health research since the 1950s [1] and has been proposed as a general health assessment screening tool [2].
According to several previous studies, SRH is considered a good indicator of future health and health care utilization [3,4]. Moreover, poor SRH has been shown to predict health outcomes such as mortality or objective health status [2]. SRH does not focus on a specific dimension of health, but rather provides a succinct means of summarizing the diverse components of an individual’s health [5].
SRH is an inclusive measure of health that yields information inaccessible by targeted health measurements and has increased its popularity in population-based and clinical studies [2]. Negative health ratings seem to represent pathogenetic biological processes that compromise health status and may herald future health adversity [2].
Socioeconomic status may be an important determinant of health perception; higher perceived socioeconomic status is protective against a poor health perception and psychosomatic symptoms. This is in comparison to “objective” socioeconomic indicators, such as parental education or employment status [6-8]. Among health behaviors, dietary habits, exercise, smoking, and alcohol use are related to SRH [9,10].
Arguments have been proposed both for and against a positive effect of offspring on health outcome [11]. Offspring provide social support and care within the family and social network. In addition, a greater number of offspring may prevent loneliness and provide parents with feelings of a meaningful life, which might positively affect mental health [12]. In contrast, because the role of parents is physically and mentally demanding, offspring can also be a source of strain when they are young. Therefore, parents can be particularly vulnerable to health problems such as mental disease [13]. As such, we determined whether offspring protect or jeopardize their parents’ SRH.
1. Sample
We used data from the 2006 Korean Longitudinal Study of Aging (KLoSA), which was performed by the Korean Labor Institute and funded by the Korean Ministry of Labor. The population of KLoSA participants included adults ≥45 years of age and resident in 15 large administrative areas. Although surveys of the elderly in other countries have studied adults ≥50 years of age, KLoSA extended its population group to include those aged 45–49 years to account for career changes during middle age. This has been an important social issue since the financial crisis in the late 1990s, which caused many people in the 45–49-year age group to become unemployed.
The present study used a sample from the first through fourth waves of data from the KLoSA, which was conducted by the Korean Labor Institute to collect basic data needed to devise and implement effective social and economic policies that address emerging trends related to population aging. KLoSA results are available on a national public database (website: http://survey.keis.or.kr) and the study was repeated every even-numbered year until 2012.
This study did not require an ethical review since the KLoSA dataset was publicly opened and information that could be used for individual identification was removed.
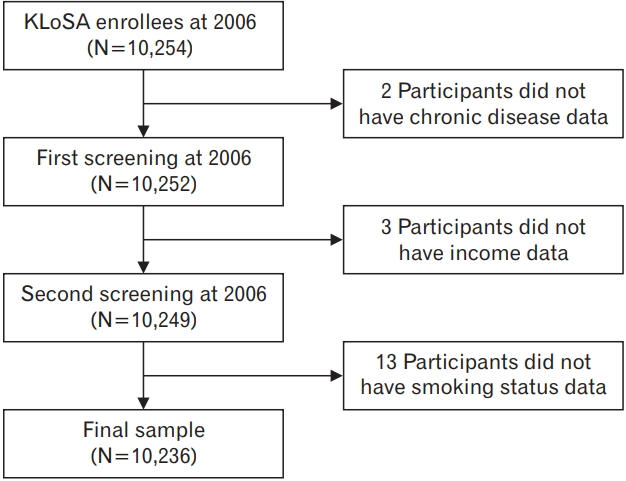
In the first baseline survey conducted in 2006, 10,254 individuals in 6,171 households (1.7 per household) were interviewed using a computer-assisted personal interviewing method. The second survey in 2008 followed up with 8,688 subjects, representing 86.6% of the original population. The third survey in 2010 followed up with 7,920 subjects who represented 80.3% of the original panel. The fourth survey in 2012 followed up with 7,486 subjects who represented 76.2% of the original panel.
Of these participants, we excluded 18, 9, 6, and 7 subjects in 2006, 2008, 2010, and 2012, respectively, due to a lack of information. Thus, a total of 10,236 subjects was selected for this analysis from the baseline survey conducted in 2006 (Figure 1).
2. Study Variables

1) Dependent variable

Self-reported data regarding SRH were extracted from the response to the question “how have you usually perceived your health status in the last year?” Responses to the question were categorized as either “good” or “bad” responses of “very good,” “good,” and “normal” indicated “good,” and responses of “poor” and “very poor” indicated “bad.”

2) Independent variables: offspring-related variables

We used the number of offspring and the composition of the offspring (gender, number of grandchildren, proportion of cohabitation) as independent variables. Proportion of cohabitation was the number of offspring living with their parents divided by the total number of offspring in five categories: no cohabiting offspring, ≤24.9, 25.0–49.9, 50.0–74.9, and ≥75.0. Average offspring age was divided into four categories: Q1 (≤27.5 years old), Q2 (27.6–36.0 years old), Q3 (36.1–44.0 years old), and Q4 (≥44.0 years old). In addition, the number of grandchildren was included as a covariate.

3) Control variables

The age groups of participants were as follows: ≤49, 50–54, 55–59, 60–64, 65–69, 70–74, and ≥75 years of age. Education status was divided into four categories: less than or completed elementary school, middle school, high school, and college or more. Individuals were classified as married or single, and the latter group included those married previously, widowed, or divorced. Income status was divided into two categories: yes, the participant received income or no, they did not. The number of interactions with friends was divided into five categories: every day, 1–2 times/wk, 1–2 times/mo, 3–6 times/y, and never. Economic activity status was divided into two categories, namely employed or unemployed. In addition, health status and behavioral variables (smoking status, alcohol use, and depressive symptoms) were included as covariates. Finally, number of chronic diseases (including hypertension, diabetes, arthritis or rheumatoid arthritis, cancer, chronic obstructive pulmonary disease, liver disease, heart disease, cerebrovascular diseases, and mental illness) was categorized into three groups: 0, 1, and ≥2.
3. Analytical Approach and Statistics
A chi-squared test and a longitudinal data analysis were conducted. We ran a generalized linear mixed model (GLIMMIX) with the binary distribution, which controls for the characteristics of individuals that change over time, such as confounding variables, with the exception of sex. To determine whether the probability of all covariates including SRH changed over time, we included time (year) in the model as a categorical covariate; the regression coefficient was used to estimate both the change in probability of SRH and independent variables annually. The criterion for significance was a two-tailed P≤0.05. All analyses were conducted using the SAS statistical software ver. 9.2 (SAS Institute Inc., Cary, NC, USA).
Table 1 lists the general characteristics of the covariates included in this study according to SRH at baseline (2006). There were 10,236 research samples.
The weighted prevalence of bad SRH at baseline for those with: zero offspring was 3.6%, one offspring was 8.8%, two offspring was 40.6%, and five or more offspring was 12.1% (Table 1).
Table 2 shows the adjusted effect of the number of offspring on SRH according to sex of the participants. The estimate for SRH for those with zero offspring was 0.612 (95% confidence interval [CI], 0.503–0.746; P<0.0001) compared to those with two offspring. The estimate for SRH for those with five or more offspring was 0.736 (95% CI, 0.635–0.853; P<0.0001), compared to those with two offspring. The estimate for SRH for males with zero offspring was 0.707 (95% CI, 0.528–0.947; P=0.020) compared to those with two offspring. The estimate for SRH for females with zero offspring was 0.563 (95% CI, 0.422–0.751; P<0.001) compared to females with two offspring. The estimate for SRH for females with five or more offspring was 0.686 (95% CI, 0.573–0.822; P<0.0001) compared to females with two offspring.
Table 3 shows the adjusted effect of offspring composition on SRH according to sex. The estimate for SRH for males with no offspring was 0.808 (male 95% CI, 0.691–0.946; P<0.0001) and 0.768 (female 95% CI, 0.670–0.880; P<0.000) compared to those with two offspring. The estimate for SRH for females with four or more female offspring was 0.834 (95% CI, 0.697–0.997; P=0.047).
Our primary purpose was to investigate the impact of offspring on SRH in a longitudinal model using a nationally representative sample of adults ≥45 years of age in South Korea. Our results show that those with more offspring (≥5) and those with no offspring tended to have an increased probability of low SRH. Overall, our results suggest that the number of offspring has a relatively large and significant positive effect on SRH, which was evident graphically as an inverse U-shape.
These associations between SRH and offspring were independent of offspring-related variables (number of grandchildren, proportion of cohabitation, and average age of offspring), sociodemographic variables (age, sex, education, marital status, number of interactions with friends, income, and economic activity status), health risk behavior variables (smoking status and alcohol consumption), health status (depressive symptoms and number of chronic diseases), and year.
Previous studies of the association between offspring and health outcomes have shown that a variety of offspring-related factors affect health outcomes. For example, one previous study showed a high possibility of risk for those with five or more offspring and those who had an adolescent birth [14].
Although substantial evidence is available regarding the effect of offspring on specific physical health outcomes such as chronic diseases that occur frequently [15,16], our research has used general health measures, such as an individual’s SRH [17], to predict future health status.
In general, the simple question, “How would you rate your health? Poor, fair, good, very good, or excellent?” is typically labeled as SRH, and is also known as self-assessed health, self-evaluated health, subjective health, or perceived health. The exact wording and response options for SRH questions vary. The question most widely used in the US has responses on a scale including “excellent,” “very good,” “good,” “fair,” and “poor,” whereas the options recommended by World Health Organization [18] and the EURO-REVES 2 group [19] are “very good,” “good,” “fair,” “bad,” and “very bad.” Another version uses the options “very good,” “fairly good,” “average,” “fairly bad,” and “bad.” [20] Although the levels and distributions are not directly comparable between these different measures, they represent parallel assessments of the same phenomenon, and show basically concordant answers [21].
Idler and Benyamini [22] proposed four explanations for the validity of SRH as a predictor of future health outcomes: (1) SRH is more inclusive than covariates used in many studies, (2) SRH is a dynamic evaluation that judges the trajectory of health and not only current health at a defined point in time, (3) SRH influences behavior that subsequently affects health status, and (4) SRH is influenced by the use of resources that reflect or even affect the ability to cope with health threats.
One possible explanation for our results, based on a previous study, is that raising offspring is associated with direct costs, such as nutrition and education, and opportunity costs. Opportunity costs may possibly be generated by reducing parents’ time on the job and thus the higher probability of profit. Less time on the job results in reduced earnings and a high possibility of experiencing poverty, which is associated with negative health outcomes [23-25].
Offspring from a multiple birth increase the probability of suffering financially and increase a female’s probability of experiencing periods of particularly bad overall health [26]. Females with no offspring often express feelings of emptiness and loneliness, and can feel demoralized. Although the strict sanctions against not having children have abated somewhat, the norms of desirability of having offspring remain strong. Nevertheless, a number of theorists and researchers have challenged the view that offspring increase well-being.
A few strengths and limitations of this study should be mentioned. One of the strengths is that the participants may be representative of relatively older adults (≥45 years). Second, our results were estimated through longitudinal data, which are surveyed annually. We obtained a large sample size, so the results can be generalized to older South Korean adults. Nevertheless, we do acknowledge possible limitations. The first problem is that respondents’ reports are subjective, imperfect, and potentially affected by false consciousness and adaptation of resources. Second, because personality characteristics are likely associated with SRH, failure to include them in the statistical models could lead to an exaggeration of the association of interest. Third, in addition to the potential biases discussed above that are likely to inflate the associations between the number of offspring and some of the health variables, we recognize that the estimates may understate the potential associations for all outcomes because of the short follow-up period. Fourth, although there may have been twins, twin males and females, or triplets, we did not measure offspring composition. Fifth, previous findings suggest that high parity (six or more offspring), early first birth, and the experience of infant death or pregnancy loss are associated with worse self-reported health at an older age. Early childbearing also has a clear positive correlation with limitations in activities of daily living [17,27]. However, we did not include these factors because of a lack of information. Finally, although we used longitudinal data, the results possibly reflect reverse causality and bidirectional relationships when assessing the association between the number of offspring and SRH.
We conducted a longitudinal data analysis using a nationally representative sample among adults ≥45 years of age. Our results provide additional evidence for relatively large and significant positive effects of additional offspring on SRH, which will predict future health status.

No potential conflict of interest relevant to this article was reported.

Figure. 1.
Adjusted effect of number of offspring on self-rated health according to gender. KLoSA, Korean Longitudinal Study of Aging.
kjfm-2018-39-3-191f1.jpg
Table 1.
General characteristics of the study variables at baseline (2006)
Characteristic Total
Good SRH
Bad SRH
P-value
N % %* N % %* N % %*
Age (y) <0.0001
 ≤49 1,479 14.5 9.6 630 42.6 40.6 849 57.4 59.4
 50–54 1,173 11.5 8.3 631 53.8 52.5 542 46.2 47.5
 55–59 1,505 14.7 10.8 904 60.1 58.7 601 39.9 41.3
 60–64 1,380 13.5 13.1 939 68.0 68.4 441 32.0 31.6
 65–69 1,406 13.7 13.5 1,068 76.0 76.3 338 24.0 23.7
 70–74 1,507 14.7 20.4 1,259 83.5 83.8 248 16.5 16.2
 ≥75 1,786 17.5 24.2 1,626 91.0 91.1 160 9.0 8.9
Gender
 Male 4,452 43.5 47.0 3,414 76.7 80.4 1,038 23.3 19.6
 Female 5,784 56.5 53.0 3,643 63.0 66.6 2,141 37.0 33.4
Education <0.0001
 ≤Elementary school 4,823 47.1 39.9 2,530 52.5 54.0 2,293 47.5 46.1
 Middle school 1,653 16.2 16.8 1,257 76.0 77.6 396 24.0 22.4
 High school 2,704 26.4 30.8 2,333 86.3 88.1 371 13.7 11.9
 ≥College 1,056 10.3 12.5 937 88.7 91.3 119 11.3 8.7
Marital status
 Married 7,960 77.8 81.1 5,898 74.1 77.8 2,062 25.9 22.2
 Single 2,276 22.2 18.9 1,159 50.9 53.1 1,117 49.1 46.9
No. of interactions with friends <0.0001
 Never 1,217 11.9 12.1 620 50.9 58.7 597 49.1 41.3
 3–6 times/y 603 5.9 6.1 427 70.8 74.6 176 29.2 25.4
 1–2 times/mo 1,828 17.9 18.9 1,370 75.0 79.1 458 25.1 20.9
 1–2 times/wk 3,282 32.1 32.1 2,407 73.3 77.3 875 26.7 22.7
 Every day 3,306 32.3 30.8 2,233 67.5 70.4 1,073 32.5 29.6
Income <0.0001
 Yes 1,982 19.4 23.6 1,719 86.7 88.5 263 13.3 11.5
 No 8,254 80.6 76.4 5,338 64.7 68.4 2,916 35.3 31.7
Economic activity <0.0001
 Yes 3,882 37.9 45.6 3,293 84.8 86.8 589 15.2 13.2
 No 6,354 62.1 54.4 3,764 59.2 61.6 2,590 40.8 38.4
Smoking status <0.0001
 Never 7,291 71.2 68.7 4,875 66.9 70.8 2,416 33.1 29.2
 Former smoker 977 9.5 9.3 660 67.6 71.4 317 32.5 28.6
Smoker 1,968 19.2 22.0 1,522 77.3 81.0 446 22.7 19.0
Alcohol use <0.0001
 Yes 3,881 37.9 42.5 3,081 79.4 82.5 800 20.6 17.5
 Former user 685 6.7 6.1 318 46.4 47.8 367 53.6 52.2
 No 5,670 55.4 51.4 3,658 64.5 68.3 2,012 35.5 31.7
Depressive symptoms <0.0001
 Yes 1,222 11.9 10.9 425 34.8 38.1 797 65.2 61.9
 No 9,014 88.1 89.2 6,632 73.6 77.4 2,382 26.4 22.6
No. of chronic diseases <0.0001
 0 5,379 52.6 57.8 4,656 86.6 88.7 723 13.4 11.3
 1 2,957 28.9 26.5 1,819 61.5 64.0 1,138 38.5 36.0
 ≥2 1,900 18.6 15.8 582 30.6 31.2 1,318 69.4 68.8
No. of offspring <0.0001
 0 319 3.1 3.6 186 58.3 63.9 133 41.7 36.1
 1 791 7.7 8.8 572 72.3 78.1 219 27.7 21.9
 2 3,512 34.3 40.6 2,837 80.8 83.1 675 19.2 16.9
 3 2,536 24.8 23.4 1,796 70.8 74.0 740 29.2 26.0
 4 1,457 14.2 11.6 865 59.4 60.7 592 40.6 39.3
 ≥5 1,621 15.8 12.1 801 49.4 48.8 820 50.6 51.2
No. of male offspring <0.0001
 0 1,316 12.9 14.5 919 69.8 74.2 397 30.2 25.8
 1 4,044 39.5 42.5 3,044 75.3 79.1 1,000 24.7 20.9
 2 3,404 33.3 31.6 2,332 68.5 72.0 1,072 31.5 28.1
 3 1,037 10.1 8.2 577 55.6 57.1 460 44.4 42.9
 ≥4 435 4.3 3.2 185 42.5 41.1 250 57.5 58.9
No. of female offspring <0.0001
 0 2,462 24.1 26.6 1,795 72.9 76.9 667 27.1 23.1
 1 3,646 35.6 37.2 2,673 73.3 77.3 973 26.7 22.7
 2 2,418 23.6 22.5 1,613 66.7 70.3 805 33.3 29.7
 3 1,048 10.2 8.7 625 59.6 62.3 423 40.4 37.8
 ≥4 662 6.5 5.0 351 53.0 53.2 311 47.0 46.8
Proportion of cohabitation (%) <0.0001
 No cohabiting offspring 4,580 44.7 40.1 2,860 62.5 65.0 1,720 37.6 35.0
 ≤24.9 574 5.6 4.0 293 51.1 50.3 281 49.0 49.7
 25.0–49.9 1,374 13.4 11.1 842 61.3 62.9 532 38.7 37.1
 50.0–74.9 1,367 13.4 14.6 1,031 75.4 78.2 336 24.6 21.8
 ≥75.0 2,341 22.9 30.2 2,031 86.8 88.2 310 13.2 11.8
Average age of offspring <0.0001
 Q1 (≤27.5) 3,490 34.1 45.1 2,974 85.2 86.7 516 14.8 13.3
 Q2 (27.6–36.0) 2,630 25.7 25.2 1,927 73.3 73.7 703 26.7 26.3
 Q3 (36.1–44.0) 2,245 21.9 17.2 1,315 58.6 57.9 930 41.4 42.1
 Q4 (≥44.1) 1,871 18.3 12.5 841 45.0 43.7 1,030 55.1 56.3
No. of grandchildren <0.0001
 0 4,022 39.3 50.3 3,378 47.9 85.5 644 20.3 14.5
 1–2 1,499 14.6 13.9 1,035 69.1 71.2 464 31.0 28.8
 3–4 1,357 13.3 11.2 874 64.4 65.9 483 35.6 34.2
 5–6 1,180 11.5 8.9 663 56.2 56.7 517 43.8 43.3
 7–8 876 8.6 6.3 482 55.0 53.8 394 45.0 46.2
 ≥9 1,302 12.7 9.4 625 48.0 46.7 677 52.0 53.3
Total 10,236 100.0 100.0 7,057 68.9 73.1 3,179 31.1 26.9

SRH, self-rated health.

*Weighted %.

Hypertension, diabetes, arthritis or rheumatoid arthritis, cancer, chronic obstructive pulmonary disease, liver disease, heart disease, cerebrovascular diseases, and mental illness.

Table 2.
Adjusted effect of number of children on self-rated health according to parents
Variable Total
Male
Female
Odds ratio (95% CI) P-value Estimate (95% CI) P-value Estimate (95% CI) P-value
No. of offspring
 0 0.612 (0.503–0.746) <0.0001 0.707 (0.528–0.947) 0.020 0.563 (0.422–0.751) 0.000
 1 0.898 (0.794–1.015) 0.085 0.931 (0.763–1.137) 0.482 0.878 (0.748–1.029) 0.108
 2 1.000 1.000 1.000
 3 1.180 (1.077–1.292) 0.000 1.333 (1.149–1.546) 0.000 1.094 (0.974–1.229) 0.129
 4 0.967 (0.862–1.084) 0.560 1.146 (0.939–1.399) 0.179 0.869 (0.754–1.002) 0.053
 ≥5 0.736 (0.635–0.853) <0.0001 0.807 (0.619–1.051) 0.111 0.686 (0.573–0.822) <0.0001
No. of grandchildren
 0 0.921 (0.758–1.121) 0.412 1.073 (0.762–1.510) 0.687 0.833 (0.653–1.062) 0.141
 1–2 0.840 (0.710–0.993) 0.041 0.886 (0.655–1.200) 0.435 0.794 (0.648–0.973) 0.026
 3–4 0.853 (0.734–0.991) 0.038 0.884 (0.669–1.167) 0.383 0.800 (0.668–0.956) 0.014
 5–6 0.821 (0.714–0.943) 0.005 0.855 (0.659–1.108) 0.236 0.781 (0.663–0.922) 0.003
 7–8 0.925 (0.811–1.055) 0.244 0.909 (0.709–1.166) 0.452 0.912 (0.782–1.064) 0.241
 ≥9 1.000 1.000 1.000
Proportion of cohabitation (%)
 No cohabiting offspring 0.810 (0.722–0.910) 0.000 0.831 (0.693–0.997) 0.046 0.806 (0.692–0.939) 0.006
 ≤24.9 1.222 (1.017–1.468) 0.032 1.531 (1.079–2.173) 0.017 1.138 (0.911–1.421) 0.254
 25.0–49.9 0.896 (0.777–1.032) 0.128 0.915 (0.721–1.161) 0.464 0.880 (0.733–1.055) 0.167
 50.0–74.9 0.903 (0.797–1.024) 0.112 0.942 (0.775–1.145) 0.550 0.887 (0.751–1.047) 0.156
 ≥75.0 1.000 1.000 1.000
Average age of offspring (y)
 Q1 (≤27.5) 0.963 (0.793–1.170) 0.707 0.728 (0.525–1.008) 0.056 1.109 (0.859–1.431) 0.426
 Q2 (27.6–36.0) 1.078 (0.932–1.248) 0.312 0.860 (0.663–1.115) 0.256 1.066 (0.884–1.284) 0.504
 Q3 (36.1–44.0) 1.063 (0.955–1.185) 0.265 0.910 (0.745–1.112) 0.357 1.047 (0.915–1.198) 0.504
 Q4 (≥44.1) 1.000 1.000 1.000
Age (y)
 ≤49 1.000 1.000 1.000
 50–54 0.834 (0.712–0.977) 0.024 0.899 (0.696–1.162) 0.417 0.844 (0.687–1.038) 0.109
 55–59 0.713 (0.600–0.847) 0.000 0.752 (0.575–0.984) 0.038 0.776 (0.612–0.983) 0.036
 60–64 0.598 (0.498–0.718) <0.0001 0.718 (0.535–0.964) 0.028 0.610 (0.475–0.782) <0.0001
 65–69 0.482 (0.397–0.586) <0.0001 0.703 (0.514–0.962) 0.028 0.428 (0.328–0.557) <0.0001
 70–74 0.393 (0.319–0.484) <0.0001 0.524 (0.374–0.734) 0.000 0.355 (0.268–0.470) <0.0001
 ≥75 0.307 (0.246–0.384) <0.0001 0.385 (0.266–0.558) <0.0001 0.268 (0.200–0.359) <0.0001
Gender
 Male 1.259 (1.150–1.378) <0.0001 NA NA
 Female 1.000 NA NA
Education
 ≤Elementary school 0.278 (0.241–0.321) <0.0001 0.296 (0.234–0.374) 0.000 0.249 (0.184–0.336) <0.0001
 Middle school 0.476 (0.410–0.552) <0.0001 0.428 (0.334–0.549) 0.001 0.460 (0.338–0.627) 0.001
 High school 0.679 (0.588–0.783) <0.0001 0.638 (0.506–0.804) 0.006 0.639 (0.470–0.868) 0.012
 ≥College 1.000 1.000 1.000
Marital status
 Married 1.076 (1.000–1.158) 0.050 1.061 (0.902–1.248) 0.472 0.989 (0.909–1.077) 0.804
 Single 1.000 1.000 1.000
No. of interactions with friends
 Never 0.421 (0.379–0.467) <0.0001 0.385 (0.326–0.454) <0.0001 0.489 (0.427–0.560) <0.0001
 3–6 times/y 0.754 (0.675–0.843) <0.0001 0.700 (0.582–0.842) 0.000 0.799 (0.694–0.918) 0.002
 1–2 times/mo 1.089 (1.000–1.186) 0.051 1.039 (0.905–1.192) 0.590 1.134 (1.015–1.267) 0.026
 1–2 times/wk 0.972 (0.906–1.043) 0.429 1.062 (0.936–1.205) 0.348 0.914 (0.840–0.995) 0.038
 Every day 1.000 1.000 1.000
Income
 Yes 1.308 (1.197–1.428) <0.0001 1.407 (1.240–1.595) <0.0001 1.273 (1.122–1.446) 0.000
 No 1.000 1.000 1.000
Economic activity
 Yes 1.762 (1.642–1.891) <0.0001 2.412 (2.160–2.694) <0.0001 1.413 (1.286–1.554) <0.0001
 No 1.000 1.000 1.000
Smoking status
 Never 1.130 (1.025–1.245) 0.014 0.985 (0.874–1.111) 0.810 1.959 (1.595–2.405) <0.0001
 Former smoker 0.912 (0.819–1.015) 0.093 0.861 (0.763–0.972) 0.016 1.332 (0.927–1.914) 0.120
 Smoker 1.000 1.000 1.000
Alcohol use
 Yes 1.184 (1.099–1.276) <0.0001 1.462 (1.295–1.651) <0.0001 0.990 (0.899–1.090) 0.836
 Former user 0.516 (0.469–0.567) <0.0001 0.558 (0.485–0.641) <0.0001 0.586 (0.504–0.682) <0.0001
 No 1.000 1.000 1.000
Depressive symptoms
 Yes 0.213 (0.192–0.235) <0.0001 0.213 (0.178–0.254) <0.0001 0.219 (0.194–0.248) <0.0001
 No 1.000 1.000 1.000
No. of chronic disease
 0 8.195 (7.183–9.350) <0.0001 10.649 (8.561–13.247) <0.0001 6.720 (5.698–7.925) <0.0001
 1 2.766 (2.417–3.166) <0.0001 3.156 (2.524–3.947) <0.0001 2.479 (2.094–2.935) <0.0001
 ≥2 1.000 1.000 1.000
Year
 2006 0.612 (0.557–0.673) <0.0001 0.561 (0.479–0.657) <0.0001 0.657 (0.584–0.740) <0.0001
 2008 0.570 (0.519–0.625) <0.0001 0.517 (0.443–0.605) <0.0001 0.613 (0.546–0.689) <0.0001
 2010 0.568 (0.519–0.622) <0.0001 0.532 (0.457–0.619) <0.0001 0.604 (0.539–0.676) <0.0001
 2012 1.000 1.000 1.000

Bold type is considered statistically significant.

CI, confidence interval; NA, not applicable.

Table 3.
Adjusted effect of composition of children on self-rated health according to parents
Variable Total
Male
Female
OR (95% CI) P-value OR (95% CI) P-value OR (95% CI) P-value
No. of offspring with male
 0 0.855 (0.775–0.943) 0.002 0.808 (0.691–0.946) 0.009 0.910 (0.800–1.035) 0.151
 1 1.000 1.000 1.000
 2 1.006 (0.934–1.084) 0.864 0.946 (0.832–1.076) 0.394 1.058 (0.965–1.160) 0.231
 3 0.923 (0.824–1.034) 0.168 0.880 (0.718–1.080) 0.219 0.956 (0.833–1.097) 0.518
 ≥4 0.797 (0.671–0.947) 0.010 0.735 (0.527–1.024) 0.069 0.823 (0.672–1.007) 0.059
No. of offspring with female
 0 0.837 (0.771–0.908) <0.0001 0.768 (0.670–0.880) 0.000 0.908 (0.817–1.009) 0.072
 1 1.000 1.000 1.000
 2 0.886 (0.818–0.960) 0.003 0.965 (0.841–1.107) 0.604 0.836 (0.757–0.924) 0.001
 3 0.864 (0.773–0.966) 0.010 0.931 (0.764–1.135) 0.474 0.824 (0.719–0.945) 0.006
 ≥4 0.855 (0.736–0.993) 0.040 0.852 (0.645–1.126) 0.257 0.834 (0.697–0.997) 0.047
No. of grandchildren
 0 1.030 (0.848–1.250) 0.769 1.250 (0.893–1.750) 0.194 0.888 (0.698–1.130) 0.333
 1–2 0.971 (0.825–1.144) 0.726 1.045 (0.780–1.399) 0.770 0.894 (0.733–1.091) 0.270
 3–4 1.014 (0.877–1.171) 0.855 1.073 (0.824–1.396) 0.601 0.931 (0.783–1.106) 0.415
 5–6 0.988 (0.867–1.127) 0.858 1.075 (0.845–1.369) 0.555 0.915 (0.783–1.069) 0.264
 7–8 1.008 (0.887–1.147) 0.900 1.012 (0.793–1.291) 0.924 0.981 (0.844–1.141) 0.805
 ≥9 1.000 1.000 1.000
Proportion of cohabitation (%)
 No cohabiting offspring 0.774 (0.695–0.861) <0.0001 0.826 (0.697–0.980) 0.028 0.762 (0.661–0.878) 0.000
 ≤24.9 1.065 (0.895–1.266) 0.478 1.349 (0.965–1.886) 0.080 0.998 (0.809–1.230) 0.984
 25.0–49.9 0.925 (0.811–1.055) 0.246 1.001 (0.802–1.250) 0.990 0.890 (0.753–1.053) 0.174
 50.0–74.9 0.885 (0.785–0.997) 0.045 0.924 (0.765–1.117) 0.415 0.876 (0.749–1.024) 0.097
 ≥75.0 1.000 1.000 1.000
Average age of offspring (y)
 Q1 (≤27.5) 0.862 (0.716–1.039) 0.119 0.674 (0.489–0.930) 0.016 0.945 (0.748–1.193) 0.632
 Q2 (27.6–36.0) 1.035 (0.894–1.198) 0.644 0.816 (0.628–1.059) 0.127 1.016 (0.844–1.221) 0.870
 Q3 (36.1–44.0) 1.037 (0.931–1.155) 0.510 0.887 (0.726–1.084) 0.242 1.018 (0.891–1.165) 0.789
 Q4 (≥44.1) 1.000 1.000 1.000
Age (y)
 ≤49 1.000 1.000 1.000
 50–54 0.824 (0.704–0.964) 0.016 0.891 (0.690–1.151) 0.376 0.802 (0.654–0.984) 0.035
 55–59 0.686 (0.578–0.814) <0.0001 0.745 (0.569–0.975) 0.032 0.689 (0.547–0.868) 0.002
 60–64 0.568 (0.474–0.680) <0.0001 0.713 (0.531–0.957) 0.024 0.525 (0.413–0.667) <0.0001
 65–69 0.451 (0.372–0.546) <0.0001 0.690 (0.504–0.944) 0.020 0.358 (0.278–0.461) <0.0001
 70–74 0.362 (0.295–0.444) <0.0001 0.517 (0.369–0.724) 0.000 0.289 (0.221–0.378) <0.0001
 ≥75 0.281 (0.226–0.350) <0.0001 0.371 (0.256–0.538) <0.0001 0.219 (0.165–0.290) <0.0001
Gender
 Male 1.266 (1.157–1.386) <0.0001 NA NA
 Female 1.000
Education
 ≤Elementary school 0.269 (0.234–0.310) <0.0001 0.291 (0.231–0.367) 0.000 0.236 (0.175–0.318) <0.0001
 Middle school 0.460 (0.396–0.533) <0.0001 0.416 (0.325–0.533) 0.001 0.438 (0.322–0.597) 0.001
 High school 0.670 (0.580–0.773) <0.0001 0.632 (0.501–0.796) 0.005 0.619 (0.456–0.840) 0.009
 ≥College 1.000 1.000 1.000
Marital status
 Married 1.099 (1.022–1.182) 0.011 1.081 (0.921–1.269) 0.338 1.006 (0.925–1.095) 0.882
 Single 1.000 1.000 1.000
No. of interaction with friend
 Never 0.417 (0.376–0.463) <0.0001 0.385 (0.326–0.455) <0.0001 0.488 (0.426–0.559) <0.0001
 3–6 times/y 0.754 (0.675–0.843) <0.0001 0.700 (0.582–0.841) 0.000 0.801 (0.697–0.921) 0.002
 1–2 times/mo 1.084 (0.996–1.181) 0.063 1.034 (0.900–1.187) 0.639 1.131 (1.012–1.263) 0.030
 1–2 times/wk 0.972 (0.906–1.043) 0.432 1.059 (0.933–1.201) 0.375 0.917 (0.843–0.999) 0.047
 Every day 1.000 1.000 1.000
Income
 Yes 1.306 (1.196–1.426) <0.0001 1.399 (1.234–1.587) <0.0001 1.277 (1.125–1.450) 0.000
 No 1.000 1.000 1.000
Economic activity
 Yes 1.759 (1.639–1.888) <0.0001 2.392 (2.142–2.672) <0.0001 1.407 (1.280–1.546) <0.0001
 No 1.000 1.000 1.000
Smoking status
 Never 1.134 (1.029–1.250) 0.012 0.985 (0.874–1.111) 0.808 1.991 (1.621–2.446) <0.0001
 Former smoker 0.920 (0.826–1.024) 0.126 0.863 (0.765–0.975) 0.018 1.345 (0.935–1.936) 0.109
 Smoker 1.000 1.000 1.000
Alcohol use
 Yes 1.182 (1.097–1.273) <0.0001 1.453 (1.287–1.641) <0.0001 0.983 (0.892–1.082) 0.722
 Former user 0.516 (0.469–0.567) <0.0001 0.558 (0.486–0.642) <0.0001 0.586 (0.504–0.681) <0.0001
 No 1.000 1.000 1.000
Depressive symptoms
 Yes 0.212 (0.192–0.234) <0.0001 0.210 (0.176–0.251) <0.0001 0.219 (0.194–0.247) <0.0001
 No 1.000 1.000 1.000
No. of chronic disease
 0 8.180 (7.171–9.331) <0.0001 10.528 (8.466–13.093) <0.0001 6.734 (5.711–7.940) <0.0001
 1 2.763 (2.414–3.162) <0.0001 3.136 (2.508–3.921) <0.0001 2.482 (2.096–2.937) <0.0001
 ≥2 1.000 1.000 1.000
Year
 2006 0.613 (0.558–0.674) <0.0001 0.558 (0.476–0.653) <0.0001 0.664 (0.590–0.747) <0.0001
 2008 0.570 (0.520–0.626) <0.0001 0.515 (0.441–0.602) <0.0001 0.618 (0.550–0.693) <0.0001
 2010 0.570 (0.520–0.624) <0.0001 0.532 (0.457–0.620) <0.0001 0.607 (0.542–0.679) <0.0001
 2012 1.000 1.000 1.000

Bold type is considered statistically significant.

CI, confidence interval; NA, not applicable.

  • 1. Garrity TF, Somes GW, Marx MB. Factors influencing self-assessment of health. Soc Sci Med 1978;12:77-81.
  • 2. Jylha M. What is self-rated health and why does it predict mortality?: towards a unified conceptual model. Soc Sci Med 2009;69:307-16.
  • 3. Bath PA. Self-rated health as a risk factor for prescribed drug use and future health and social service use in older people. J Gerontol A Biol Sci Med Sci 1999;54:M565-70.
  • 4. Su D, Richardson C, Wen M, Pagan JA. Cross-border utilization of health care: evidence from a population-based study in south Texas. Health Serv Res 2011;46:859-76.
  • 5. Svedberg P, Bardage C, Sandin S, Pedersen NL. A prospective study of health, life-style and psychosocial predictors of self-rated health. Eur J Epidemiol 2006;21:767-76.
  • 6. Liang J, Shaw BA, Krause N, et al. How does self-assessed health change with age?: a study of older adults in Japan. J Gerontol B Psychol Sci Soc Sci 2005;60:S224-32.
  • 7. Hale L, Hill TD, Burdette AM. Does sleep quality mediate the association between neighborhood disorder and self-rated physical health? Prev Med 2010;51:275-8.
  • 8. Kim JH, Lee SG, Shin J, Park EC. Impact of the gap between socioeconomic stratum and subjective social class on depressive symptoms: unique insights from a longitudinal analysis. Soc Sci Med 2014;120:49-56.
  • 9. Sodergren M, Sundquist J, Johansson SE, Sundquist K. Physical activity, exercise and self-rated health: a population-based study from Sweden. BMC Public Health 2008;8:352.
  • 10. Chrousos GP. Stress and disorders of the stress system. Nat Rev Endocrinol 2009;5:374-81.
  • 11. Bures RM, Koropeckyj-Cox T, Loree M. Childlessness, parenthood, and depressive symptoms among middle-aged and older adults. J Fam Issues 2009;30:670-87.
  • 12. Evenson RJ, Simon RW. Clarifying the relationship between parenthood and depression. J Health Soc Behav 2005;46:341-58.
  • 13. Umberson D, Gove WR. Parenthood and psychological well-being: theory, measurement, and stage in the family life course. J Fam Issues 1989;10:440-62.
  • 14. Grundy E, Tomassini C. Fertility history and health in later life: a record linkage study in England and Wales. Soc Sci Med 2005;61:217-28.
  • 15. Alonzo AA. Long-term health consequences of delayed childbirth: NHANES III. Womens Health Issues 2002;12:37-45.
  • 16. Henretta JC. Early childbearing, marital status, and women’s health and mortality after age 50. J Health Soc Behav 2007;48:254-66.
  • 17. Kington R, Lillard L, Rogowski J. Reproductive history, socioeconomic status, and self-reported health status of women aged 50 years or older. Am J Public Health 1997;87:33-7.
  • 18. De Bruin A, Picavet HSJ, Nossikov A. Health interview surveys: towards international harmonization of methods and instruments. Copenhagen: World Health Organization Regional Office for Europe; 1996.
  • 19. Robine JM, Jagger C, Euro-REVES Group. Creating a coherent set of indicators to monitor health across Europe: the Euro-REVES 2 project. Eur J Public Health 2003;13(3 Suppl):6-14.
  • 20. Jylha M, Guralnik JM, Ferrucci L, Jokela J, Heikkinen E. Is self-rated health comparable across cultures and genders? J Gerontol B Psychol Sci Soc Sci 1998;53:S144-52.
  • 21. Jurges H, Avendano M, Mackenbach JP. Are different measures of selfrated health comparable?: an assessment in five European countries. Eur J Epidemiol 2008;23:773-81.
  • 22. Idler EL, Benyamini Y. Self-rated health and mortality: a review of twenty-seven community studies. J Health Soc Behav 1997;38:21-37.
  • 23. Ross CE, Mirowsky J, Goldsteen K. The impact of the family on health: the decade in review. J Marriage Fam 1990;52:1059-78.
  • 24. Mirowsky J, Ross CE. Age and the effect of economic hardship on depression. J Health Soc Behav 2001;42:132-50.
  • 25. Ross CE, Huber J. Hardship and depression. J Health Soc Behav 1985;26:312-27.
  • 26. Kruk KE, Reinhold S. The effect of children on depression in old age. Soc Sci Med 2014;100:1-11.
  • 27. Spence NJ. The long-term consequences of childbearing: physical and psychological well-being of mothers in later life. Res Aging 2008;30:722-51.

Figure & Data

References

    Citations

    Citations to this article as recorded by  
    • Sleep problems, pain interference, and global subjective health outcome: Findings from a representative aging study in Ghana
      Razak M. Gyasi, Emmanuel Konadu, Priscilla Appiah, Desmond Agyei, Emmanuel Nyaaba, Michael Kwadwo Ntiamoah, Hubert Bimpeh Asiedu, Elizabeth Nana Mbrah Koomson-Yalley, Margaret Makafui Tayviah, Jones Opoku-Ware, André Hajek
      Geriatric Nursing.2025; 61: 73.     CrossRef
    • Associations between vigorous physical activity, social ties, social support, and self-reported health among older adults in Accra, Ghana
      Nestor Asiamah, Kyriakos Kouveliotis, Richard Eduafo, Richard Borkey, Zulkarnain Jaafar
      PLOS Global Public Health.2023; 3(2): e0001582.     CrossRef
    • KLoSA—Korean Longitudinal Study of Aging
      Jungun Lee
      Korean Journal of Family Medicine.2020; 41(1): 1.     CrossRef
    • Association of employment status and income with self-rated health among waged workers with disabilities in South Korea: population-based panel study
      Jae Woo Choi, Juyeong Kim, Euna Han, Tae Hyun Kim
      BMJ Open.2019; 9(11): e032174.     CrossRef

    Download Citation

    Download a citation file in RIS format that can be imported by all major citation management software, including EndNote, ProCite, RefWorks, and Reference Manager.

    Format:

    Include:

    Influence of Offspring on Self-Rated Health among Older Adults: Evidence from the Korean Longitudinal Study of Aging (2006–2012)
    Korean J Fam Med. 2018;39(3):191-199.   Published online May 18, 2018
    Download Citation
    Download a citation file in RIS format that can be imported by all major citation management software, including EndNote, ProCite, RefWorks, and Reference Manager.

    Format:
    • RIS — For EndNote, ProCite, RefWorks, and most other reference management software
    • BibTeX — For JabRef, BibDesk, and other BibTeX-specific software
    Include:
    • Citation for the content below
    Influence of Offspring on Self-Rated Health among Older Adults: Evidence from the Korean Longitudinal Study of Aging (2006–2012)
    Korean J Fam Med. 2018;39(3):191-199.   Published online May 18, 2018
    Close

    Figure

    • 0
    Influence of Offspring on Self-Rated Health among Older Adults: Evidence from the Korean Longitudinal Study of Aging (2006–2012)
    Image
    Figure. 1. Adjusted effect of number of offspring on self-rated health according to gender. KLoSA, Korean Longitudinal Study of Aging.
    Influence of Offspring on Self-Rated Health among Older Adults: Evidence from the Korean Longitudinal Study of Aging (2006–2012)
    Characteristic Total
    Good SRH
    Bad SRH
    P-value
    N % %* N % %* N % %*
    Age (y) <0.0001
     ≤49 1,479 14.5 9.6 630 42.6 40.6 849 57.4 59.4
     50–54 1,173 11.5 8.3 631 53.8 52.5 542 46.2 47.5
     55–59 1,505 14.7 10.8 904 60.1 58.7 601 39.9 41.3
     60–64 1,380 13.5 13.1 939 68.0 68.4 441 32.0 31.6
     65–69 1,406 13.7 13.5 1,068 76.0 76.3 338 24.0 23.7
     70–74 1,507 14.7 20.4 1,259 83.5 83.8 248 16.5 16.2
     ≥75 1,786 17.5 24.2 1,626 91.0 91.1 160 9.0 8.9
    Gender
     Male 4,452 43.5 47.0 3,414 76.7 80.4 1,038 23.3 19.6
     Female 5,784 56.5 53.0 3,643 63.0 66.6 2,141 37.0 33.4
    Education <0.0001
     ≤Elementary school 4,823 47.1 39.9 2,530 52.5 54.0 2,293 47.5 46.1
     Middle school 1,653 16.2 16.8 1,257 76.0 77.6 396 24.0 22.4
     High school 2,704 26.4 30.8 2,333 86.3 88.1 371 13.7 11.9
     ≥College 1,056 10.3 12.5 937 88.7 91.3 119 11.3 8.7
    Marital status
     Married 7,960 77.8 81.1 5,898 74.1 77.8 2,062 25.9 22.2
     Single 2,276 22.2 18.9 1,159 50.9 53.1 1,117 49.1 46.9
    No. of interactions with friends <0.0001
     Never 1,217 11.9 12.1 620 50.9 58.7 597 49.1 41.3
     3–6 times/y 603 5.9 6.1 427 70.8 74.6 176 29.2 25.4
     1–2 times/mo 1,828 17.9 18.9 1,370 75.0 79.1 458 25.1 20.9
     1–2 times/wk 3,282 32.1 32.1 2,407 73.3 77.3 875 26.7 22.7
     Every day 3,306 32.3 30.8 2,233 67.5 70.4 1,073 32.5 29.6
    Income <0.0001
     Yes 1,982 19.4 23.6 1,719 86.7 88.5 263 13.3 11.5
     No 8,254 80.6 76.4 5,338 64.7 68.4 2,916 35.3 31.7
    Economic activity <0.0001
     Yes 3,882 37.9 45.6 3,293 84.8 86.8 589 15.2 13.2
     No 6,354 62.1 54.4 3,764 59.2 61.6 2,590 40.8 38.4
    Smoking status <0.0001
     Never 7,291 71.2 68.7 4,875 66.9 70.8 2,416 33.1 29.2
     Former smoker 977 9.5 9.3 660 67.6 71.4 317 32.5 28.6
    Smoker 1,968 19.2 22.0 1,522 77.3 81.0 446 22.7 19.0
    Alcohol use <0.0001
     Yes 3,881 37.9 42.5 3,081 79.4 82.5 800 20.6 17.5
     Former user 685 6.7 6.1 318 46.4 47.8 367 53.6 52.2
     No 5,670 55.4 51.4 3,658 64.5 68.3 2,012 35.5 31.7
    Depressive symptoms <0.0001
     Yes 1,222 11.9 10.9 425 34.8 38.1 797 65.2 61.9
     No 9,014 88.1 89.2 6,632 73.6 77.4 2,382 26.4 22.6
    No. of chronic diseases <0.0001
     0 5,379 52.6 57.8 4,656 86.6 88.7 723 13.4 11.3
     1 2,957 28.9 26.5 1,819 61.5 64.0 1,138 38.5 36.0
     ≥2 1,900 18.6 15.8 582 30.6 31.2 1,318 69.4 68.8
    No. of offspring <0.0001
     0 319 3.1 3.6 186 58.3 63.9 133 41.7 36.1
     1 791 7.7 8.8 572 72.3 78.1 219 27.7 21.9
     2 3,512 34.3 40.6 2,837 80.8 83.1 675 19.2 16.9
     3 2,536 24.8 23.4 1,796 70.8 74.0 740 29.2 26.0
     4 1,457 14.2 11.6 865 59.4 60.7 592 40.6 39.3
     ≥5 1,621 15.8 12.1 801 49.4 48.8 820 50.6 51.2
    No. of male offspring <0.0001
     0 1,316 12.9 14.5 919 69.8 74.2 397 30.2 25.8
     1 4,044 39.5 42.5 3,044 75.3 79.1 1,000 24.7 20.9
     2 3,404 33.3 31.6 2,332 68.5 72.0 1,072 31.5 28.1
     3 1,037 10.1 8.2 577 55.6 57.1 460 44.4 42.9
     ≥4 435 4.3 3.2 185 42.5 41.1 250 57.5 58.9
    No. of female offspring <0.0001
     0 2,462 24.1 26.6 1,795 72.9 76.9 667 27.1 23.1
     1 3,646 35.6 37.2 2,673 73.3 77.3 973 26.7 22.7
     2 2,418 23.6 22.5 1,613 66.7 70.3 805 33.3 29.7
     3 1,048 10.2 8.7 625 59.6 62.3 423 40.4 37.8
     ≥4 662 6.5 5.0 351 53.0 53.2 311 47.0 46.8
    Proportion of cohabitation (%) <0.0001
     No cohabiting offspring 4,580 44.7 40.1 2,860 62.5 65.0 1,720 37.6 35.0
     ≤24.9 574 5.6 4.0 293 51.1 50.3 281 49.0 49.7
     25.0–49.9 1,374 13.4 11.1 842 61.3 62.9 532 38.7 37.1
     50.0–74.9 1,367 13.4 14.6 1,031 75.4 78.2 336 24.6 21.8
     ≥75.0 2,341 22.9 30.2 2,031 86.8 88.2 310 13.2 11.8
    Average age of offspring <0.0001
     Q1 (≤27.5) 3,490 34.1 45.1 2,974 85.2 86.7 516 14.8 13.3
     Q2 (27.6–36.0) 2,630 25.7 25.2 1,927 73.3 73.7 703 26.7 26.3
     Q3 (36.1–44.0) 2,245 21.9 17.2 1,315 58.6 57.9 930 41.4 42.1
     Q4 (≥44.1) 1,871 18.3 12.5 841 45.0 43.7 1,030 55.1 56.3
    No. of grandchildren <0.0001
     0 4,022 39.3 50.3 3,378 47.9 85.5 644 20.3 14.5
     1–2 1,499 14.6 13.9 1,035 69.1 71.2 464 31.0 28.8
     3–4 1,357 13.3 11.2 874 64.4 65.9 483 35.6 34.2
     5–6 1,180 11.5 8.9 663 56.2 56.7 517 43.8 43.3
     7–8 876 8.6 6.3 482 55.0 53.8 394 45.0 46.2
     ≥9 1,302 12.7 9.4 625 48.0 46.7 677 52.0 53.3
    Total 10,236 100.0 100.0 7,057 68.9 73.1 3,179 31.1 26.9
    Variable Total
    Male
    Female
    Odds ratio (95% CI) P-value Estimate (95% CI) P-value Estimate (95% CI) P-value
    No. of offspring
     0 0.612 (0.503–0.746) <0.0001 0.707 (0.528–0.947) 0.020 0.563 (0.422–0.751) 0.000
     1 0.898 (0.794–1.015) 0.085 0.931 (0.763–1.137) 0.482 0.878 (0.748–1.029) 0.108
     2 1.000 1.000 1.000
     3 1.180 (1.077–1.292) 0.000 1.333 (1.149–1.546) 0.000 1.094 (0.974–1.229) 0.129
     4 0.967 (0.862–1.084) 0.560 1.146 (0.939–1.399) 0.179 0.869 (0.754–1.002) 0.053
     ≥5 0.736 (0.635–0.853) <0.0001 0.807 (0.619–1.051) 0.111 0.686 (0.573–0.822) <0.0001
    No. of grandchildren
     0 0.921 (0.758–1.121) 0.412 1.073 (0.762–1.510) 0.687 0.833 (0.653–1.062) 0.141
     1–2 0.840 (0.710–0.993) 0.041 0.886 (0.655–1.200) 0.435 0.794 (0.648–0.973) 0.026
     3–4 0.853 (0.734–0.991) 0.038 0.884 (0.669–1.167) 0.383 0.800 (0.668–0.956) 0.014
     5–6 0.821 (0.714–0.943) 0.005 0.855 (0.659–1.108) 0.236 0.781 (0.663–0.922) 0.003
     7–8 0.925 (0.811–1.055) 0.244 0.909 (0.709–1.166) 0.452 0.912 (0.782–1.064) 0.241
     ≥9 1.000 1.000 1.000
    Proportion of cohabitation (%)
     No cohabiting offspring 0.810 (0.722–0.910) 0.000 0.831 (0.693–0.997) 0.046 0.806 (0.692–0.939) 0.006
     ≤24.9 1.222 (1.017–1.468) 0.032 1.531 (1.079–2.173) 0.017 1.138 (0.911–1.421) 0.254
     25.0–49.9 0.896 (0.777–1.032) 0.128 0.915 (0.721–1.161) 0.464 0.880 (0.733–1.055) 0.167
     50.0–74.9 0.903 (0.797–1.024) 0.112 0.942 (0.775–1.145) 0.550 0.887 (0.751–1.047) 0.156
     ≥75.0 1.000 1.000 1.000
    Average age of offspring (y)
     Q1 (≤27.5) 0.963 (0.793–1.170) 0.707 0.728 (0.525–1.008) 0.056 1.109 (0.859–1.431) 0.426
     Q2 (27.6–36.0) 1.078 (0.932–1.248) 0.312 0.860 (0.663–1.115) 0.256 1.066 (0.884–1.284) 0.504
     Q3 (36.1–44.0) 1.063 (0.955–1.185) 0.265 0.910 (0.745–1.112) 0.357 1.047 (0.915–1.198) 0.504
     Q4 (≥44.1) 1.000 1.000 1.000
    Age (y)
     ≤49 1.000 1.000 1.000
     50–54 0.834 (0.712–0.977) 0.024 0.899 (0.696–1.162) 0.417 0.844 (0.687–1.038) 0.109
     55–59 0.713 (0.600–0.847) 0.000 0.752 (0.575–0.984) 0.038 0.776 (0.612–0.983) 0.036
     60–64 0.598 (0.498–0.718) <0.0001 0.718 (0.535–0.964) 0.028 0.610 (0.475–0.782) <0.0001
     65–69 0.482 (0.397–0.586) <0.0001 0.703 (0.514–0.962) 0.028 0.428 (0.328–0.557) <0.0001
     70–74 0.393 (0.319–0.484) <0.0001 0.524 (0.374–0.734) 0.000 0.355 (0.268–0.470) <0.0001
     ≥75 0.307 (0.246–0.384) <0.0001 0.385 (0.266–0.558) <0.0001 0.268 (0.200–0.359) <0.0001
    Gender
     Male 1.259 (1.150–1.378) <0.0001 NA NA
     Female 1.000 NA NA
    Education
     ≤Elementary school 0.278 (0.241–0.321) <0.0001 0.296 (0.234–0.374) 0.000 0.249 (0.184–0.336) <0.0001
     Middle school 0.476 (0.410–0.552) <0.0001 0.428 (0.334–0.549) 0.001 0.460 (0.338–0.627) 0.001
     High school 0.679 (0.588–0.783) <0.0001 0.638 (0.506–0.804) 0.006 0.639 (0.470–0.868) 0.012
     ≥College 1.000 1.000 1.000
    Marital status
     Married 1.076 (1.000–1.158) 0.050 1.061 (0.902–1.248) 0.472 0.989 (0.909–1.077) 0.804
     Single 1.000 1.000 1.000
    No. of interactions with friends
     Never 0.421 (0.379–0.467) <0.0001 0.385 (0.326–0.454) <0.0001 0.489 (0.427–0.560) <0.0001
     3–6 times/y 0.754 (0.675–0.843) <0.0001 0.700 (0.582–0.842) 0.000 0.799 (0.694–0.918) 0.002
     1–2 times/mo 1.089 (1.000–1.186) 0.051 1.039 (0.905–1.192) 0.590 1.134 (1.015–1.267) 0.026
     1–2 times/wk 0.972 (0.906–1.043) 0.429 1.062 (0.936–1.205) 0.348 0.914 (0.840–0.995) 0.038
     Every day 1.000 1.000 1.000
    Income
     Yes 1.308 (1.197–1.428) <0.0001 1.407 (1.240–1.595) <0.0001 1.273 (1.122–1.446) 0.000
     No 1.000 1.000 1.000
    Economic activity
     Yes 1.762 (1.642–1.891) <0.0001 2.412 (2.160–2.694) <0.0001 1.413 (1.286–1.554) <0.0001
     No 1.000 1.000 1.000
    Smoking status
     Never 1.130 (1.025–1.245) 0.014 0.985 (0.874–1.111) 0.810 1.959 (1.595–2.405) <0.0001
     Former smoker 0.912 (0.819–1.015) 0.093 0.861 (0.763–0.972) 0.016 1.332 (0.927–1.914) 0.120
     Smoker 1.000 1.000 1.000
    Alcohol use
     Yes 1.184 (1.099–1.276) <0.0001 1.462 (1.295–1.651) <0.0001 0.990 (0.899–1.090) 0.836
     Former user 0.516 (0.469–0.567) <0.0001 0.558 (0.485–0.641) <0.0001 0.586 (0.504–0.682) <0.0001
     No 1.000 1.000 1.000
    Depressive symptoms
     Yes 0.213 (0.192–0.235) <0.0001 0.213 (0.178–0.254) <0.0001 0.219 (0.194–0.248) <0.0001
     No 1.000 1.000 1.000
    No. of chronic disease
     0 8.195 (7.183–9.350) <0.0001 10.649 (8.561–13.247) <0.0001 6.720 (5.698–7.925) <0.0001
     1 2.766 (2.417–3.166) <0.0001 3.156 (2.524–3.947) <0.0001 2.479 (2.094–2.935) <0.0001
     ≥2 1.000 1.000 1.000
    Year
     2006 0.612 (0.557–0.673) <0.0001 0.561 (0.479–0.657) <0.0001 0.657 (0.584–0.740) <0.0001
     2008 0.570 (0.519–0.625) <0.0001 0.517 (0.443–0.605) <0.0001 0.613 (0.546–0.689) <0.0001
     2010 0.568 (0.519–0.622) <0.0001 0.532 (0.457–0.619) <0.0001 0.604 (0.539–0.676) <0.0001
     2012 1.000 1.000 1.000
    Variable Total
    Male
    Female
    OR (95% CI) P-value OR (95% CI) P-value OR (95% CI) P-value
    No. of offspring with male
     0 0.855 (0.775–0.943) 0.002 0.808 (0.691–0.946) 0.009 0.910 (0.800–1.035) 0.151
     1 1.000 1.000 1.000
     2 1.006 (0.934–1.084) 0.864 0.946 (0.832–1.076) 0.394 1.058 (0.965–1.160) 0.231
     3 0.923 (0.824–1.034) 0.168 0.880 (0.718–1.080) 0.219 0.956 (0.833–1.097) 0.518
     ≥4 0.797 (0.671–0.947) 0.010 0.735 (0.527–1.024) 0.069 0.823 (0.672–1.007) 0.059
    No. of offspring with female
     0 0.837 (0.771–0.908) <0.0001 0.768 (0.670–0.880) 0.000 0.908 (0.817–1.009) 0.072
     1 1.000 1.000 1.000
     2 0.886 (0.818–0.960) 0.003 0.965 (0.841–1.107) 0.604 0.836 (0.757–0.924) 0.001
     3 0.864 (0.773–0.966) 0.010 0.931 (0.764–1.135) 0.474 0.824 (0.719–0.945) 0.006
     ≥4 0.855 (0.736–0.993) 0.040 0.852 (0.645–1.126) 0.257 0.834 (0.697–0.997) 0.047
    No. of grandchildren
     0 1.030 (0.848–1.250) 0.769 1.250 (0.893–1.750) 0.194 0.888 (0.698–1.130) 0.333
     1–2 0.971 (0.825–1.144) 0.726 1.045 (0.780–1.399) 0.770 0.894 (0.733–1.091) 0.270
     3–4 1.014 (0.877–1.171) 0.855 1.073 (0.824–1.396) 0.601 0.931 (0.783–1.106) 0.415
     5–6 0.988 (0.867–1.127) 0.858 1.075 (0.845–1.369) 0.555 0.915 (0.783–1.069) 0.264
     7–8 1.008 (0.887–1.147) 0.900 1.012 (0.793–1.291) 0.924 0.981 (0.844–1.141) 0.805
     ≥9 1.000 1.000 1.000
    Proportion of cohabitation (%)
     No cohabiting offspring 0.774 (0.695–0.861) <0.0001 0.826 (0.697–0.980) 0.028 0.762 (0.661–0.878) 0.000
     ≤24.9 1.065 (0.895–1.266) 0.478 1.349 (0.965–1.886) 0.080 0.998 (0.809–1.230) 0.984
     25.0–49.9 0.925 (0.811–1.055) 0.246 1.001 (0.802–1.250) 0.990 0.890 (0.753–1.053) 0.174
     50.0–74.9 0.885 (0.785–0.997) 0.045 0.924 (0.765–1.117) 0.415 0.876 (0.749–1.024) 0.097
     ≥75.0 1.000 1.000 1.000
    Average age of offspring (y)
     Q1 (≤27.5) 0.862 (0.716–1.039) 0.119 0.674 (0.489–0.930) 0.016 0.945 (0.748–1.193) 0.632
     Q2 (27.6–36.0) 1.035 (0.894–1.198) 0.644 0.816 (0.628–1.059) 0.127 1.016 (0.844–1.221) 0.870
     Q3 (36.1–44.0) 1.037 (0.931–1.155) 0.510 0.887 (0.726–1.084) 0.242 1.018 (0.891–1.165) 0.789
     Q4 (≥44.1) 1.000 1.000 1.000
    Age (y)
     ≤49 1.000 1.000 1.000
     50–54 0.824 (0.704–0.964) 0.016 0.891 (0.690–1.151) 0.376 0.802 (0.654–0.984) 0.035
     55–59 0.686 (0.578–0.814) <0.0001 0.745 (0.569–0.975) 0.032 0.689 (0.547–0.868) 0.002
     60–64 0.568 (0.474–0.680) <0.0001 0.713 (0.531–0.957) 0.024 0.525 (0.413–0.667) <0.0001
     65–69 0.451 (0.372–0.546) <0.0001 0.690 (0.504–0.944) 0.020 0.358 (0.278–0.461) <0.0001
     70–74 0.362 (0.295–0.444) <0.0001 0.517 (0.369–0.724) 0.000 0.289 (0.221–0.378) <0.0001
     ≥75 0.281 (0.226–0.350) <0.0001 0.371 (0.256–0.538) <0.0001 0.219 (0.165–0.290) <0.0001
    Gender
     Male 1.266 (1.157–1.386) <0.0001 NA NA
     Female 1.000
    Education
     ≤Elementary school 0.269 (0.234–0.310) <0.0001 0.291 (0.231–0.367) 0.000 0.236 (0.175–0.318) <0.0001
     Middle school 0.460 (0.396–0.533) <0.0001 0.416 (0.325–0.533) 0.001 0.438 (0.322–0.597) 0.001
     High school 0.670 (0.580–0.773) <0.0001 0.632 (0.501–0.796) 0.005 0.619 (0.456–0.840) 0.009
     ≥College 1.000 1.000 1.000
    Marital status
     Married 1.099 (1.022–1.182) 0.011 1.081 (0.921–1.269) 0.338 1.006 (0.925–1.095) 0.882
     Single 1.000 1.000 1.000
    No. of interaction with friend
     Never 0.417 (0.376–0.463) <0.0001 0.385 (0.326–0.455) <0.0001 0.488 (0.426–0.559) <0.0001
     3–6 times/y 0.754 (0.675–0.843) <0.0001 0.700 (0.582–0.841) 0.000 0.801 (0.697–0.921) 0.002
     1–2 times/mo 1.084 (0.996–1.181) 0.063 1.034 (0.900–1.187) 0.639 1.131 (1.012–1.263) 0.030
     1–2 times/wk 0.972 (0.906–1.043) 0.432 1.059 (0.933–1.201) 0.375 0.917 (0.843–0.999) 0.047
     Every day 1.000 1.000 1.000
    Income
     Yes 1.306 (1.196–1.426) <0.0001 1.399 (1.234–1.587) <0.0001 1.277 (1.125–1.450) 0.000
     No 1.000 1.000 1.000
    Economic activity
     Yes 1.759 (1.639–1.888) <0.0001 2.392 (2.142–2.672) <0.0001 1.407 (1.280–1.546) <0.0001
     No 1.000 1.000 1.000
    Smoking status
     Never 1.134 (1.029–1.250) 0.012 0.985 (0.874–1.111) 0.808 1.991 (1.621–2.446) <0.0001
     Former smoker 0.920 (0.826–1.024) 0.126 0.863 (0.765–0.975) 0.018 1.345 (0.935–1.936) 0.109
     Smoker 1.000 1.000 1.000
    Alcohol use
     Yes 1.182 (1.097–1.273) <0.0001 1.453 (1.287–1.641) <0.0001 0.983 (0.892–1.082) 0.722
     Former user 0.516 (0.469–0.567) <0.0001 0.558 (0.486–0.642) <0.0001 0.586 (0.504–0.681) <0.0001
     No 1.000 1.000 1.000
    Depressive symptoms
     Yes 0.212 (0.192–0.234) <0.0001 0.210 (0.176–0.251) <0.0001 0.219 (0.194–0.247) <0.0001
     No 1.000 1.000 1.000
    No. of chronic disease
     0 8.180 (7.171–9.331) <0.0001 10.528 (8.466–13.093) <0.0001 6.734 (5.711–7.940) <0.0001
     1 2.763 (2.414–3.162) <0.0001 3.136 (2.508–3.921) <0.0001 2.482 (2.096–2.937) <0.0001
     ≥2 1.000 1.000 1.000
    Year
     2006 0.613 (0.558–0.674) <0.0001 0.558 (0.476–0.653) <0.0001 0.664 (0.590–0.747) <0.0001
     2008 0.570 (0.520–0.626) <0.0001 0.515 (0.441–0.602) <0.0001 0.618 (0.550–0.693) <0.0001
     2010 0.570 (0.520–0.624) <0.0001 0.532 (0.457–0.620) <0.0001 0.607 (0.542–0.679) <0.0001
     2012 1.000 1.000 1.000
    Table 1. General characteristics of the study variables at baseline (2006)

    SRH, self-rated health.

    Weighted %.

    Hypertension, diabetes, arthritis or rheumatoid arthritis, cancer, chronic obstructive pulmonary disease, liver disease, heart disease, cerebrovascular diseases, and mental illness.

    Table 2. Adjusted effect of number of children on self-rated health according to parents

    Bold type is considered statistically significant.

    CI, confidence interval; NA, not applicable.

    Table 3. Adjusted effect of composition of children on self-rated health according to parents

    Bold type is considered statistically significant.

    CI, confidence interval; NA, not applicable.

    TOP