Cut-Off Values for Visceral Fat Area Identifying Korean Adults at Risk for Metabolic Syndrome
Article information

Abstract
Background
Cut-off values for visceral fat area (VFA) measured by computed tomography (CT) for identifying individuals at risk of metabolic syndrome (MetS) have not been clearly established in Korean adults, particularly for large populations. We aimed to identify optimal VFA and waist circumference (WC) cut-off values and compare the ability of VFA and WC to predict the presence of ≥2 metabolic risk factors.
Methods
We included 36,783 subjects aged 19–79 years undergoing abdominal fat CT during regular health checkups between January 2007 and February 2015 in Seoul. The risk factors for MetS except WC were based on the International Diabetes Federation criteria. Receiver operating characteristic curve analyses were used to determine the appropriate VFA and WC cut-off values for MetS.
Results
VFA was a more significant predictor of metabolic risk factors than WC and body mass index (BMI). The optimal cut-off values for VFA and WC were 134.6 cm2 and 88 cm for men and 91.1 cm2 and 81 cm for women, respectively. We estimated age-specific cut-off values for VFA, WC, and BMI. VFA cut-off values increased with age, particularly among women.
Conclusion
This large population study proposed the cut-off values for VFA and WC for identifying subjects at risk of MetS among Korean adults. For more accurate diagnosis, different age-specific cut-off values for VFA and WC may be considered.
INTRODUCTION
Metabolic syndrome (MetS) is defined as a cluster of metabolic abnormalities characterized by central obesity, hypertension, high triglyceride (TG) levels, low high-density lipoprotein cholesterol (HDL-C) levels, and high fasting plasma glucose (FPG) levels. Individuals with MetS have been known to have a higher risk of type 2 diabetes mellitus and cardiovascular disease, and a subsequent increase in disease-related mortality or morbidity [1-4]. Although the pathophysiology of MetS is not fully understood, central obesity is known to be a major cause of insulin resistance and is closely associated with the other four features of MetS by causing an imbalance between adipokines and insulin [5-7]. In 2006, the International Diabetes Federation (IDF) announced a new definition for MetS that included central obesity as an essential element, proposing different waist circumference (WC) cut-offs according to sex and ethnicity, specifically, 90 cm for men and 80 cm for women of South Asian ethnicity [8].
In Korea, the incidence of MetS has increased markedly over the past decades, as in some Western countries [9,10]. Although visceral obesity is known to play an essential role in the development of MetS, the cut-off values for Korean-specific visceral fat area (VFA) and WC have not been clearly defined. In 2007, the Korean Society for the Study of Obesity (KOSSO) recommended ethnically appropriate WC cut-off values of 90 cm for men and 85 cm for women with regard to central obesity [11]. These results were based on the Korea National Health and Nutritional Examination Survey (1998), which included 6,561 adults aged 20–80 years; the employed criteria were consistent with the IDF Asia-Pacific region criteria. However, the KOSSO did not provide the cut-off values for VFA.
WC is widely used to diagnose abdominal obesity because of its ease of measurement. However, it has been reported that insulin resistance is more strongly associated with VFA directly measured by computed tomography (CT) than with WC or body mass index (BMI) [12,13]. Accumulation of visceral fat is recommended to be measured by magnetic resonance imaging or CT, which can distinguish fat from other tissues and allow the measurement of visceral and subcutaneous abdominal fat mass independently with high reproducibility [14]. Furthermore, with aging, fat mass increases progressively and distributes more centrally; accordingly, a number of studies suggest that different VFA cut-offs should be determined according to age [15,16].
In this study, we investigated the appropriate sex- and age-specific cut-off values for VFA as reference values for predicting metabolic risk factors in Korean adults.
METHODS
1. Study Population
This cross-sectional study involved 39,181 subjects (23,728 men and 15,432 women) aged between 19 and 79 years who underwent health check-up tests, including abdominal fat CT, between January 2007 and February 2015 at Seoul National University Hospital Gangnam Center, Seoul, Republic of Korea. For participants undertaking health examinations on more than two occasions, we included only the result of the first examination. Our study excluded participants with a past medical history of any cancer (n=1,429), stroke (n=267), and cardiovascular event or stent insertion (n=702). Finally, 36,783 participants (22,365 men and 14,418 women) were enrolled in this study. Lifestyle factors, such as smoking, alcohol consumption, degree of exercise, marital status, and degree of education, were assessed using a self-report questionnaire. Alcohol consumption was calculated as the amount of drinking per week. Exercise was classified as regular exercise where subjects exercised ≥3 times per week. This study protocol was approved by the Institutional Review Board of Seoul National University Hospital (IRB approval no., H-1608-018-781).
2. Anthropometric Measurements and Blood Tests
Anthropometric measurements of individuals were performed by well-trained nurses. Height and weight were determined using a fixed wall-scale measuring device that measured to the nearest 0.1 cm or 0.1 kg, respectively, using an electronic scale that was calibrated before each measurement. BMI was calculated by dividing weight (kg) by squared height (m2). WC was measured at the end of normal expiration, measuring the minimum circumference at the level of the umbilicus to the nearest 0.5 cm. All subjects had their blood pressure (BP) checked twice after at least 5 minutes of rest in sitting position and were asked to answer questionnaires under the supervision of a welltrained interviewer. Blood samples were collected in the morning after an overnight fast. FPG, total cholesterol, low-density lipoprotein cholesterol, HDL-C, and TG levels were measured enzymatically using the Hitachi 747 chemical analyzer (Hitachi, Tokyo, Japan).
3. Measurement of Abdominal Adipose Tissue Areas Using Computed Tomography Scans
The adipose tissue areas were measured at the level of the umbilicus using a 16-detector row CT scanner (Somatom Sensation 16; Siemens Medical Solutions, Forchheim, Germany) with the subjects in a supine position. A 5-mm-thick umbilical-level abdominal section was obtained using a 16-detector row CT scanner. The cross-sectional area (cm2) of abdominal fat was calculated using Rapidia 2.8 CT software (INFINITT, Seoul, Korea) with attenuation values for the region of interest within a range of −250 to −50 Hounsfield units. The technique used for adipose tissue area measurements with CT cross-sectional images has been previously standardized and validated. The visceral adipose tissue area was defined as intra-peritoneal fat bound by parietal peritoneum or transversalis fascia, and the subcutaneous adipose tissue area was defined as the fat area external to the abdomen and back muscles [17-19].
4. Definition of Metabolic Risk Factors
In this study, we used the following criteria for the definition of MetS proposed by the IDF, excluding WC as a risk factor [8]: systolic BP of ≥130 mm Hg or diastolic BP of ≥85 mm Hg or treatment of previously diagnosed hypertension; FPG level of ≥100 mg/dL or treatment of previously diagnosed type 2 diabetes; TG level of ≥150 mg/dL; HDL-C level of <40 mg/dL for men and <50 mg/dL for women; and a combination of two or more of these metabolic risk factors.
5. Statistical Analysis
Statistical analyses were performed separately for men and women because of known differences in abdominal fat distribution between sexes. Continuous variables were expressed as means and standard deviation, and discrete variables were expressed as proportions. Differences between sexes were determined by the Student t-test. A receiver operating characteristic (ROC) curve analysis was used to develop a cut-off for each anthropometric value associated with the presence of two or more risk factors of MetS, except WC, and to compare the predictive value of VFA, WC, and BMI. We performed subgroup analysis to obtain the age-specific cut-off values. The cut-off values for VFA, WC, and BMI that maximized the Youden index (sensitivity+specificity-1) were defined as optimal. The Youden index is an integrative indicator of sensitivity and specificity [20]. The statistical significance level was set at a probability value of <0.05, and the statistical analyses were performed using STATA ver. 14.0 (Stata Corp., College Station, TX, USA).
RESULTS
1. Subject Characteristics
A total of 36,783 participants (22,365 men and 14,418 women) were included in the analysis. The characteristics of our study population are presented in Table 1. The mean age was approximately 50.8 years in men and 51.7 years in women. The mean VFA, WC, and BMI values were 136.0 cm2, 88.0 cm, and 24.6 kg/m2 for men and 83.0 cm2, 80.6 cm, and 22.3 kg/m2 for women, respectively. The proportion of current smoking and alcohol consumption was significantly higher for men. We found that 8,868 (39.7%) of 22,365 men and 3,090 (21.4%) of 14,418 women had two or more risk factors for MetS according to the IDF criteria, excluding the WC risk factor.
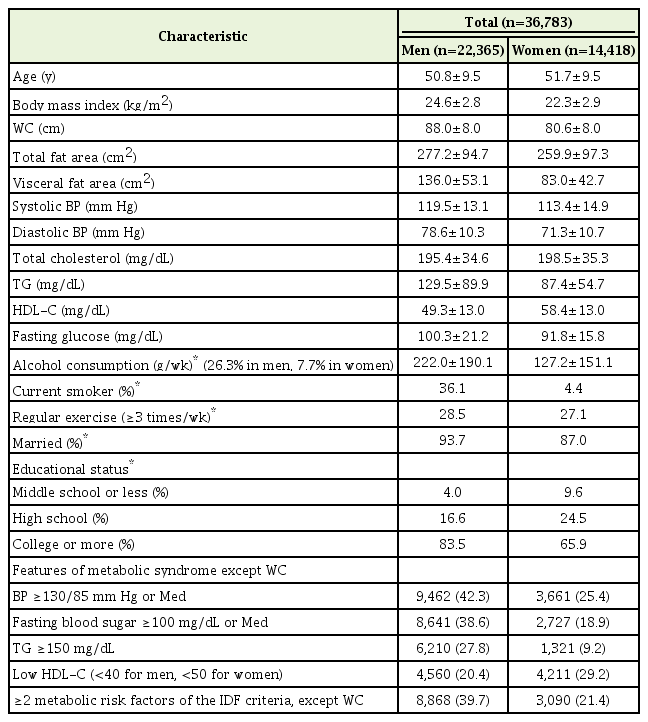
Baseline characteristics of the study population
2. Receiver Operating Characteristic Curve Analysis
Figure 1 presents the age-adjusted ROC curves of VFA, WC, and BMI in men (Figure 1A) and in women (Figure 1B), which were used to identify the presence of ≥2 metabolic risk factors except WC. The area under the ROC curve (AUC) values of VFA, WC, and BMI are presented in Table 2. Among both men and women, the AUC for VFA (men, 0.7004; women, 0.7881) was associated with higher values than that for WC (men, 0.6732; women, 0.7336) or BMI (men, 0.6654; women, 0.7323), suggesting that VFA was a better parameter than WC and BMI for determination of the subjects at risk of developing MetS. The AUC values were greater in women than in men for all metabolic risk factors.
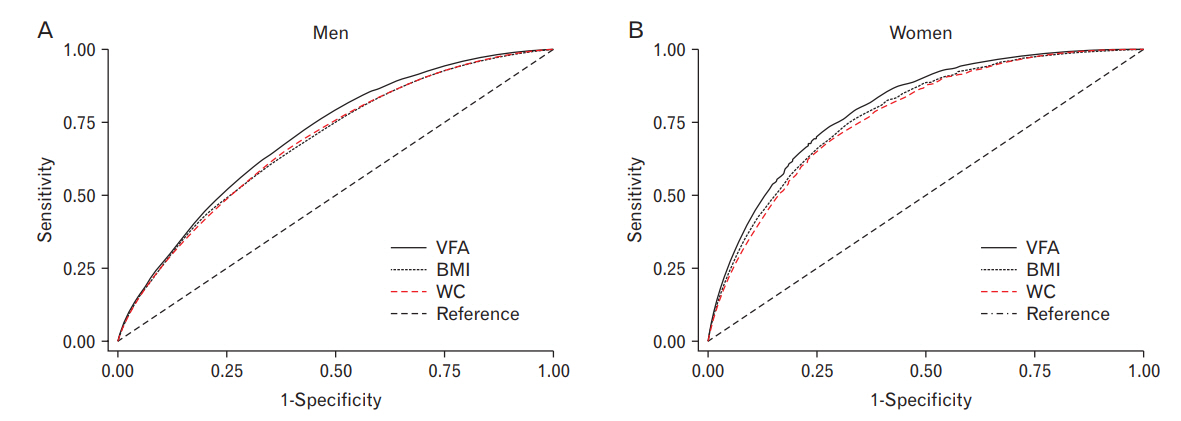
Age-adjusted ROC curves to identify ≥2 metabolic risk factors other than WC. In both men (A) and women (B), the area under the ROC curve values for VFA were shown to be higher values than those for WC and BMI. ROC, receiver operating characteristic; VFA, visceral fat area; WC, waist circumference; BMI, body mass index.
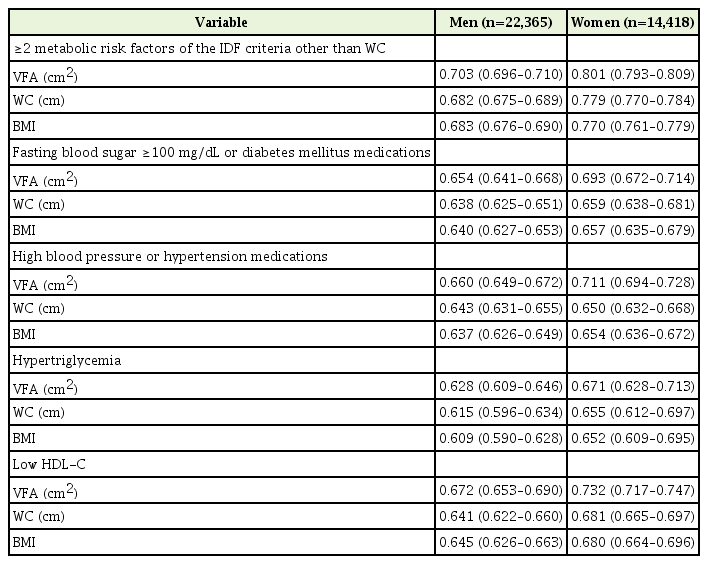
AUC for VFA, WC, and BMI to identify the presence of metabolic risk factors other than WC
3. Cut-Off Values for Visceral Fat Area, Waist Circumference, and Body Mass Index
The optimal cut-off values for VFA, WC, and BMI to identify ≥2 risk factors for MetS, except WC, were 134.6 cm2, 88.4 cm, and 24.7 kg/m2 and for men and 91.1 cm2, 81.0 cm, and 22.4 kg/m2 for women, respectively (Table 3). We estimated the age-specific cut-off values for VFA, WC, and BMI by dividing subjects into the following three groups based on their age: 19–39 years, 40–59 years, and 60–79 years. The VFA cut-off values increased with age, particularly among female subjects (Table 4).

Comparison of the cut-off values for VFA, WC and BMI for identifying metabolic risk factors in the present and previous studies

Age-specific cut-off values of VFA, WC, and BMI for predicting two or more risk factors for metabolic syndrome
DISCUSSION
Our results demonstrated that the optimal VFA cut-off values (134.6 cm2 for men and 91.1 cm2 for women) yielded maximum sensitivity and specificity. Considering our findings, the WC cut-off values were comparable to the IDF criteria for subjects of South Asian ethnicity [8]. The BMI cut-off value was comparable to the World Health Organization (WHO) criteria for men but was lower than the WHO criteria for women (Table 3).
To date, few studies have reported Korean-specific VFA cut-off values. Han et al.[21] performed a cross-sectional, hospital-based study in 276 men and 540 women, who had undergone regular health checkups at general hospitals in Seoul, Republic of Korea. The authors proposed optimal VFA cut-off values of 100 cm2 for men and 70 cm2 for women, which are lower than those calculated in our study groups. The different characteristics of the study population may have contributed to this difference; their study population was younger and the mean VFA was relatively lower than that in our population (Table 5). However, the prevalence of metabolic abnormalities in their study was higher than that in ours. The prevalence of ≥2 metabolic risk factors in the study by Han et al. [21] was 61.6% for men (high BP, 52.9%; high FPG, 57.2%; hyperTG, 53.3%; and low HDL-C, 24.3%) and 33.0% for women (high BP, 34.1%; high FPG, 28.9%; hyperTG, 21.1%; and low HDL-C, 36.5%). This number is higher than the actual prevalence of MetS observed in Korean adults [22]: 30.8% for men (high BP, 39.7%; high FPG, 37.0%; hyperTG, 37.8 %; low and HDL-C, 38.7%) and 26.3% for women (high BP, 26.7%; high FPG, 24.6%; hyperTG, 45.8%; and low HDL-C, 52.6%). Therefore, the cut-off values reported by Han et al. [21] may be excessively low. In contrast, the prevalence of metabolic abnormalities in the present study was similar to the actual prevalence of MetS in Korean adults; consequently, our cut-off values would be more appropriate.
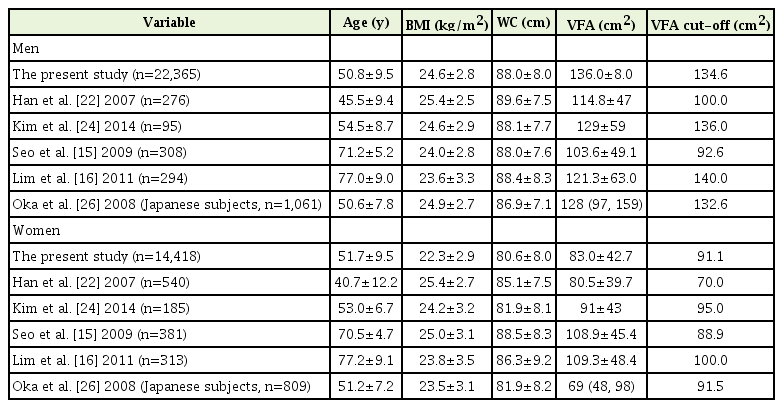
Comparison of the mean age, BMI, WC, and VFA, and cut-off values of VFA in the present and previous study subjects
Kim et al. [23] investigated 280 subjects aged 30–80 years, and their VFA and WC cut-off values were comparable to those reported in our study: VFA=136 cm2 and WC=89 cm for men and VFA=95 cm2 and WC=82 cm for women. Consistent with our study, the mean VFA and the cut-off values were higher than those reported by Han et al. [21] The prevalence of MetS in that study was 28.4% for men and 19.5% for women.
Comparable results have also been reported in Japan, another Northeast Asian country. Since the Japan Society for the study of Obesity proposed a VFA cut-off value of 100 cm2 in 2002, it has been used as the gold standard for the definition of central obesity among Japanese adults [24]. This standard has been widely used, but a number of follow-up studies have been conducted to re-evaluate its efficiency. Oka et al. [25] suggesed that the optimal VFA cut-off value for identifying subjects with ≥2 risk factors for MetS is 132.6 cm2 for men and 91.5 cm2 for women in Japan. In their study, 1,893 subjects were enrolled for a regular medical check-up; of these, 98% subjects were teachers with a high socioeconomic status and high level of education, similar to our study population.
In recent years, studies have been conducted in older populations. Seo et al. [15] chose 689 elderly subjects aged ≥63 years from the Ansan Geriatric cohort, and proposed the following as the optimal cut-off value for predicting the presence ≥2 metabolic risk factors: VFA=92.6 cm2 and WC=86.5 cm for men and VFA=88.9 cm2 and WC=86.5 cm for women. Lim et al. [16] recruited 294 men and 313 women aged ≥65 years who participated in the Korean Longitudinal Study on Health and Aging. The optimal cut-off values for predicting MetS in their study were as follows: VFA=140 cm2 and WC=87 cm for men and VFA=100 cm2 and WC=85 cm for women.
Because previous studies have been performed in small populations and studies including the elderly have reported different cut-off values, we conducted an additional analysis to obtain cut-off values depending on age (Table 4). The variation in age-related cut-off values for VFA was greater than that for WC and BMI, and the cut-off values also increased with age. This result is in line with the “paradox of obesity,” indicating that obesity is associated with premature death in adults, but obesity either has no effect or is beneficial to the extension of life in elderly people aged over 65 years [26]. In addition, recent studies have suggested that the diagnostic criteria for obesity, such as BMI, WC, and waist-to-hip ratio, used in general adults are not appropriate for the elderly. Hayashi et al. [27] and Yumi et al. [28] have reported the need for different age-specific cut-off values. Yumi et al. [28] examined 11,561 Japanese men and women who participated in the Hitachi Health Study. The authors found lower VFA cut-off values among men aged less than 40 years (<40 years versus ≥40 years; 86.4 cm2 versus 103.9 cm2) and insisted that if the same cut-off value is used regardless of age, the sensitivity for subjects under the age of 40 years would be relatively lower than that in other age groups.
In our study, the AUC for women was larger than that for men across all age groups. This finding can be explained by the fact that men tend to have other MetS risk factors, which are not used as diagnostic criteria for MetS, such as smoking, alcohol consumption, and stress. Therefore, the contribution of VFA to the multiple risk factors of MetS may be relatively smaller in men than in women [28].
The present study has some limitations. First, this study involved subjects regularly undergoing health check-ups, who are relatively more concerned with health and are likely to be managing their health well on their own. Further, the study subjects had a relatively high socioeconomic status and most of them lived in an urban area. Thus, there are limitations regarding the representativeness and generalizability of the research findings. Second, due to the cross-sectional nature of our study, our analysis could not reflect changes over time. Further studies are needed to prospectively examine the association between the accumulation of visceral fat and the presence of risk factors. Third, subjects who were diagnosed and treated with hypertension and diabetes were identified using a self-report questionnaire. Thus, it was difficult to confirm the presence of medical conditions as these were largely self-reported. To reduce such disadvantages, we reviewed the questionnaires for the use of medicines and checked the drug names provided by subjects in the questionnaires. Fourth, thyroid hormone abnormalities and menstrual status that could affect the study result were not included owing to the limitation of a self-report questionnaire.
To the best of our knowledge, this is the largest study to propose VFA cut-off values for the Korean population. We suggest that VFA values higher than the cut-off value of 134.6 cm2 for men and 91.1 cm2 for women are risk factors for predicting MetS that could result in cardiovascular disease or type 2 diabetes mellitus. Future prospective studies are needed to validate the association between the optimal WC/VFA cut-off values and the incidence of or mortality resulting from cardiovascular diseases.
Notes
No potential conflict of interest relevant to this article was reported.
Acknowledgements
This work was supported by the Technology Innovation Program (10050154, Business Model Development for Personalized Medicine Based on Integrated Genome and Clinical Information) funded by the Ministry of Trade, Industry and Energy (MI, Korea).