Korean J Fam Med Search

CLOSE


Korean J Fam Med > Volume 39(5); 2018 > Article
Kim, Ok, Choi, and Joo: The Cutoff Pericardial Adipose Tissue Volume Associated with Metabolic Syndrome

Abstract

Background

Metabolic syndrome (MS) is a well-known risk factor of cardiovascular diseases that is focused on central obesity. Recent studies have reported the association between pericardial adipose tissue (PAT) volume and MS. However, no studies have demonstrated the cutoff PAT volume that represents the best association with MS.

Methods

The data of 374 subjects were analyzed cross-sectionally to compare PAT, measured on coronary multidetector computed tomography, and various metabolic parameters according to MS. After PAT volumes were divided into tertiles, various metabolic parameters were compared among tertiles; furthermore, the odds ratio for developing MS was calculated. Finally, we demonstrated the cutoff PAT volume that represented the best association with MS by using the receiver-operating characteristic curve.

Results

We found that 27.5% of the subjects had MS, and the mean PAT volume was 123.9 cm3. PAT showed a significant positive correlation with body mass index, waist circumference, and levels of glucose, triglyceride, high-sensitivity C-reactive protein, uric acid, and homocysteine, but a negative correlation with high-density lipoprotein cholesterol. Furthermore, after dividing into tertiles, PAT volume was also significantly associated with various metabolic parameters. The odds ratio for having MS was 4.19 (95% confidence interval, 2.27–7.74) in the top tertile of PAT volumes after adjusting for age, sex, and smoking. The cutoff PAT volume that represented the best association with MS was 142.2 cm3.

Conclusion

PAT was significantly associated with MS and various metabolic parameters. The cutoff PAT volume of 142.2 cm3 showed the best association with MS.

INTRODUCTION

Metabolic syndrome (MS) involves multiple medical conditions, including central obesity, high blood pressure, hyperglycemia, hypertriglyceridemia, and low high-density lipoprotein (HDL) level [1]. Therefore, MS threatens human health by increasing the risks of cardiovascular disease (CVD) and diabetes mellitus [2,3]. In Korea, the prevalence of MS is increasing owing to the westernization of eating patterns and physical inactivity [4,5]. To date, the most convincing pathogenesis of MS is the result of increased insulin resistance due to excessive visceral fat accumulation [6,7].
The pericardial adipose tissue (PAT) is located in the pericardium and is a type of visceral fat that has attracted much attention from many researchers in recent years [8,9]. Several studies on PAT have focused on the relationship between PAT volume and heart disease [10-12]. In addition, some studies have shown that PAT volume is associated not only with CVD but also with metabolic diseases [13-15]. These results indicate that the correlation between PAT volume and MS was studied in multiple areas. One of these studies was the ARIRANG study, which showed that the incidence of MS was significantly increased with increasing PAT thickness in Korean men [16]. However, domestic studies that focus on the relationship between PAT volume and MS are still lacking. Furthermore, no cutoff PAT volume has been reported yet in relation to MS. The purpose of this study was to clarify the association between PAT volume and MS, and to cross-sectionally demonstrate the cutoff PAT volume in relation to MS.

METHODS

1. Subjects and Data Collection

We included the data of 405 subjects with available cardiac computed tomography (CT) scans collected in the Samsung branch office of Chaum Health Promotion Center between 2010 and 2014. We excluded the data of 31 subjects who had CVDs (cardiac arrest, coronary artery disease, ischemic heart disease, stroke, and other definite diseases of cardiovascular origin). We analyzed the data of the remaining 374 subjects. The data included age, height, smoking, metabolic parameters (waist circumference [WC]; blood pressure; levels of cholesterol, glucose, uric acid, high-sensitivity C-reactive protein [hsCRP], and homocysteine; visceral fat area [VFA]), and PAT volume. This study was approved by the Institutional Review Board of Ajou University and Boondang-CHA Hosptial after informed consent (AJIRB-MEDMDB-16-268, CHAMC 2016-10-020).

2. Measurement

1) Definition of metabolic syndrome

MS is defined as a clustering of at least three of the following five metabolic alterations: central obesity, high blood pressure, hyperglycemia, hypertriglyceridemia, and low HDL level. Metabolic alteration, which was included in the criteria for diagnosis of MS, was determined on the basis of the criteria set out in the National Cholesterol Education Program [17].

2) Body proportion and blood samples

The data included medical history and lifestyle habits, which were obtained using a self-administered questionnaire. In case of females, menopausal status was also documented, which was defined as natural cessation of menstruation for >12 months or cessation of menstruation by hysterectomy. Physical examinations, including body weight, height, and WC, were performed by a trained examiner who followed a standardized procedure (measured in the standing position, without shoes). Blood pressure was also measured after resting for 10 minutes in a sitting position by using an automatic sphygmomanometer. Body mass index (BMI) was calculated as weight in kilograms divided by the square of height in meters. Current smokers were defined as those who had smoked >5 packs of cigarettes during their lifetimes and were currently smoking; past smokers, as those who had smoked in the past but had quit; and non-smokers, as those who had no history of smoking. Blood samples for assessing fasting glucose and lipids, hsCRP, uric acid, and homocysteine levels were drawn from the antecubital area in the morning. Serum samples were stored at 4°C and analyzed within 1 day of sampling. VFA was also measured using Bio Impedance Analysis (Inbody 720; Biospace Ltd., Seoul, Korea).

3) Measurement of pericardial adipose tissue

Epicardial fat was defined as any adipose tissue located within the pericardium; and paracardial fat, as any adipose tissue situated on the external surface of the parietal pericardium. Pericardial fat was defined as epicardial fat plus paracardial fat. For the measurement of PAT, a 128-slice CT scanner (GE Light Speed VCT; GE Imatran, San Francisco, CA, USA) was utilized. The scan parameters were as follows: 25-mm slice thickness, 120-kV tube voltage, and 120-mAs tube current. To define PAT volume, −190 to −30 HU measured using the CT scanner was applied. The superior cutoff point in the axial slices was the bifurcation of the pulmonary artery. Inferiorly, the volume analyzed was segmented up to the intra-abdominal adipose tissue. The anterior border was defined using the anterior chest wall; and the posterior border, by the esophagus and descending aorta. The region of interest containing the heart and surrounding adipose tissue was assessed using manual tracing of the axial images. Measurement of PAT was performed by counting the number of pixels in these areas. Tissue with mean attenuation plus or minus 2 standard deviation (SD)s was considered to be the VFA [18-20].

3. Statistical Analyses

The general characteristics of the study subjects, including age, height, weight, WC, metabolic parameters (blood pressure, fasting glucose, lipids, hsCRP, uric acid, and homocysteine levels, and VFA), and PAT volume, are described as mean±SD. For evaluating the correlation between PAT volume and the other metabolic parameters, the partial correlation method was used after adjustment for sex. The skewed data (TG, hsCRP, and homocysteine levels) were log transformed. Analysis of variance was used to compare the difference in metabolic parameters according to the tertiles of PAT volumes. Significant metabolic parameters were then further analyzed using post hoc analysis. To determine the odds ratio (OR) for having MS according to PAT tertile, logistic regression was performed. Finally, we used the receiver operating characteristic (ROC) curve to calculate the cutoff PAT volume associated with the presence of MS. All statistical analyses were performed via SPSS ver. 11.0 for Windows (SPSS Inc., Chicago, IL, USA), and statistical significance was considered at P-values of <0.05.

RESULTS

Of the 374 subjects, 72 were female (19.3%) and 27.5% had MS. The patients’ mean age, BMI, WC, and PAT volume were 54.1 years, 24.9 kg/m2, 88.4 cm, and 123.9 cm3, respectively (Table 1).
PAT volume was positively associated with age; height; weight; BMI; WC; levels of glucose, triglyceride, hsCRP, uric acid, and homocysteine; and VFA. PAT volume showed a negative correlation with HDL-cholesterol level (Table 2). After the PAT volumes were divided into tertiles, various metabolic parameters, which showed significant correlation among themselves, were compared. According to the increase in PAT tertile, age, height, weight, BMI, WC, triglyceride level, uric acid level, homocysteine level, and VFA were significantly higher than those in the low PAT volume tertile. By contrast, HDL-cholesterol level was significantly lower in the higher PAT volume tertile (Table 3). To clarify the further association, we calculated the OR for developing MS according to PAT tertile after adjustment for age, sex, and smoking. Without adjustment, the OR (95% confidence interval [CI]) for developing MS was 3.55 (1.98–6.35) in the top tertile as compared with the first PAT volume tertile. After adjustment, the OR (95% CI) was 4.19 (2.27–7.74) in the top tertile. However, after additional adjustment for BMI, the OR (95% CI) was 1.82 (0.91–3.63) and showed no significant difference (Table 4).
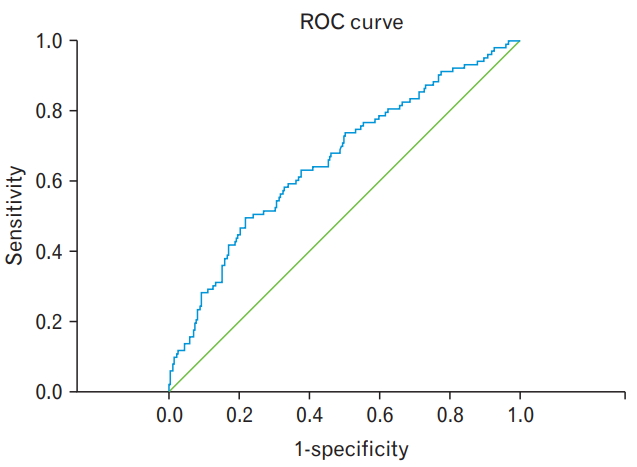
Finally, we calculated the cutoff PAT volume according to the presence of MS by using the ROC curve. The ROC curve showed maximum association between a PAT volume of 142.2 cm3 and MS (sensitivity, 0.495 and 1-specificity, 0.218) (Figure 1, Supplement Table 1).

DISCUSSION

On evaluating the association of PAT volume and various metabolic parameters with MS, we found that PAT volume showed a significant positive association with metabolic parameters and MS, except HDL-cholesterol level. Furthermore, we calculated the cutoff PAT volume to be 142.2 cm3, which showed the best association with MS.
Many of the previous studies focused on the risk of CVD according to PAT volume in people with preexisting MS [21-23]. However, several studies have addressed the direct link between PAT volume and MS. The ARIRANG study measured epicardial adipose tissue (EAT) thickness on echocardiography [16]. The incidence of MS increased significantly with increasing EAT thickness in men after adjusting for various confounding variables, but no clear correlation was found in women. However, this study showed that EAT thickness measured on echocardiography could be used as an index for predicting the incidence of MS in men.
Park et al. [13] discussed the relationship between PAT volume and MS by using echocardiography for measuring EAT thickness. The result of their study showed that EAT thickness was significantly greater in patients with MS than in those without MS, but the ability of EAT thickness to predict MS was found to be strong only in the group that had a BMI of <27 kg/m2. The relationship between EAT thickness and MS was also demonstrated in the ROC curve, but the cutoff value was not discussed in the study.
Another study, by Ormseth et al. [24], also found a connection between PAT volume and MS in patients with rheumatoid arthritis. This study calculated EAT volume and calcium score for the carotid artery on CT. They showed that EAT volume was associated with multiple factors (insulin resistance, triglyceride level, current smoking, and homocysteine level), which have already been shown to be strongly associated with MS.
Various studies have consistently shown that PAT volume is associated with MS [25-28]. The result of our research was in line with those of the previous studies. In our study, we demonstrated that PAT volume significantly correlated with the prevalence of MS after adjusting for confounding variables. In addition, we determined a significant cutoff PAT volume for a possible relationship with MS. This is the main difference between our study and the previous studies, which only showed the relationship between PAT volume and MS.
One of the strengths of our research is the method of measuring PAT volume. In most studies, echocardiography was used to measure PAT volume owing to its convenience and low cost [28-30]. However, the measurement of PAT thickness on ultrasonography has a limitation in obtaining total PAT volume accurately [31]. Nevertheless, our study accurately measured the total PAT volume on CT; therefore, we could calculate the PAT volume for evaluating its association with MS. Analysis of data from the general population, though not relatively large enough, is another strong point of this study as compared with other studies. Most existing studies had limitations in representing the general population because they were performed in special populations of subjects with preexisting CVDs or other diseases.
However, our research has some limitations. One limitation is that the causal relationship between PAT volume and MS could not be inferred because of the cross-sectional design of our study. Second, our study data were not large enough to represent the association in the general population. Third, various confounding factors were not adjusted for in this study. In addition, the OR of developing MS in the top PAT tertile group showed no statistical significance (OR, 1.82; 95% CI, 0.91–3.63) after adjusting for age, sex, smoking, and BMI. Even though our results had no statistical significance, we carefully considered their marginal significance. BMI critically impacts PAT volume but did not show statistical significance after additional BMI adjustment. Finally, the conclusion is limited to clinical application because of the cost-effectiveness, radiation exposure, and convenience of CT. Nonetheless, this is the first study to evaluate the cutoff PAT volume in subjects with MS.
In conclusion, PAT volume was significantly associated with MS and various metabolic parameters, including BMI, WC, and triglyceride and HDL levels. In addition, the cutoff PAT volume of 142.2 cm3 showed the best association with MS. Further prospective well-designed studies are needed in the near future to reveal the exact association between PAT and MS.

Notes

No potential conflict of interest relevant to this article was reported.

Supplementary Materials

Supplementary materials can be found via https://doi.org/10.4082/kjfm.17.0027.
Supplementary Table 1.
The sensitivity and 1-specificity values based on the ROC curve and area under the ROC curve.
kjfm-17-0027-suppl.pdf

Figure. 1.
ROC curve of pericardial adipose tissue volume according to the presence of metabolic syndrome. This ROC curve shows the maximum association between pericardial adipose tissue volume (142.2 cm3, P<0.001) and metabolic syndrome at the point of sensitivity (0.495) and 1-speicificity (0.218). ROC curve, receiver operating characteristic curve.
kjfm-17-0027f1.jpg
Table 1.
General characteristics of the study group (n=374)
Characteristic MS(−) (n=271) MS(+) (n=103) P-value
Age (y) 54.7±10.2 52.8±8.7 0.100
Females 53 (19.6) 19 (18.4) 0.808
Height (cm) 167.2±7.9 170.0±7.8 0.002
Weight (kg) 68.1±11.3 77.4±11.0 <0.001
Body mass index (kg/m2) 24.3±2.8 26.6±2.6 <0.001
Pericardial adipose tissue volume (cm3) 116.9±38.0 142.3±47.2 <0.001
Waist circumference (cm) 86.4±7.7 93.6±7.4 <0.001
Glucose (mg/dL) 93.1±20.3 112.4±26.2 <0.001
Systolic blood pressure (mm Hg) 122.0±11.6 128.4±10.4 <0.001
Diastolic blood pressure (mm Hg) 79.7±8.8 84.3±8.5 <0.001
Total cholesterol (mg/dL) 203.5±35.0 208.0±37.6 0.278
Triglyceride (mg/dL) 118.6±58.6 218.6±88.5 <0.001
Low-density lipoprotein cholesterol (mg/dL) 128.7±31.1 126.0±31.6 0.468
High-density lipoprotein cholesterol (mg/dL) 53.6±12.3 43.2±9.1 <0.001
High-sensitivity C-reactive protein (mg/dL) 0.15±0.33 0.13±0.12 0.601
Uric acid (mg/dL) 5.6±1.3 5.9±1.4 0.057
Homocysteine (µmol/L) 11.3±4.6 10.8±2.6 0.334
Visceral fat area (cm3) 90.6±28.7 109.5±25.3 <0.001

Values are presented as mean±standard deviation or number (%).

MS, metabolic syndrome.

Table 2.
Correlation between pericardial adipose tissue and other metabolic syndrome-related factors
Factors r* P-value
Age (y) 0.184 0.001
Height (cm) 0.159 0.004
Weight (kg) 0.459 <0.001
Body mass index (kg/m2) 0.459 <0.001
Waist circumference (cm) 0.535 <0.001
Glucose (mg/dL) 0.153 0.006
Systolic blood pressure (mm Hg) 0.019 0.742
Diastolic blood pressure (mm Hg) 0.000 0.999
Total cholesterol (mg/dL) −0.032 0.575
Triglyceride (mg/dL) 0.313 <0.001
Low-density lipoprotein cholesterol (mg/dL) −0.033 0.562
High-density lipoprotein cholesterol (mg/dL) −0.234 <0.001
High-sensitivity C-reactive protein (mg/dL) 0.195 <0.001
Uric acid (mg/dL) 0.222 <0.001
Homocysteine (µmol/L) 0.174 0.002
Visceral fat area (cm3) 0.362 <0.001

* Partial correlation coefficient after sex adjustment.

Values from after log transformation.

Table 3.
Comparison of the MS-related factors among the 3 PAT tertile groups
Variable T1 (n=127) T2 (n=125) T3 (n=122) P-value
PAT volume (cm3) 81.8±15.6 119.8±10.6 171.8±30.7 <0.001
MS cases 22 (5.9) 29 (7.8) 52 (13.9) <0.001
Age (y) 52.4±9.2 54.8±9.5 55.4±10.4* 0.034
Height (cm) 166.5±7.8 167.4±8.0 170.2±7.5*,† <0.001
Weight (kg) 65.1±11.0 70.3±11.0 76.8±10.8*,† <0.001
Body mass index (kg/m2) 23.4±2.7 24.9±2.6 26.4±2.6*,† <0.001
Waist circumference (cm) 83.6±7.2 88.3±6.9 93.5±7.5*,† <0.001
Glucose (mg/dL) 94.6±19.5 99.5±26.6 101.4±24.0 0.061
Triglyceride (mg/dL) 124.3±75.8 144.1±80.4 170.9±82.0*,† <0.001
High-density lipoprotein cholesterol (mg/dL) 55.1±13.1 50.2±11.8 46.8±10.8 <0.001
High-sensitivity C-reactive protein (mg/dL) 0.11±0.15 0.14±0.19 0.19±0.44 0.065
Uric acid (mg/dL) 5.3±1.2 5.6±1.2 6.1±1.5*,† <0.001
Homocysteine (µmol/L) 10.2±3.0 11.3±3.7 12.1±5.3* 0.002
Visceral fat area (cm3) 85.0±28.1 95.4±26.5 107.6±28.1*,† <0.001

Values are presented as mean±standard deviation or number (%). P-values were obtained using analysis of variance.

MS, metabolic syndrome; PAT, pericardial adipose tissue.

The superscripted letters indicate the groups with higher values and P-values of <0.05 in the post hoc analysis: *comparison between T1 and T3; comparison between T2 and T3; and comparison between T1 and T2.

Table 4.
ORs of the prevalence of metabolic syndrome among the 3 pericardial adipose tissue tertile groups
Variable OR1 (95% CI) OR2 (95% CI) OR3 (95% CI)
T1 (36.1–101.9) 1 1 1
T2 (102.5–138.3) 1.44 (0.78–2.68) 1.59 (0.80–2.31) 1.09 (0.55–2.15)
T3 (138.7–301.8) 3.55 (1.98–6.35) 4.19 (2.27–7.74) 1.82 (0.91–3.63)

OR1, crude OR; OR2, adjusted for age, sex, and smoking; OR3, adjusted for age, sex, smoking, and body mass index

OR, odds ratio; CI, confidence interval.

REFERENCES

1. Grundy SM, Cleeman JI, Daniels SR, Donato KA, Eckel RH, Franklin BA, et al. Diagnosis and management of the metabolic syndrome: an American Heart Association/National Heart, Lung, and Blood Institute Scientific Statement. Circulation 2005;112:2735-52.
crossref pmid
2. Hubert HB, Feinleib M, McNamara PM, Castelli WP. Obesity as an independent risk factor for cardiovascular disease: a 26-year follow-up of participants in the Framingham Heart Study. Circulation 1983;67:968-77.
crossref pmid
3. Meigs JB, Wilson PW, Fox CS, Vasan RS, Nathan DM, Sullivan LM, et al. Body mass index, metabolic syndrome, and risk of type 2 diabetes or cardiovascular disease. J Clin Endocrinol Metab 2006;91:2906-12.
crossref pmid pdf
4. Yamaoka K, Tango T. Effects of lifestyle modification on metabolic syndrome: a systematic review and meta-analysis. BMC Med 2012;10:138.
crossref pmid pmc pdf
5. Shin A, Lim SY, Sung J, Shin HR, Kim J. Dietary intake, eating habits, and metabolic syndrome in Korean men. J Am Diet Assoc 2009;109:633-40.
crossref pmid
6. Tatsumi Y, Nakao YM, Masuda I, Higashiyama A, Takegami M, Nishimura K, et al. Risk for metabolic diseases in normal weight individuals with visceral fat accumulation: a cross-sectional study in Japan. BMJ Open 2017;7:e013831.
crossref pmid pmc
7. Usui C, Asaka M, Kawano H, Aoyama T, Ishijima T, Sakamoto S, et al. Visceral fat is a strong predictor of insulin resistance regardless of cardiorespiratory fitness in non-diabetic people. J Nutr Sci Vitaminol (Tokyo) 2010;56:109-16.
crossref pmid
8. Arpaci D, Gurkan Tocoglu A, Yilmaz S, Ergenc H, Tamer A, Keser N, et al. The relationship between epicardial fat tissue thickness and visceral adipose tissue in lean patients with polycystic ovary syndrome. J Ovarian Res 2015;8:71.
crossref pmid pmc
9. Ghaderi F, Eshraghi A, Shamloo AS, Mousavi S. Assosiation of Epicardial and pericardial fat thickness with coronary artery disease. Electron Physician 2016;8:2982-9.
crossref pmid pmc
10. Matloch Z, Kotulak T, Haluzik M. The role of epicardial adipose tissue in heart disease. Physiol Res 2016;65:23-32.
crossref pmid
11. Rosito GA, Massaro JM, Hoffmann U, Ruberg FL, Mahabadi AA, Vasan RS, et al. Pericardial fat, visceral abdominal fat, cardiovascular disease risk factors, and vascular calcification in a community-based sample: the Framingham Heart Study. Circulation 2008;117:605-13.
crossref pmid
12. Kim TH, Yu SH, Choi SH, Yoon JW, Kang SM, Chun EJ, et al. Pericardial fat amount is an independent risk factor of coronary artery stenosis assessed by multidetector-row computed tomography: the Korean Atherosclerosis Study 2. Obesity (Silver Spring) 2011;19:1028-34.
crossref pmid
13. Park JS, Ahn SG, Hwang JW, Lim HS, Choi BJ, Choi SY, et al. Impact of body mass index on the relationship of epicardial adipose tissue to metabolic syndrome and coronary artery disease in an Asian population. Cardiovasc Diabetol 2010;9:29.
crossref pmid pmc
14. Chen O, Sharma A, Ahmad I, Bourji N, Nestoiter K, Hua P, et al. Correlation between pericardial, mediastinal, and intrathoracic fat volumes with the presence and severity of coronary artery disease, metabolic syndrome, and cardiac risk factors. Eur Heart J Cardiovasc Imaging 2015;16:37-46.
crossref pmid pdf
15. Pierdomenico SD, Pierdomenico AM, Cuccurullo F, Iacobellis G. Meta-analysis of the relation of echocardiographic epicardial adipose tissue thickness and the metabolic syndrome. Am J Cardiol 2013;111:73-8.
crossref pmid
16. Lee JH, Kim JY, Kim KM, Lee JW, Youn YJ, Ahn MS, et al. A prospective study of epicardial adipose tissue and incident metabolic syndrome: the ARIRANG study. J Korean Med Sci 2013;28:1762-7.
crossref pmid pmc
17. National Cholesterol Education Program (NCEP) Expert Panel on Detection and Treatment of High Blood Cholesterol in Adults (Adult Treatment Panel III). Third report of the National Cholesterol Education Program (NCEP) Expert Panel on Detection, Evaluation, and Treatment of High Blood Cholesterol in Adults (Adult Treatment Panel III) final report. Circulation 2002;106:3143-421.
crossref pmid
18. Sjostrom L, Kvist H, Cederblad A, Tylen U. Determination of total adipose tissue and body fat in women by computed tomography, 40K, and tritium. Am J Physiol 1986;250(6 Pt 1):E736-45.
crossref pmid
19. Kvist H, Chowdhury B, Sjostrom L, Tylen U, Cederblad A. Adipose tissue volume determination in males by computed tomography and 40K. Int J Obes 1988;12:249-66.
pmid
20. Yoshizumi T, Nakamura T, Yamane M, Islam AH, Menju M, Yamasaki K, et al. Abdominal fat: standardized technique for measurement at CT. Radiology 1999;211:283-6.
crossref pmid
21. Aydin H, Toprak A, Deyneli O, Yazici D, Tarcin O, Sancak S, et al. Epicardial fat tissue thickness correlates with endothelial dysfunction and other cardiovascular risk factors in patients with metabolic syndrome. Metab Syndr Relat Disord 2010;8:229-34.
crossref pmid
22. Sengul C, Cevik C, Ozveren O, Oduncu V, Sunbul A, Akgun T, et al. Echocardiographic epicardial fat thickness is associated with carotid intima-media thickness in patients with metabolic syndrome. Echocardiography 2011;28:853-8.
crossref pmid
23. Sengul C, Duman D. The association of epicardial fat thickness with blunted heart rate recovery in patients with metabolic syndrome. Tohoku J Exp Med 2011;224:257-62.
crossref pmid
24. Ormseth MJ, Lipson A, Alexopoulos N, Hartlage GR, Oeser AM, Bian A, et al. Association of epicardial adipose tissue with cardiometabolic risk and metabolic syndrome in patients with rheumatoid arthritis. Arthritis Care Res (Hoboken) 2013;65:1410-5.
crossref pmid pmc
25. Yorgun H, Canpolat U, Hazirolan T, Ates AH, Sunman H, Dural M, et al. Increased epicardial fat tissue is a marker of metabolic syndrome in adult patients. Int J Cardiol 2013;165:308-13.
crossref pmid
26. Momesso DP, Bussade I, Epifanio MA, Schettino CD, Russo LA, Kupfer R. Increased epicardial adipose tissue in type 1 diabetes is associated with central obesity and metabolic syndrome. Diabetes Res Clin Pract 2011;91:47-53.
crossref pmid
27. Iacobellis G, Sharma AM. Epicardial adipose tissue as new cardiometabolic risk marker and potential therapeutic target in the metabolic syndrome. Curr Pharm Des 2007;13:2180-4.
crossref pmid
28. Iacobellis G, Ribaudo MC, Assael F, Vecci E, Tiberti C, Zappaterreno A, et al. Echocardiographic epicardial adipose tissue is related to anthropometric and clinical parameters of metabolic syndrome: a new indicator of cardiovascular risk. J Clin Endocrinol Metab 2003;88:5163-8.
crossref pmid pdf
29. Pierdomenico SD, Pierdomenico AM, Neri M, Cuccurullo F. Epicardial adipose tissue and metabolic syndrome in hypertensive patients with normal body weight and waist circumference. Am J Hypertens 2011;24:1245-9.
crossref pmid pdf
30. Mazur A, Ostanski M, Telega G, Malecka-Tendera E. Is epicardial fat tissue a marker of metabolic syndrome in obese children? Atherosclerosis 2010;211:596-600.
crossref pmid
31. Sicari R, Sironi AM, Petz R, Frassi F, Chubuchny V, De Marchi D, et al. Pericardial rather than epicardial fat is a cardiometabolic risk marker: an MRI vs echo study. J Am Soc Echocardiogr 2011;24:1156-62.
crossref pmid


ABOUT
ARTICLE CATEGORY

Browse all articles >

BROWSE ARTICLES
INFORMATION FOR AUTHORS AND REVIEWERS
Editorial Office
Room 2003, Gwanghwamun Officia, 92 Saemunan-ro, Jongno-gu, Seoul 03186, Korea
Tel: +82-2-3210-1537    Tax: +82-2-3210-1538    E-mail: kjfm@kafm.or.kr                

Copyright © 2024 by Korean Academy of Family Medicine.

Developed in M2PI

Close layer
prev next