A Randomized Clinical Trial of Synbiotics in Irritable Bowel Syndrome: Dose-Dependent Effects on Gastrointestinal Symptoms and Fatigue
Article information

Abstract
Background
This double-blind, randomized controlled design study aimed to assess the dose-dependent effects of synbiotics on gastrointestinal symptoms of and fatigue in irritable bowel syndrome (IBS).
Methods
Thirty subjects with IBS were randomly assigned into the following three groups and received 2 capsules a day for 8 weeks: (1) high-dose (2 capsules of synbiotics); (2) low-dose (1 capsule of synbiotics and 1 capsule of placebo); and (3) placebo (2 capsules of placebo). At baseline and 8 weeks, they completed the study questionnaires.
Results
Two subjects in the high-dose group were lost to follow-up, leaving a total of 28 patients for the analysis. After 8 weeks, abdominal discomfort, abdominal bloating, frequency of formed stool, fatigue Visual Analog Scale (VAS), and Multidimensional Fatigue Inventory were significantly different among the groups (P=0.002, 0.006, 0.007, 0.028, and 0.041, respectively, by Kruskal-Wallis test). However, only abdominal discomfort, abdominal bloating, frequency of formed stool, and fatigue VAS were significantly improved in the high-dose group compared with those in the placebo group (P=0.002, 0.003, 0.002, and 0.013, respectively) by Mann-Whitney test with Bonferroni correction. No adverse drug reactions were reported.
Conclusion
High-dose synbiotics were superior to placebo in improving bowel symptoms and fatigue of IBS patients, suggesting that synbiotic dosage plays an important role in the treatment of IBS.
INTRODUCTION
Irritable bowel syndrome (IBS) is a functional gastrointestinal (GI) disorder characterized by abdominal pain, abdominal discomfort, and altered bowel habits [1]. The prevalence of IBS is reported as approximately 5%–10% of the general population with a female predominance in South Korea [2]. It has a negative impact on health-related quality of life and induces high health costs in Asian populations as well as Western countries [3].
Although the precise etiology of IBS is still unknown, emerging evidence suggests that gut flora play a pathological role [4,5]. The corollary to this theory is the possible benefit of probiotics for IBS symptoms, and several meta-analyses have concluded that probiotics containing specific strains do improve the global symptoms of IBS and abdominal pain [6,7]. Therefore, recent interest has focused on agents such as proand prebiotics whose actions are confined to the lumen, with a perceived low likelihood of unwanted systemic effects in IBS patients. In theory, certain pro- and prebiotics, at a correct dose with the appropriate formulation, can help restore the balance of the intestinal microbiota, leading to better digestive and intestinal function and possibly improved GI symptoms. A mixture of probiotics and prebiotics, namely synbiotics or symbiotics, should exert a synergistic benefit by enhancing the probiotic organisms with a selective and co-administered prebiotic substrate. Increased consumption of synbiotic supplements may also have synergistic or potentiating effect in terms of health benefits. However, data regarding the dose-response relationship between synbiotics and IBS symptoms are scarce. In addition, because disruption of gut microbial balance may aggravate quality of life in IBS, supplementation with synbiotics may help resolve fatigue symptoms in IBS patients.
Thus, we investigated the dose-response effects of synbiotic supplementation on bowel symptoms and fatigue in IBS patients.
METHODS
1. Study Design and Subjects
This study was a single-center, randomized, double-blind, and placebo-controlled clinical trial. Among the subjects who visited the health promotion center of Ajou University Hospital from June 2015 to October 2015, those who met the Rome III criteria for IBS were enrolled in this study (Figure 1). IBS patients aged ≥19 years were recruited, and initial screening included medical history taking, physical examination, and laboratory testing. We excluded subjects who met one of the following conditions: subjects with organic GI disease such as inflammatory bowel disease and a history of gluten intolerance (celiac disease); subjects taking antibiotics, synbiotics (including probiotics only), or any other drug that could influence bowel function within 1 month of consumption; the subjects with previous abdominal surgery except for appendectomy; pregnant or breastfeeding females; subjects with evidence of other organic, metabolic, or psychiatric diseases that could impact compliance as well as those with poor medication compliance.
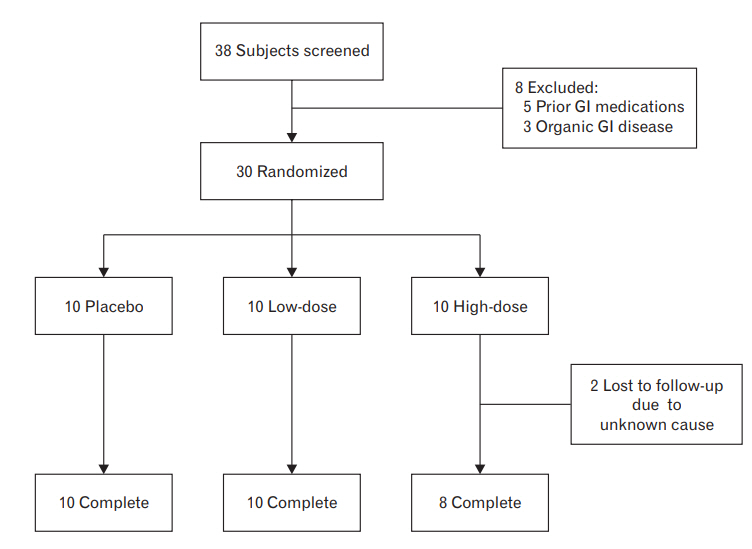
Study flow diagram. GI, gastrointestinal.
Of the 38 subjects who underwent the screening process, eight applicants were excluded according to the inclusion/exclusion criteria. Therefore, 30 subjects were initially enrolled in the study; of these, 28 subjects completed this study, as two were withdrawn for unknown reasons.
All the subjects completed an informed consent form before participating in the study, and the study was conducted after obtaining approval from the institutional review board of Ajou University Hospital (AJIRB-MED-DRU-14-317). This study was conducted in compliance with the standards of the Declaration of Helsinki and current ethical guidelines.
2. Study Protocol & Randomization
The subjects were randomly assigned at a 1:1:1 ratio to the high-dose, low-dose, or placebo groups according to block randomization. We did not control any variables during randomization. The patients, investigators, doctors, and study nurses were blinded using randomization codes, which were kept confidential until the end of data analysis. The placebo group took 2 capsules of placebo, the low-dose group received 1 capsule of placebo and 1 capsule of synbiotics, and the highdose group received 2 capsules of synbiotics. The study drugs were administered once a day for 8 weeks. All patients filled in fatigue and bowel symptom questionnaires at the first and last visit. After 4 weeks of the study, all subjects were revisited and their physical condition, vital signs, study compliance, and adverse events were evaluated. Their laboratory test results, study compliance, and adverse events were then re-checked after the completion of 8 weeks of the study. During the entire study period, all patients were prohibited from consuming yogurt or taking pre- or probiotic pills or other GI drugs.
3. Sample Size Estimation
The size of the study sample was not based on a power calculation owing to the absence of reliable calculation data about synbiotics in IBS. Instead, it was considered adequate to characterize a potential effect with sufficient accuracy based on previous experience gained through similar studies [8-10]. In other words, the previous two studies were performed with 25 subjects and 24 subjects with a double-blind randomized design, respectively [8,10]. In another single-blind randomized controlled trial (RCT) of 30 patients that investigated the effects of probiotics on intestinal permeability in IBS [9], the authors estimated that the sample size of 30 patients had a power of 80% to detect a difference of 30% in the proportion of increased small bowel permeability between the placebo and the probiotics group after treatment at the significance level of 5% with a low dropout rate (<5%).
4. Synbiotics & Placebo Preparation
The investigational drug was Ultra-Probiotics-500, supplied by B&A Health Products Inc., Los Angeles, CA, USA. Each capsule contains 10 billion colony-forming units of probiotic bacteria comprising six strains of Lactobacillus (rhamnosus, acidophilus, casei , bulgaricus, plantarum, and salivarius) and two strains of Bifidobacterium (bifidum and longum). Each capsule also contains 175 mg of fructooligosaccharides, 150 mg of Ulmus davidiana (Slippery elm bark powder), 10 mg of Geum urbanum (herb bennet) powder, and 100 mg of inulin powder as prebiotics. The placebo was encapsulated in the same material as the synbiotic capsule, and the content of the capsule was manufactured such that it could not be distinguished by taste or color.
5. Data Collection
1) Blood sampling
Blood samples were drawn after midnight fasting. We checked the complete blood cell count and tested liver function by examining the levels of aspartate aminotransferase (AST), alanine aminotransferase (ALT), and gamma-glutamyltranspeptidase (GGT) and renal function by assessing the levels of blood urea nitrogen (BUN) and creatinine.
2) IBS Symptom Questionnaire
The primary endpoints included severity of the Visual Analog Scale (VAS) scores for IBS individual symptoms such as abdominal discomfort, abdominal bloating, frequency of formed stool, epigastric soreness, and nausea. The VAS symptom scores consisted of a 10-point scale, with 0 indicating no symptoms and 10 indicating very severe or very frequent symptoms. The adjectival scales for stool consistency (Bristol Stool Form Scale) were recorded as numerical values [11]. The data on the VAS scores of individual symptoms were summarized as the mean and standard deviation in each treatment group.
3) Fatigue Questionnaire
To assess the degree of fatigue symptoms in IBS patients, we used the Fatigue Severity Scale (FSS) [12]. The FSS contains nine items, each of which is ranked for degree of severity using a scale of 1 (none) to 7 (very severe); the score is the average of the nine items. We also used the fatigue VAS to assess the degree of global fatigue, using a scale of 0 (no fatigue) to 10 (very severe fatigue). Additionally, we used the 20-item Multidimensional Fatigue Inventory (MFI) as a self-report instrument for measuring degree of fatigue severity [13]. It addresses the following dimensions: general fatigue, physical fatigue, mental fatigue, reduced motivation, and reduced activity. All the items were scored on a 5-point Likert scale ranging from 1 (yes, that is true) to 5 (no, that is not true). Subscale scores (range, 4–20) were calculated as the sum of item ratings, and the total fatigue scores (range, 20–100) were calculated as the sum of subscale scores, with higher scores indicating a higher level of fatigue.
6. Statistical Analysis
The data were examined using intention-to-treat (ITT) and per-protocol (PP) analyses. For the ITT analysis, all data from the study subjects were included. For missing or incomplete data, the most recently available data were used for a last-observation-carried-forward (LOCF) analysis. For the PP analysis, only the data obtained from the subjects who completed the study on schedule were included, and the analysis was performed only when the data were available at weeks 0 and 8. Of the 30 subjects who enrolled in the study, two subjects were withdrawn (from the high-dose group) and none were omitted due to noncompliance. All side effects were reported and noted in detail, regardless of their relevance to the study drug.
Descriptive statistics and a frequency analysis were performed to describe the clinical characteristics of the study subjects. We used the Wilcoxon signed rank test to calculate the difference in clinical variable scores between the baseline and after the study within the groups. Then, we used the Kruskal-Wallis test for the comparison of mean clinical characteristics scores between the three groups at baseline and the end of the study (placebo, low-dose, and high-dose groups). We also performed the Kruskal-Wallis test to compare the differences in variables from baseline at 8 weeks among the groups. A P-value <0.05 was considered to indicate statistical significance. For variables with a significant difference between the three groups in the Kruskal-Wallis test at the end of study, we performed the Mann-Whitney test with Bonferroni correction. According to Bonferroni correction of the three groups, P-values <0.017 were considered to indicate statistical significance. Subsequently, we used the Spearman rank correlation test to establish the dose–response trends. All analyses were carried out using IBM SPSS ver. 19.0 (IBM Corp., Armonk, NY, USA).
RESULTS
1. Baseline Characteristics
Table 1 shows the baseline clinical characteristics of the study subjects in the 3 groups by PP analysis (n=28). Overall, the mean age of the study population was 50±8.6 years, the median age was 50.5 years, and 53.6% of the study population was female. The average duration of IBS was 11±9.5 years, and the main subtype was the diarrheal subtype at 71.4% (constipation subtype was 21.4%, mixed subtype was 7.1%). The average abdominal discomfort score was 5.4±1.7, abdominal bloating score was 5.6±2.2, fatigue VAS was 4.5±1.9, and MFI was 89.3±13.1.

Baseline characteristics of the study subjects (n=28)
There were no significant differences between the three groups with respect to gender, abdominal discomfort, abdominal bloating, frequency of formed stool, epigastric soreness, and nausea; only the age of the subjects showed differences (P=0.086, 0.286, 0.255, 0.384, 0.506, 0.399, and 0.020, respectively). The differences in age (and gender proportion, even it was not significant) at baseline were considered a random error due to the small numbers of subjects in each study group. In addition, there were no significant differences between the groups in terms of baseline biochemistry characteristics, including white blood cell count, hemoglobin, platelet count, AST, ALT, GGT, BUN, and creatinine (P=0.231, 0.452, 0.612, 0.893, 0.115, 0.569, 0.492, and 0.500). All these values were within the normal range. The mean FSS, VAS, and MFI scores were not significantly different between the groups at baseline (P=0.609, 0.256, and 0.438).
2. Changes in Variables after Intervention
Abdominal discomfort, abdominal bloating, fatigue VAS, and MFI in the low-dose and high-dose groups were significantly improved after intervention (P=0.005, 0.007, 0.008, and 0.008 in the low-dose group; P=0.010, 0.011, 0.012, and 0.011 in the high-dose group, respectively), but not in the placebo group (P=0.271, 0.180, 0.196, and 0.681) by PP analysis. Frequency of formed stool showed a significant difference in the placebo, low-dose, and high-dose groups after intervention (P=0.005, 0.007 and 0.010) by PP analysis. In the ITT with LOCF analysis (the high-dose group only), none of these variables showed any significant difference, including abdominal discomfort (P=0.059) and frequency of formed stool (P=0.066). In the Kruskal-Wallis test, abdominal discomfort, abdominal bloating, frequency of formed stool, fatigue VAS, and MFI showed statistical significance (P=0.002, 0.006, 0.007, 0.028, and 0.041) in all three groups at 8 weeks (Table 2). However, after the Mann-Whitney test with Bonferroni correction, abdominal discomfort, abdominal bloating, frequency of formed stool, and fatigue VAS showed significant improvement in the high-dose group only (P=0.002, 0.003, 0.002, and 0.013) compared to the placebo group (Table 3). A statistically significant difference in FSS was not found between the groups at 8 weeks (P=0.115). In the ITT with LOCF analysis, none of the differences were statistically significant. The differences in five variables, abdominal discomfort, bloating, frequency of formed stool, fatigue VAS, and MFI, from baseline at 8 weeks also showed no statistical significance among the groups by PP analysis (P=0.497, 0.253, 0.125, 0.194, and 0.967, respectively). Furthermore, there were no significant differences between the groups at 8 weeks with respect to white blood cell count and levels of hemoglobin, platelet count, AST, ALT, GGT, BUN, and creatinine (P=0.116, 0.382, 0.144, 0.720, 0.359, 0.701, 0.186, and 0.181 by PP analysis).

Clinical variables of the study subjects at the last visit, 8 weeks after baseline (n=28)

Comparison of clinical variables between study groups at 8 weeks (n=28)
3. Correlations between Study Groups and Variables after Intervention
Correlations between study groups and variables after intervention were determined by Spearman’s rank correlation test (Table 4). Abdominal discomfort, abdominal bloating, formed stool frequency, fatigue VAS, and MFI showed significant correlations with the 3 study groups by PP analysis (r=-0.668, P<0.001; r=-0.604, P=0.001; r=0.605, P=0.001; r=-0.513, P=0.005; and r=-0.408, P=0.031, respectively). In the ITT with LOCF analysis, there were no significant correlations.

Spearman’s correlation analysis between study groups at 8 weeks (n=28)
4. Safety Assessment
In this clinical trial, there were no reports of any significant adverse events during the study or any subjects experiencing either serious adverse events or withdrawal due to adverse events.
DISCUSSION
The present randomized, double-blind, and placebo-controlled study showed no significant dose-dependent clinical effects of synbiotics in IBS. However, significant positive effects of high-dose synbiotics on GI symptoms and fatigue were observed in IBS patients. In addition, the mean changes in abdominal discomfort, abdominal bloating, frequency of formed stool, fatigue VAS, and MFI scores showed a trend toward a dose-response relationship.
Recent studies have revealed many beneficial effects of probiotics or synbiotics on human health, especially the positive effects of probiotics on bowel symptoms in IBS patients [6-10,14,15]. In addition, emerging data have demonstrated the relationship between gut microorganisms and the nervous system, known as the gut–brain axis [16]. A recent study elucidated that alteration of the intestinal microbiota, mucosal barrier disruption, and intestinal immune cell dysfunction collectively contribute to the pathogenesis of chronic fatigue syndrome [17]. Thus, administration of synbiotics can improve symptoms of fatigue as well as GI symptoms in IBS patients. Our study demonstrated that high-dose synbiotics were superior to placebo in improving the symptoms of IBS and fatigue.
To date, the exact pathogenesis of IBS remains unknown, but several mechanisms have been suggested to explain the efficacy of synbiotics in IBS, such as the influence of the intestinal luminal environment, the maintenance of epithelial and mucosal barrier function, and the modulation of the mucosal or systemic immune system including both innate and adaptive immune systems [10,18]. First, the restoration of a normal gut microbial environment may improve GI symptoms. Decreased normal gut flora and increased pathogenic microbiota have been found in IBS patients [19]. Such microbial imbalance erodes gut defense mechanisms and increases bacterial translocation, leading to diarrhea, bloating, and other GI symptoms [20]. Since synbiotics are effective in the restoration of normal gut flora and the defense against pathogenic organisms, it is possible that synbiotics will exert positive effects on symptoms via the recovery of the normal bowel environment in IBS. Second, the anti-inflammatory capability of synbiotics should be considered. A previous in vitro study has elucidated that synbiotics decrease inflammation in IBS [21]. Moreover, chronic inflammation is considered an important contributing factor to bowel symptoms. For example, inflammatory cytokines are increased in IBS patients and may be associated with GI symptoms [22]. In ulcerative colitis, increased inflammation reflects disease activity and correlates with severity of symptoms [23]. Inflammatory cytokines inhibit normal bowel functions, including water re-absorption by colonic villi, and bowel dysfunction may trigger bowel symptoms [24]. Therefore, the anti-inflammatory effects of synbiotics may result in improved GI symptoms in IBS patients.
The present study showed significant improvement in fatigue VAS after an 8-week treatment period with high-dose synbiotics. Fatigue may be considered in relation to gut microorganisms because gut microbial disruption induces biochemical and genetic changes in the brain associated with psychiatric conditions including anxiety and depression [25]. Indeed, administration of probiotics significantly reduces the recovery time from fatigue after forced swimming in rats [17]. However, until now, there exist only few data on the effect of synbiotics on fatigue in human studies; therefore, the precise role of synbiotics in IBS-related mental problems should be investigated in the future.
In our data, only high-dose synbiotics were associated with significant improvement in IBS symptoms and fatigue compared with placebo. Previous studies on the optimal dose of synbiotics in IBS consist of four RCTs [14,15,26,27]. Of these, three studies indicated positive results and one showed a negative result. This discrepancy may be due to variations in inclusion criteria for the subjects, sample size, study design, and synbiotic dosage [28]. Of these heterogeneous factors, our study suggests that dosage plays an important role in the therapeutic effects of IBS. This finding may also be supported by our data. Although no significant dose-dependent clinical effects of synbiotics were observed, a trend toward a dose-response relationship was observed.
Our study has some limitations. First, since the sample size of the current study was small, we used nonparametric analysis. In addition, we were unable to perform subgroup analysis by IBS subtypes because of the small sample size. A large-scale prospective study should be performed to investigate the efficacy of synbiotics on bowel symptoms and fatigue in IBS subtypes. Second, the direct measurement of fecal microbial levels for the restoration of normal flora after synbiotic supplementation has not been performed. However, in previous studies, it has been shown that probiotics and prebiotics were able to modify the gut flora in healthy volunteers [29,30]. Finally, an 8-week study period may be too short to confirm the long-term benefits and side effects of synbiotics.
Otherwise, our study is another well-designed RCT examining the efficacy and safety of synbiotics in IBS that used fatigue scales to assess the degree of fatigue symptoms in IBS. Moreover, our study has the strength of being the first to evaluate the dose-response relationship between synbiotics and gut symptoms and fatigue in IBS.
In summary, this study indicates that high-dose synbiotics containing Lactobacillus, Bifidobacterium, and fructooligosaccharides are effective and safe for the treatment of abdominal discomfort, abdominal bloating, formed stool frequency, and fatigue symptoms in IBS. In addition, although were no significant dose-dependent clinical effects of synbiotics were noted, a trend toward a dose-response relationship was demonstrated. In the future, further large-scale studies to determine the association between optimal dosage of synbiotics and IBS are warranted.
Notes
No potential conflict of interest relevant to this article was reported.
Acknowledgements
This paper was supported by Wonkwang University in 2017.