Association between Hand Grip Strength and Self-Rated Health in Middle- and Old-Aged Korean Citizens
Article information

Abstract
Background
To investigate the relationship between hand grip strength (HGS) and self-rated health in middleand old-aged Korean subjects.
Methods
The data used for this study were derived from the Korean Longitudinal Study of Aging. A total of 9,132 participants were enrolled using the year 2006 as the baseline, with additional data collected throughout the followup period until 2016. Chi-square test and generalized estimating equation regression models were used for data analysis. HGS was measured in a sitting position with the elbow fixed at 90° on both sides using a dynamometer, and calculated using the values measured from both sides. Relative HGS was measured by dividing HGS by the subject’s body mass index. Self-rated health was assessed with the question “How would you rate your current health in general?” and answers were categorized as “excellent,” “moderate,” or “poor.”
Results
HGS was shown to be inversely associated with self-rated health (odds ratio [OR], 0.94; 95% confidence interval [CI], 0.93–0.94; P<0.0001). Patients aged 65 years or older with lower scores were more likely to report poor self-rated health. Similar results were obtained with relative HGS (OR, 0.40; 95% CI, 0.36–0.45; P<0.0001), but standard HGS had better model fitting (quasi-likelihood under independence model criteria=33,890).
Conclusion
HGS may be considered an index for the diagnosis of sarcopenia and may also affect self-rated health, which is a multidimensional indicator of an individual’s health status and can identify patients who may require special attention.
INTRODUCTION
Sarcopenia is defined as a gradual decline in muscle mass and strength due to aging, and is considered an important health problem in elderly populations [1,2]. For people over 50 years old, muscle mass is reported to decline at an annual rate of approximately 1 to 2% [3], while muscle strength declines at 1.5% per year and accelerates to as much as 3% per year after the age of 60 [4,5]. However, measuring muscle strength in large populations can be a complex and costly challenge [6], Among the various methods for muscle strength measurement, testing hand grip strength (HGS) is quick, simple, and cost-effective. Furthermore, HGS is widely used in diagnostic algorithms for sarcopenia [1,7]. Decreased HGS has been reported as a powerful predictor of dysfunction [8], falls [9], hospitalization [10], disease morbidity and mortality [11], and low quality of life [12], Therefore, the consequences of reduced HGS are likely to result in severe disability, aging, and other health restrictions.
Recently, the Sarcopenia Project of the Foundation for National Institutes of Health suggested a new approach for diagnosing sarcopenia that takes into consideration the ratio between skeletal muscle and body mass index (BMI) rather than height or weight [2]. A previous study reported that the inconsistencies observed between several studies that analyzed the relationship between HGS and risk factors for metabolic syndrome could be attributed to the adjustment, or lack thereof, for weight during data analysis [13]. Relative HGS, which is defined as HGS divided by BMI, served as an index to evaluate muscle strength in clinical and health studies [14]. In a cross-sectional study that assessed the risk for decreased mobility in healthy older adults, individuals in the lowest and middle tertiles of relative HGS were more likely to have a lower mobility score [15].
Self-rated health (SRH) is a general indicator of health-related quality of life (HRQoL), and is defined as the current state of physical and mental health perceived by an individual or group [16]. SRH is subjectively assessed as a measure of multidimensional health status, including health behavior, and varies according to sociodemographic and physical health characteristics. In previous studies, poor SRH was associated with a reduction in capacity for activities of daily living [17], and was found to be a strong predictor of morbidity and mortality [18]. SRH was also associated with increased hospitalizations and the need for outpatient care in elderly populations [19]. However, the mechanisms underlying these associations are not clear [20].
Therefore, the authors hypothesized that HGS, an effective diagnostic tool for sarcopenia, which is a major cause of decreased physical function in the elderly, is associated with SRH. We also analyzed the relationship between relative HGS, which is calculated by dividing HGS by BMI, and poor SRH in middle- and old-aged Koreans.
METHODS
1. Data Source
The data used for this study were derived from the Korean Longitudinal Study of Aging (KLoSA) in 2006, 2008, 2010, 2012, 2014, and 2016. KLoSA gathered data to prepare the elderly population for future system reforms and to guide policy decision-making.
In KLoSA, respondents are repeatedly examined every 2 years to allow the observation of target variables at various points in time. Thus, this study has the strengths of both cross-sectional and time-series data. Data from this study are composed of seven categories: population, family, health, employment, income, wealth, and subjective and life expectation. This biennial survey involves multistage stratified sampling based on geographical locations and housing types across Korea. Participants were selected randomly using a multistage, stratified probability sampling design to create a nationally representative sample of community-dwelling Koreans aged 45 years or older. Participant selection was performed by the Korea Labor Institute for these rapidly growing populations and included individuals from both urban and rural areas. In cases where there was a refusal to participate, a different subject was selected from an additional, similar sample from the same district. Out of all the publicly available data in Korea, KLoSA was considered as the most suitable for analysis in the current study. In this study, a total of 9,132 participants were enrolled after excluding those with missing data for the variables of interest (Figure 1). KLoSA data, save for the subjects’ personal information, is publicly available and can be downloaded from the employment survey site. This study was therefore exempted by the Institutional Review Board as it is not harmful to the subjects and guarantees their anonymity and confidentiality.
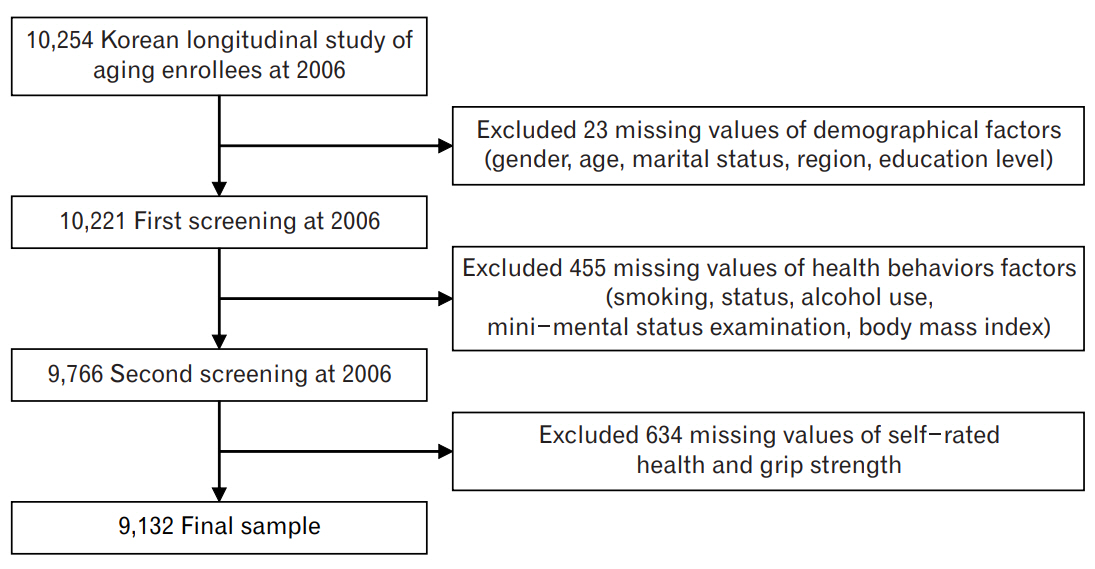
Flow chart of sample selection in this study.
2. Independent Variable
HGS was measured by a handgrip dynamometer (model number, NO6103; Manufacturer: Tanita Corp., Tokyo, Japan). The test was performed in a sitting position with the elbow fixed at 90° on both sides. The mean HGS was calculated from grip strength on both sides. If subjects could not perform the grip test with one hand, the value from the other hand was used for the analysis [21]. Relative HGS was defined as HGS divided by BMI.
3. Dependent Variable
The questions for SRH, which is a dependent variable in this study, was based on the responses of participants in the KLoSA study. SRH was assessed with the question “How would you rate your current health in general?” The five response categories were: “excellent”, “good”, “fair”, “poor”, and “very poor”. Responses were dichotomized by grouping the answers “good” and “fair” in the “moderate” category, while “poor” and “very poor” were grouped in the “poor” category.
4. Control Variable
Other factors that affect SRH in middle- and old-aged participants were considered in this study, including education level, gender, age, marital status, region of residence, national health insurance, the presence and number of chronic comorbid diseases, mini-mental status examination (MMSE), smoking status, alcohol use, labor, physical activity, and chronologic year. Chronic diseases analyzed in this study include hypertension, diabetes, cancer, chronic obstructive pulmonary disease, liver disease, cardiovascular disease, cerebrovascular disease, and arthritis.
5. Statistical Analysis
Chi-square test and generalized estimating equation (GEE) regression models were used to analyze data in this study. In GEE, proc genmod was used together with link logit, distribution normal. GEE was used to handle unbalanced data with correlated outcomes and reported SRH as the outcome. Covariates of interest from all subjects were added to the model to determine their effects on the probability of reporting poor SRH. To determine the probability of changes regarding the subject’s SRH over time, the chronologic year was included in the model as a categorical covariate; the regression coefficient was then used to estimate both the probability of changes in SRH and changes in independent variables annually [22]. SAS statistical software package ver. 9.4 (SAS Institute Inc., Cary, NC, USA) was used in all analyses made. All statistical tests were two-tailed, with the null hypothesis rejected if P<0.05.
RESULTS
Table 1 shows the general characteristics of the subjects in 2006. The mean±standard deviation (SD) HGS and relative HGS of all subjects were 26±8.7 kg and 1.11±0.38 kg, respectively. The mean±SD HGS and relative HGS by SRH of the “moderate” group (27±8.4 kg and 1.18±0.37 kg) was significantly higher than the “poor” group (21±7.6 kg and 0.91±0.35 kg). Additionally, the proportion of poor SRH responses was observed to increase with older age and lower MMSE scores.
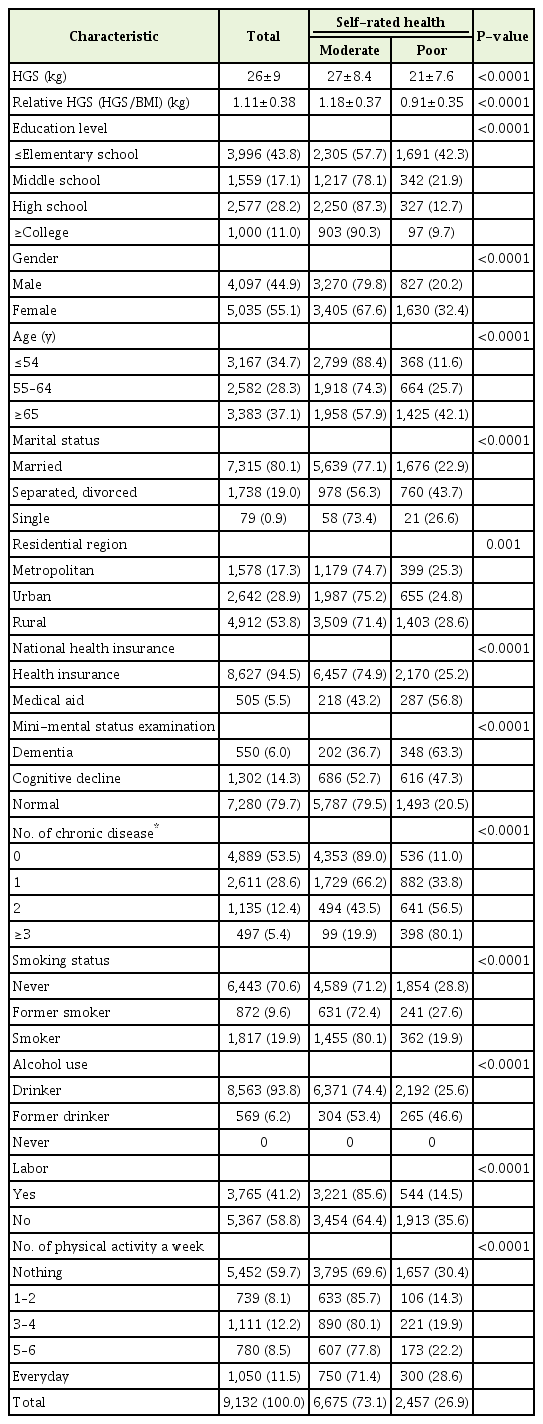
General characteristics of subjects included for analysis (2006)
Table 2 shows the relationship between HGS and poor SRH after controlling for variables such as demographics, cognitive status, presence of chronic illness, and health behaviors. Higher HGS was inversely correlated with an increased likelihood of having poor SRH in both groups under and over 65 years of age (odds ratio [OR] per kilogram increase in grip strength, 0.94; 95% confidence interval [CI], 0.93–0.94; P<0.0001). After stratifying the results by age, OR for poor SRH was found to be 0.94 (OR per kilogram increase in grip strength, 0.94; 95% CI, 0.93–0.94; P<0.0001) and 0.95 (OR per kilogram increase in grip strength, 0.95; 95% CI, 0.94–0.96; P<0.0001) in subjects older than 65 years and in those younger than 65 years of age, respectively. The GEE model’s quasi-likelihood under independence model criteria (QIC) goodness of fit statistic is listed in each table below. The QIC value was determined to be 33,890 (model 1); smaller values indicate a better fit.
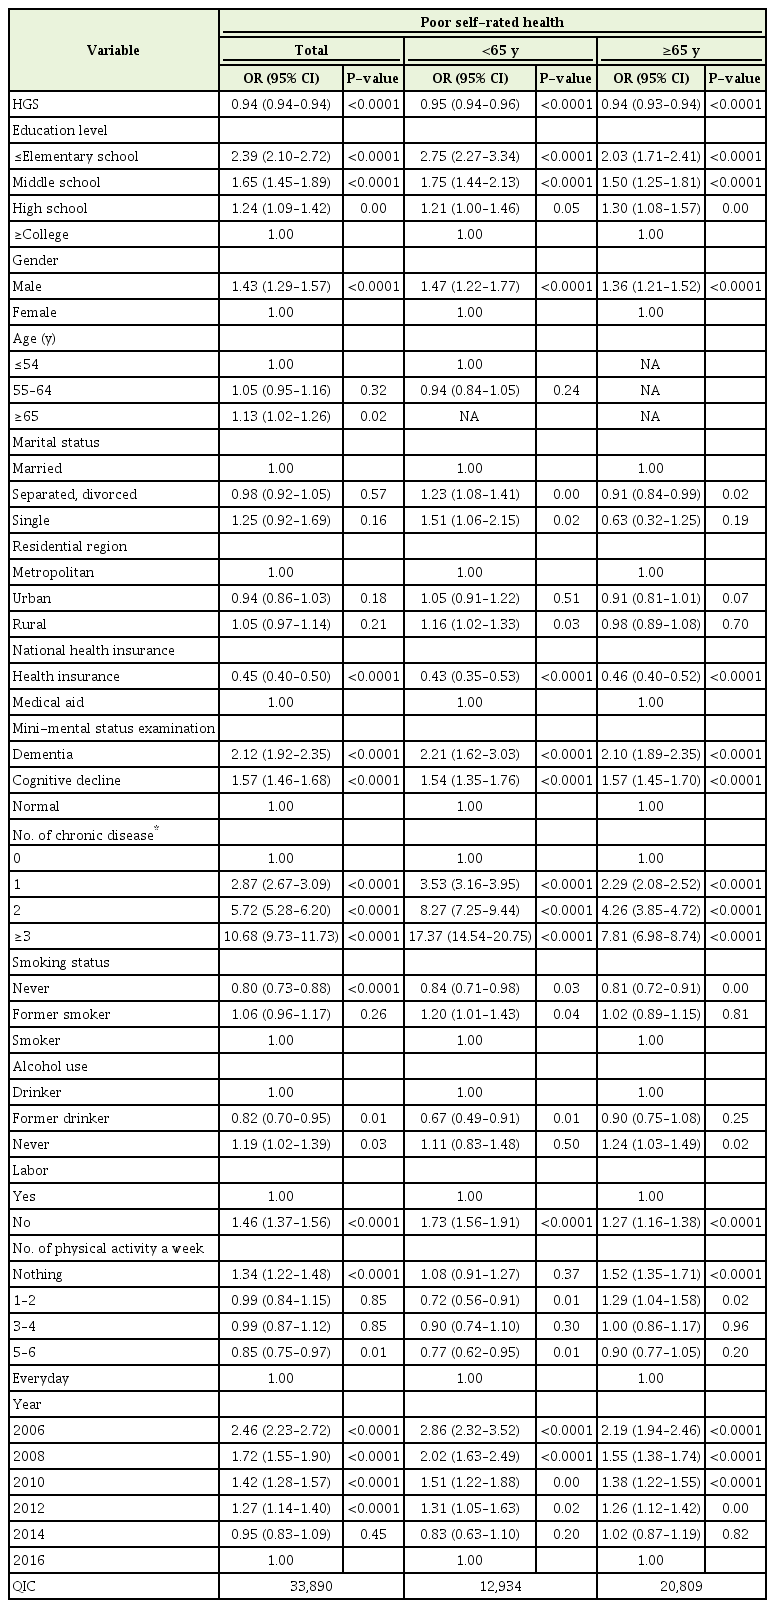
Adjusted effect of association between HGS and poor self-rated health (model 1)
Table 3 shows the relationship between relative HGS (HGS/BMI) and poor SRH. ORs for poor SRH were found to significantly decrease as the relative HGS increased (OR for poor SRH per SD, 0.40; 95% CI, 0.36–0.45; P<0.0001). Furthermore, the ORs for poor SRH were significantly lower in groups 65 years and older than in those under 65 years (OR for poor SRH per SD, 0.38; 95% CI, 0.34–0.44; P<0.0001); these findings are similar to the results of model 1. The GEE model’s QIC goodness of fit statistic was 34,193 (model 2).

Adjusted effect of association between relative HGS and poor self-rated health (model 2)
DISCUSSION
This study was conducted to analyze the relationship between HGS and SRH using data from KLoSA. Because HGS does not consider individual body size measuring muscle strength, the relationship between relative HGS (HGS/BMI) and SRH was also examined [13]. The results of the study showed that higher HGS is associated with lower poor SRH. Particularly, subjects with low HGS that are 65 years or older were more likely to report poor SRH; the findings for relative HGS were found to be similar. Furthermore, analysis of the model fit showed that model 1 (HGS-poor SRH) was more appropriate than model 2 (relative HGS-poor SRH).
The findings of this study can be explained by the results of previous studies [6,23]. HGS in mid-life is predictive of the presence of functional limitations and disability after 25 years. Furthermore, a strong association between HGS, morbidity, and overall mortality has been found [23]. The negative health consequences of due to decreased HGS can naturally lead to limitations in physical activity. In a cross-sectional study that examined the relationship between physical activity and SRH [6], good SRH was directly associated with higher levels of physical activity and greater muscle strength. Therefore, the decrease in HGS in the middle-aged population may lead to limitations in physical activity, which may have subsequent negative impacts on the individual’s SRH.
Our results are consistent with previous studies that found lower HGS to be associated with reduced HRQoL in older men and women [24]. In one previous study, 2,987 community-dwelling men and women aged 59–73 years of age were analyzed to assess the relationship between HGS and HRQoL using the eight domain scores of the 36-item Short-Form Health Survey questionnaire. The results of this study showed that men and women with lower HGS were significantly more likely to report poor general health even after adjusting for age, body size, physical activity, and known comorbidities. Furthermore, in a study of 34,129 adults aged 50 years and older in six low- and middleincome countries (Mexico, Russia, China, South Africa, India, and Ghana), lower HGS was significantly associated with 1.45 (OR, 1.45; 95% CI, 1.12–1.88) times higher odds for depression after adjusting for potential confounders [25]. The results of these two studies are consistent with our findings.
The results of our study suggest that higher HGS is associated with a decreased likelihood of reporting poor SRH. This suggests that a decline in physical functionality in elderly populations can be avoided, as was shown by previous studies [23,26]. Decreased physical functionality is a major cause of decreased muscle strength, which results in increased morbidity [27] and mortality [28], as well as higher rates of disability and greater medical costs [29]. Sarcopenia, the reduction of muscle mass and strength that occurs with aging, is widely considered as a major cause of disability in older persons [30]. HGS is also known to be a useful, costeffective clinical marker of sarcopenia, and many studies are currently being undertaken to validate its use [31]. The results of this study show that lower grip strength increases the likelihood of poor SRH and may help to support the results of previous studies that demonstrate the relationship between poor SRH and impairments in physical functioning in the elderly [23,26].
In our study, relative HGS was used as an independent variable for analysis. It has recently been recommended to adjust for BMI in muscle health studies [2] to prevent discrepancies such as those found in studies that examined the association between HGS and metabolic syndrome [15]. Our findings were similar to results regarding HGS and SRH, and all were statistically significant. However, the results are somewhat different from that of previous studies that analyzed the relationship between relative and dominant HGS and cardiometabolic risk factors, including blood pressure measurements, serum triglyceride levels, high-density lipoprotein cholesterol (HDL-C) ratio, hemoglobin A1c, uric acid levels, Framingham risk score in men, HDL-C, fasting blood glucose, and log high‐sensitivity C‐reactive protein (hsCRP). In this study, relative handgrip strength was significantly associated with favorable cardiometabolic risk levels, but no significant associations between dominant HGS and biomarkers, except for log hsCRP, were found. This study also showed that dominant grip strength is more effective in describing poor SRH than relative grip strength.
This study has several limitations. First, the dependent variable SRH and certain other variables in this study are based on self-questionnaires, which may not always be accurate. Second, because secondary data are used, it is not possible to include all of the correction variables necessary to analyze the relationship between HGS and SRH, which can lead to some bias in the results. However, there are few studies regarding the relationship between HGS and SRH in the middle-aged Korean population, and most of the existing studies were cross-sectional. The strong point of this study is that it attempted to investigate the relationship between HGS and SRH using longitudinal data representing the elderly population in Korea, and included relative HGS into that model.
In conclusion, in this study, we examined the relationship between HGS and poor SRH in Koreans over 45 years of age. The results showed that the higher the HGS index, the lower the risk of poor SRH. Stronger statistical significance was also found in the age group of 65 years and older. Similar results were obtained with relative grip strength, which takes into account the subject’s BMI. However, dominant grip strength was found to be better in terms of model fit. Thus, grip strength can be used as a measure of sarcopenia index, which is the main cause of disability in the middle-aged population and may also have an effect on SRH.
Notes
CONFLICT OF INTEREST
No potential conflict of interest relevant to this article was reported.