The Association between the Ratio of Energy Intake to Basal Metabolic Rate and Physical Activity to Sarcopenia: Using the Korea National Health and Nutrition Examination Surveys (2008–2011)
Article information

Abstract
Background
Sarcopenia is an important health problem, the risk factors of which a few studies have reported on. The purpose of this study was to evaluate the correlation between sarcopenia and the ratio of total energy intake to basal metabolic rate (BMR) as well as physical activity, and determine whether the relationship was different between younger and older age groups using data from the 2008–2011 Korea National Health and Nutrition Examination Survey.
Methods
We analyzed 16,313 subjects older than 19 years who had dual energy X-ray absorptiometry data. Sarcopenia was defined as an appendicular lean mass/weight (%) ratio of 1 standard deviation below the sex-specific mean value for a younger reference group, and BMR was calculated using the Harris–Benedict equation. A chi-squared test and logistic regression analyses were performed to evaluate the factors associated with sarcopenia.
Results
In this study, 15.2% of males and 15.4% of females had sarcopenia. Energy intake/BMR as well as physical activity was negatively related to sarcopenia risk. In stratified analysis by age and sex, strength exercises showed an inverse association with sarcopenia only in males under the age of 50 years (odds ratio, 0.577; P<0.0001), whereas higher energy intake/BMR was negatively associated with sarcopenia in each age and sex group.
Conclusion
Our findings suggest that adequate energy intake is important to prevent sarcopenia regardless of whether one exercises.
INTRODUCTION
Sarcopenia is the process of age-related decline of skeletal muscle mass and strength [1]. Although the concept of sarcopenia was first described as an age-associated decrease in skeletal muscle mass, it is now known as a serious issue that causes health problems and physical disabilities. Baumgartner et al. [2] reported that physical disability was about 4 times greater in elderly individuals with sarcopenia than in those with normal muscle mass. Many studies reported that sarcopenia was an important factor in the development of various diseases such as metabolic syndrome, cardiovascular diseases, and osteoporosis [3-5].
As sarcopenia is recognized as a problem of aging, many previous studies were conducted in elderly people over 60 years of age [6,7]. However, the prevalence of sarcopenia was reported as 19.2%, 29.1%, and 42.3% among individuals in the 20–39, 40–64, and 65 years and older age groups, respectively [8].
Various risk factors including nutrition, physical activities, strength exercise, and smoking were known as influential factors of sarcopenia. In Korea, these lifestyle behaviors have rapidly changed since 1970 with the introduction of a Westernized diet and the popularity of motor vehicles.
The purpose of this study was to evaluate the correlation between sarcopenia and the ratio of total energy intake to basal metabolic rate (BMR) as well as physical activity, and to determine whether the relationship between sarcopenia and its risk factors were different between younger and older age groups in the Korean population.
METHODS
This study is a secondary analysis of data obtained from the 2008 to 2011 Korea National Health and Nutrition Examination Survey (KNHANES IV and V), a nationally-representative survey conducted by the Korean Ministry of Health and Welfare. Written informed consent was provided by all participants and the protocol for KNHANES IV and V was approved by the Institutional Review Board of the Korean Centers for Disease Control and Prevention. A whole-body, dual-energy X-ray absorptiometry (DXA) scan was performed on individuals ≥10 years old between July 2008 and May 2011.
1. Participants
We selected those aged 19 years or older who had DXA and body mass index (BMI) data. We excluded participants who did not answer the food intake survey and participants whose total energy intake was less than 500 kcal/d or more than 5,000 kcal/d. Finally, 16,313 participants were included in our analysis (Figure 1).
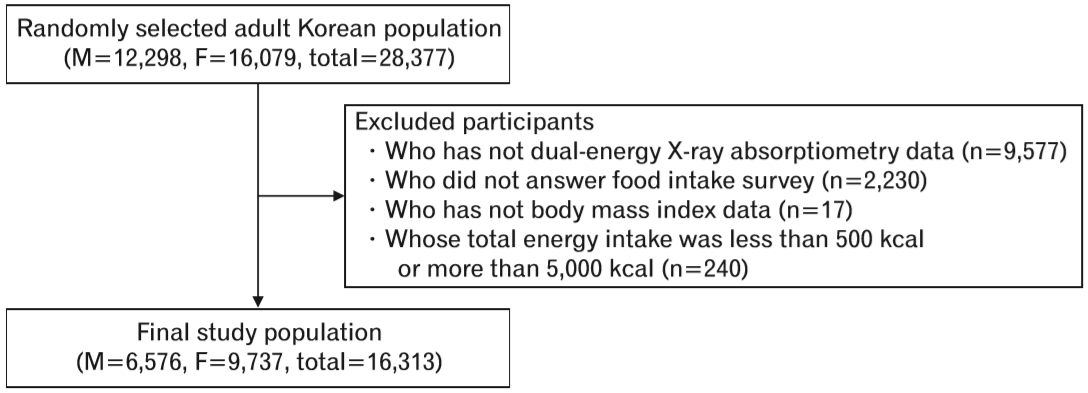
Study population. KNHANES, Korean National Health and Nutrition Examination Survey. M, male; F, female.
2. Measurements
1) Sarcopenia
In KNHANES, whole-body DXA examinations were conducted with a QDR4500A apparatus (Hologic Inc., Bedford, MA, USA). The data included values for the bone mineral content (g), bone mineral density (g/cm2), fat mass (g), lean mass (including bone mineral content [g]), and fat percentage of whole body and anatomical regions. Sarcopenia was defined as an appendicular skeletal muscle mass/weight (%) of 1 standard deviation or more below the sex-specific mean value for a younger reference group (20s and 30s) [8,9].
2) Influencing factors
Behavioral factors, including smoking or drinking, were assessed by self-administered questionnaires. The participants who had been diagnosed with hypertension (HTN), diabetes mellitus (DM), cardiovascular diseases, or cancer were defined as those who answered “yes” to the question, “Have you ever been diagnosed to have ‘diseases’ by a doctor?” Cardio-cerebrovascular disease (CCVD) included stroke, myocardial infarction (MI), and angina; and cancer included stomach, liver, colorectal, breast, cervical, and lung cancer.
Abdominal obesity by waist circumference was defined as ≥90 cm for males and ≥85 cm for females [10]. BMR was calculated using the Harris–Benedict equation. Self-administered questionnaires for energy intakes and physical activities were used. Energy intakes were measured by the single 24-hour dietary recall method. Strength exercises included push-ups, sit-ups, dumbbells, weights and bars and flexibility exercises included stretching and bare-handed gymnastics. Physical activity was assessed using the international physical activity questionnaire and was expressed in metabolic equivalent of task (MET)-hours per week; 3.3 METs for walking, 5.5 METs for moderate intensity activity, and 8 METs for vigorous intensity activity [11].
3. Statistical Analysis
Results are presented as the mean±standard error or number (%). All analyses were carried out for males and females. To compare means and proportions between each group, Student t-tests and chi-square tests were performed. A multivariate logistic regression analysis was used to identify factors associated with sarcopenia including smoking; drinking alcohol; underlying diseases such as HTN, DM and CCVD; cancer; abdominal obesity; nutritional factors; total energy intake to BMR ratio; and physical activity after adjusting for the influential variables that served as covariates.
For the comparison of factor variables and sarcopenia, logistic regression was performed after weighting all values without adjustment. A stepwise, multivariate, logistic regression analysis model was used to examine the correlation among nutritional factors, energy intake to BMR ratio, and physical activity with sarcopenia after gradually adjusting for confounding factors that affect sarcopenia. Analyses were initially adjusted for age, HTN, DM, and CCVD (model 1) and then adjusted for the ratio of energy intake to BMR (model 2). Final models (model 3) also controlled for physical activity. The odds ratio (OR) and 95% confidence intervals (CI) were calculated. Stratified analyses to identify factors associated with sarcopenia in age <50 years and age ≥50 years groups were performed. All analyses were performed as a complex-sampling analysis, and all statistical tests were two-tailed with 95% CI. Two-sided P-values of <0.05 were considered statistically significant. The entire analysis was performed using Stata ver. 14.0 (Stata Corp., College Station, TX, USA)
RESULTS
1. Basal Characteristics of Study Participants
In this study, a total of 16,313 participants aged 19 years and older were included, comprising of 6,576 males and 9,737 females. The prevalence of sarcopenia was 15.2% (1,002) in males and 15.4% (1,497) in females. The mean age of participants was about 8–9 years higher in the sarcopenia group than in the non-sarcopenia group (Table 1). Of the participants who had abdominal obesity, 58.5% were male and 57.2% were female in the sarcopenia group, whereas only 20.4% were males and 20.1% were females in the non-sarcopenia group. In addition, metabolic disease, such as HTN or DM, was more prevalent in the sarcopenia group, and the percentage of participants who were diagnosed with CCVD, such as MI, angina, or stroke, was higher in the sarcopenia group.
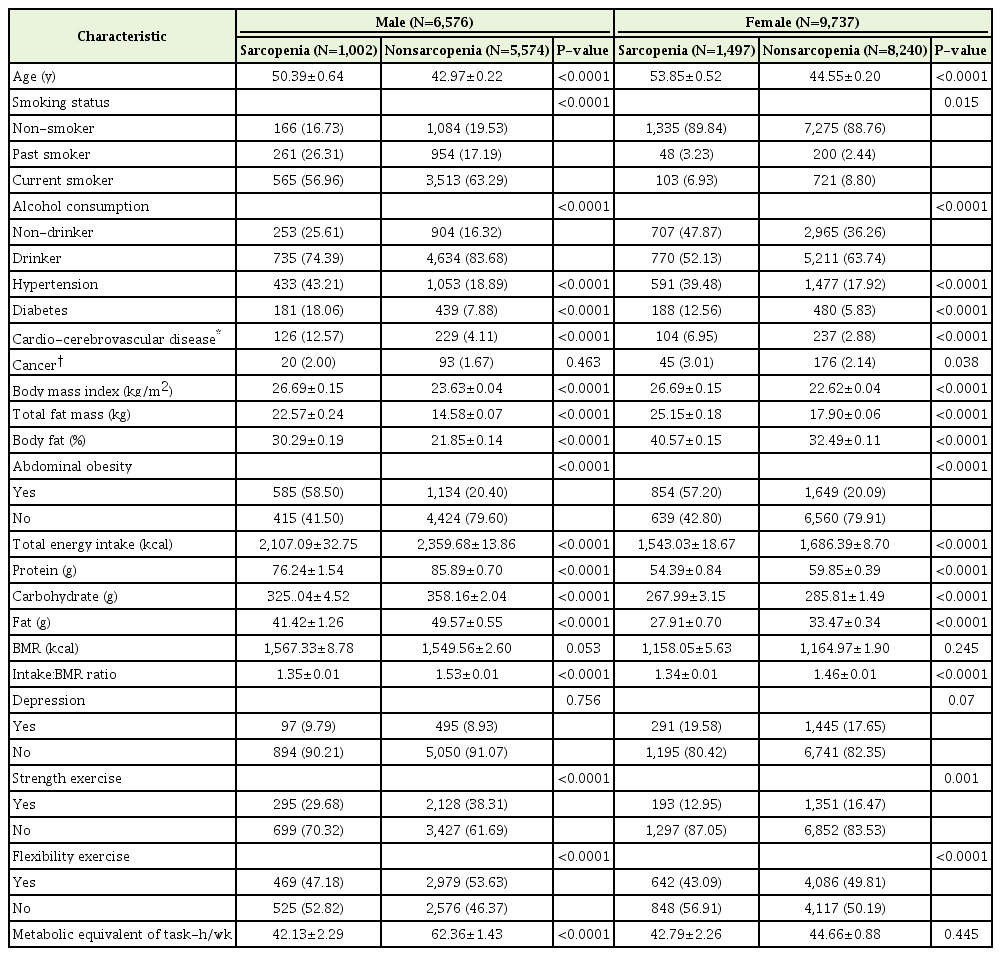
Basal characteristics of study participants (≥19 years)
Total calorie intake as well as all energy components such as protein, carbohydrate, and fat intake were higher in the non-sarcopenia group than in the sarcopenia group. The non-sarcopenia group exercised more. When we expressed physical activity in MET hours, the sarcopenia group performed less physical activity, and this difference was greater in males (20 MET) than in females (2 MET) (P<0.001 and P=0.445, respectively).
2. Association between Influencing Factors and Sarcopenia
The odds ratios for sarcopenia according to underlying disease, energy intake, exercise, and physical activity were analyzed using logistic regression analyses and adjusting for age (Table 2). Sarcopenia risk increased with age in males (OR, 1.031; 95% CI, 1.025–1.037) and females (OR, 1.034; 95% CI, 1.030–1.039). Metabolic disease such as HTN and DM had a positive relationship with sarcopenia risk regardless of sex (OR, 2.498; 95% CI, 2.046–3.051; OR, 1.839; 95% CI, 1.442–2.345 in males; OR, 1.819; 95% CI, 1.530–2.165; OR, 1.442; 95% CI, 1.152–1.805 in females). In addition, the participants who were diagnosed with cardiovascular disease (MI, angina) or stroke had 2.0 and 1.5 times higher risk of sarcopenia (OR, 2.088; 95% CI, 1.582–2.756; OR, 1.507; 95% CI, 1.118–2.030 in males and females, respectively).
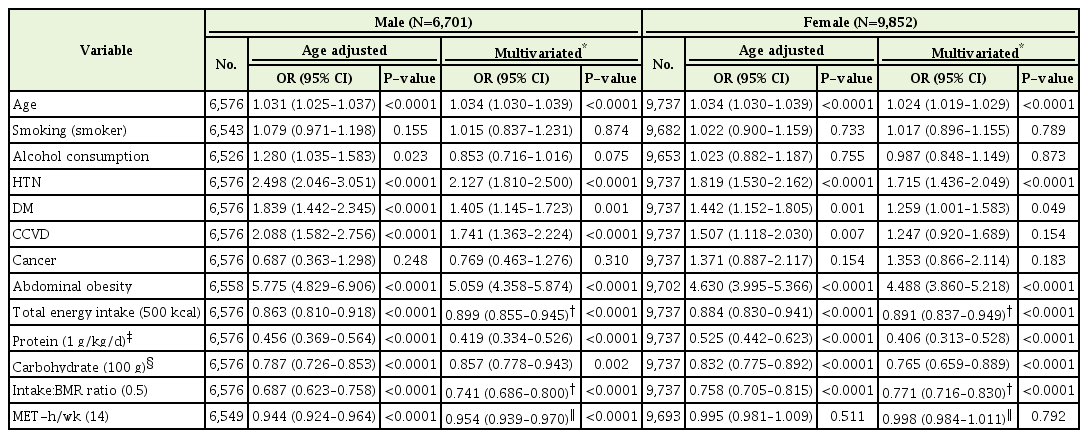
ORs of sarcopenia according to chronic diseases, energy intake, exercise, and physical activities
As daily total energy intake increased by 500 kcal, sarcopenia risk decreased (OR, 0.863; 95% CI, 0.810–0.918; OR, 0.884; 95% CI, 0.830–0.941 in males and females, respectively), and if energy intake was 50% greater than BMR, sarcopenia risk decreased by up to 31% (OR, 0.687; 95% CI, 0.623–0.758; OR, 0.758; 95% CI, 0.705–0.815 in males and females, respectively). When those who ingested 1.0 g/kg/d more protein based on previous recommended optimal dietary protein intake to prevent sarcopenia [12], sarcopenia risk decreased by about 55% (OR, 0.456; 95% CI, 0.369–0.564; OR, 0.525; 95% CI, 0.442–0.623 in males and females, respectively). Moreover, consuming 100 g more carbohydrates (recommended dietary allowance by the National Institutes of Health, 2005) decreased sarcopenia risk by up to 21% (OR, 0.787; 95% CI, 0.726–0.853; OR, 0.758; 95% CI, 0.705–0.815 in male and female, respectively).
In the male sub group, those who performed more than 30-minute physical activity a day (a 14-MET increase of physical activity per week) had a lower risk of sarcopenia than those who did not (OR, 0.944; 95% CI, 0.924–0.964), however in the female group, physical activity did not affect sarcopenia risk (OR, 0.984; 95% CI, 0.973–0.996) (Table 2).
3. Multivariate Logistic Regression Analysis of Sarcopenia Risk according to Energy Intake and Physical Activity
The associations between energy intake or physical activity and sarcopenia after adjusting for confounding factors are presented in Table 3. We used the ratio of energy intake to BMR to evaluate individual energy intake. After adjusting for underlying disease, including HTN, DM, and CCVD (model 1), those taking in 50% more energy than BMR showed a negative relationship with sarcopenia risk by 30% (OR, 0.702; 95% CI, 0.636–0.774) but was not as much as those taking in an optimal amount of dietary protein (OR, 0.482; 95% CI, 0.391–0.594). Consuming optimal dietary carbohydrates (OR, 0.795; 95% CI, 0.734–0.862) was also significantly associated with sarcopenia risk in males (Table 3). Physical activity also presented a significant inverse association with sarcopenia (OR, 0.945; 95% CI, 0.925–0.965).
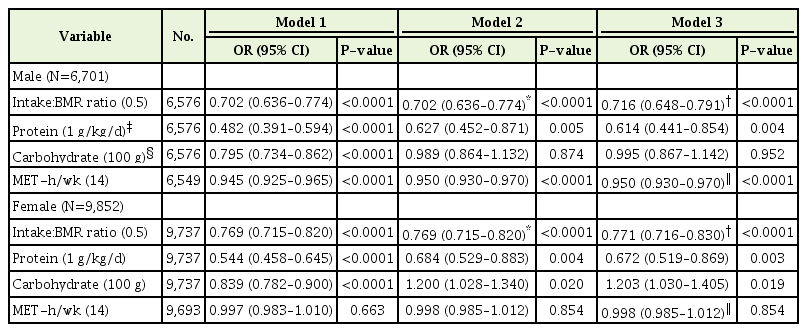
ORs for adjusted analyses of sarcopenia according to ratio of energy intake to BMR, nutritional component, and physical activities
To determine the independent association between sarcopenia and energy intake or physical activity, models 2 and 3 analyses were performed. The effect of protein intake and physical activity on sarcopenia risk remained significant but slightly attenuated after adjusting for energy intake/BMR in males (OR, 0.627; 95% CI, 0.452–0.871; OR, 0.950; 95% CI, 0.930–0.970, respectively), and there was no significant association between carbohydrate intake and sarcopenia risk after adjusting for energy intake. After adjustment for physical activity (model 3), the relationship between variable factors and sarcopenia risk was similar to the results of model 2 (Table 3).
In female participants, the associations between energy intake or physical activity and sarcopenia after adjusting for confounding factors showed a trend similar to that of males (Table 3). However, the direction of the correlation between carbohydrate intake and sarcopenia risk changed (OR, 1.200; 95% CI, 1.028–1.340).
4. Stratified Logistic Analyses to Evaluate the Effect of Influential Factors to Sarcopenia
The associations among underlying disease, energy intake, exercise, or physical activity and sarcopenia by age group (<50 years and ≥50 years) (Table 4). The prevalence of sarcopenia was 10.2% (307/3,127) in males and 8.6% (425/4,965) in females in the young group (age <50 years), but was twice as high in the older group (age ≥50 years), with 20.2% (695/3,449) in males and 19.2% (1,072/5,574) in females. In the young male group, the presence of HTN but not diabetes had a significant positive relationship with sarcopenia risk (OR, 3.272; 95% CI, 2.171–4.929 in HTN; OR, 1.358; 95% CI, 0.664–2.778 in DM); in the young female group, the presence of HTN and diabetes had no association with sarcopenia risk. However, in the older group, HTN or diabetes had a significant association with a higher risk of sarcopenia by 1.5 to 2.3 times.
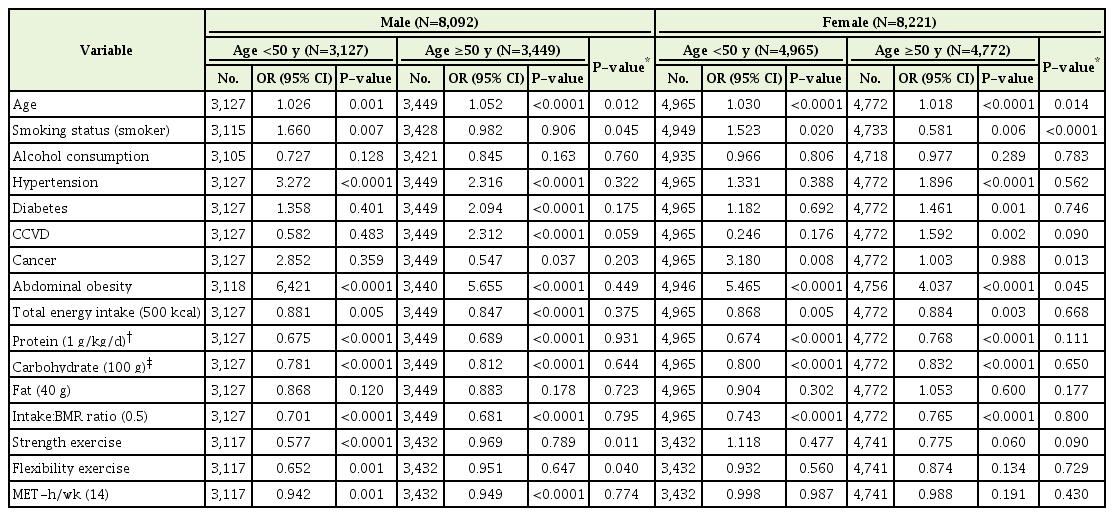
Stratified logistic analyses adjusting age in age <50 years, age ≥50 years groups
Total energy intake and protein and carbohydrate intake showed a negative relationship with sarcopenia risk in both younger and older groups, regardless of sex. Strength exercise was assumed to reduce sarcopenia risk in general; however, in this study, strength or flexibility exercises had no association with sarcopenia risk except in the young male group (OR, 0.577; 95% CI, 0.435–0.764 and OR, 0.652; 95% CI, 0.502–0.846; P-value for the interaction between the young and old male groups <0.0001 and 0.001, respectively). Physical activity slightly decreases sarcopenia risk about 5% in males regardless of age; however, physical activity did not decrease sarcopenia risk in females (Table 4).
DISCUSSION
In this study, we found that the total energy intake/BMR ratio and protein intake had negative relationships with sarcopenia risk. However, in contrast to previous studies, strengthening exercises were not associated with sarcopenia risk except in younger males. Physical activity showed a negative relationship, but the effect was small.
In this study, the prevalence of sarcopenia was 15.2% in males and 15.4% in females. Although sarcopenia is an age-based process, previous studies reported a marked loss of muscle mass and strength around the age of 50 years [13], so we investigated the difference in the relationship between influential factors and sarcopenia by using a stratified analysis at the age of 50 years. As in previous studies, the prevalence of sarcopenia was twice as high at ages over 50 years than under, in males and females.
In the present study, we found that the total energy intake/BMR ratio was higher in the non-sarcopenia group than in the sarcopenia group, as Bae and Kim [8] reported. In line with previous studies, higher protein ingestion, especially more than 1.0 g/kg/d, reduced sarcopenia risk by 50% [12]. Nutritional imbalance and transient repeated undernutrition induced chronic inflammation and may explain the presence of sarcopenia in Koreans, especially in the elderly.
In previous studies, carbohydrates intake was not considered important for sarcopenia prevention, whereas in our study, sarcopenia risk was reduced when ingestion of more carbohydrates after adjusting for total calories. However, after adjusting for the energy intake/ BMR ratio and considering individual BMIs, the odds ratio was reversed in the female group, wherein higher carbohydrate intake slightly increased sarcopenia risk. When we assume the ratio of total calorie intake to BMR is equal, increased carbohydrate intake leads to reduced protein intake. Since protein is the crucial factor in preventing sarcopenia, it is likely that higher carbohydrate intake could be associated with the higher sarcopenia risk in females, whose muscle mass is also relatively smaller than males.
The second hypothesis is insulin resistance. The impact of carbohydrate intake on muscle mass remains rather unexplored [14], but the impact of carbohydrate intake on insulin resistance is relatively well established. As above, assuming the same calorie intake, if you intake calories primarily as carbohydrates, insulin secretion increases, the remaining calories are stored in fat, and are thought to be mainly stored in the abdomen. As mentioned above, abdominal fats can lead to sarcopenia.
The effects of resistance (strength) exercises, such as weightlifting, on muscle mass and strength are well established in both sexes [15]. Previous studies reported that resistance exercises enhance muscle protein synthesis in young and older individuals [16], and muscle strengthening exercises are required to maintain muscle mass and strength in old age [17]. However, in this study, no association was found between strength exercises and sarcopenia except in the young male group. However, strong evidence exists that exercise is a critical intervention in sarcopenia, especially strength training [18]; the effect of exercise on the stimulation of muscle protein synthesis depends on the timed administration of adequate protein, especially in the elderly [19]. Moreover, a previous study has shown that the beneficial effect of strength exercises on sarcopenia was dose-dependent [20]. It is possible that Korean females and elderly males do not perform enough strength exercises to stimulate muscle protein, and the rate of higher-intensity strength exercises was too low to make a difference between the groups who did and did not exercise. In the same manner, the recommended rate of physical activity that prevents chronic diseases (14 MET/wk) did reduce sarcopenia risk, but the impact was small, even non-significant in females. Like as we need more than a certain amount of nutrient (such as protein) intake to prevent sarcopenia, we need more than a certain amount of exercise to prevent sarcopenia. The female and older male groups may not be able to exercise as much as the threshold value that can increase muscle mass. In addition, it is well known that muscular exercises are helpful to build muscle mass rather than aerobic exercises [16-18]. The female and older male groups tend to perform more aerobic exercises than weight training, so the ability to build more skeletal muscle when consuming the same amount may be reduced.
Consequently, among the various possible interventions to prevent and treat sarcopenia, nutrition plays a key role in this population. We showed that adequate energy intake is more efficient than exercise in daily life to prevent sarcopenia in females and the older male population.
However, our study has some potential limitations. First, the cross-sectional nature of this study makes identifying a cause-and-effect relationship difficult. Second, detailed information on lifestyle behaviors and history of diseases obtained from the self-administered questionnaires may limit the accuracy of our results. In the same manner, we used a 24-hour recall method to assess dietary variables, but these may not be representative of exact habitual diet. Last, the information regarding the intensity and duration of strengthening exercises is lacking, so the effect of strengthening exercises may not be accurately evaluated. Further studies are needed to assess these points.
The present study was a large, population-based study to examine the association between the energy intake/BMR ratio and physical activity, such as exercise, and to determine whether the relationship differs by age group. Strength exercises did not show significant beneficial effects on sarcopenia risk except in young males, whereas the energy intake/BMR ratio did. Our study suggested that adequate ingestion of energy is important to prevent sarcopenia regardless of whether one exercises. Further studies to develop age group–specific strategies for the prevention of sarcopenia are required.
Notes
No potential conflict of interest relevant to this article was reported.