INTRODUCTION
In Korea, aging of the population has resulted in a progressive increase in the healthcare burden conferred by chronic diseases such as cancer, cardiovascular disease (CVD), obesity, diabetes, and osteoporosis. In particular, CVD follows malignant neoplasms as the second leading cause of death in Korea. Therefore, decreasing the incidence and prevalence of CVD has become an important public health goal to improve population health and reduce medical expenses. The World Health Organization has indicated a high correlation between the dietary intake and the occurrence of chronic diseases [1]. Thus, dietary improvements are very important, as dietary factors have a higher contribution than do smoking and drinking to the burden of chronic diseases [2]. Based on their findings from a 34-year, large-scale prospective cohort study, Malik et al. [3] reported that the ingestion of sugar-sweetened beverages (SSBs) was associated with CVD, and the resultant mortality directly increased with the increased intake of SSBs. Several studies have reported an increased risk of chronic diseases, such as obesity, type 2 diabetes, hypertension, and metabolic syndrome, with the increased intake of SSBs [4,5]. Processed foods account for a large portion of the Korean diet at present [6], and more than 74% of processed foods contain added sugars [7]. Beverages account for the highest proportion (34.3%) of sugar intake from processed foods [8], with beverages that contain liquid sugar syrup constituting the majority [9]. In Korea, the average intake of SSBs was 299.2 and 208.8 g/day for men and women, respectively, in 2013ŌĆō2015. This indicated an increase of 59.6% and 76.8% in intake for men and women, respectively, compared with the intakes in 2007ŌĆō2009 [10]. Nonetheless, the association between the high risk of CVD and the consumption of SSBs has not been adequately evaluated in Korean men.
This study was undertaken to confirm the association between the intake of SSBs and the high risk of CVD in Korean men by using the data from the 2014ŌĆō2016 Korean National Health and Nutrition Examination Survey (KNHANES), and in so doing, provide the requisite evidence for health policy changes with the goal of CVD prevention.
METHODS
1. Participants
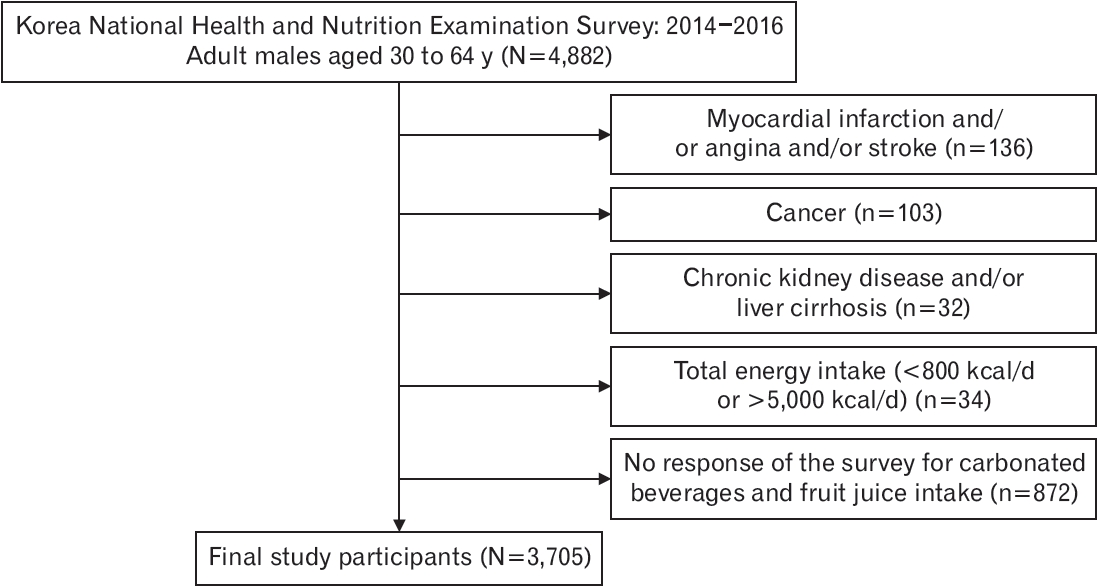
This cross-sectional study used data from the KNHANES, which was conducted in 2014ŌĆō2016 and included health surveys, screening, and food intake-frequency surveys. Data collected from adult males (age 30ŌĆō64 years) were obtained for analysis. A total of 4,882 people were surveyed in the 2014ŌĆō2016 KNHANES. The data of individuals who (1) had been diagnosed with or treated for CVD, cancer, or other chronic diseases (chronic renal failure, cirrhosis), and/or (2) had a total energy intake of less than 800 kcal per day or more than 5,000 kcal per adult male, and/or (3) had not responded to the food intake-frequency surveys of SSBs (carbonated drinks and fruit juices) were excluded from the study. The final analysis dataset of this study included the data of 3,705 individuals (Figure 1). This study was approved by the Medical Research Ethics Review Committee of the Seoul National University Hospital (IRB approval no., E-2002-001-1097). The requirement for informed consent from individual patients was omitted because of the retrospective design of this study.
2. Study Variables
Sociodemographic variables such as age, marital status, education level, employment status, and level of household income were surveyed. The education level was categorized into elementary school or less, middle school, high school, and college or higher education. The employment status was classified as employed and unemployed. The household income levels were categorized as low, middle-low, middle-high, and high in accordance with the income quartile (household). Body mass index (BMI) was calculated by dividing the individualŌĆÖs weight (kg) by the square of his height (m). Health-related behaviors such as smoking, drinking, and regular physical activity were ascertained through the questionnaire survey. Based on the smoking status, participants were categorized as never smokers, ex-smokers, and current smokers. Never smokers had never smoked or smoked less than five packs (Ōēż100 cigarettes) in their lifetime and were not currently smoking; ex-smokers had smoked more than five packs of cigarettes in their lifetime but had quit smoking; and current smokers had smoked more than five packs of cigarettes in their lifetime, and currently smoked. Drinking was defined as the consumption of more than one drink per month in the past year, based on the monthly drinking rate. Regular physical activity was defined as Ōēź2.5 hours of moderateintensity physical activity, Ōēź1.25 hours of high-intensity physical activity, or a combination of both (1 minute of high-intensity activity is equivalent to 2 minutes of moderate-intensity activity) per week. Chronic diseases such as hypertension, diabetes, and dyslipidemia were considered only on the basis of diagnosis or treatment by a doctor. With regard to mental health, stress status was defined as high or very high levels of stress based on the self-perception rate of stress. The daily intake of energy, carbohydrates, proteins, and fats was calculated through the food intake-frequency survey.
3. Definition of Sugar-Sweetened Beverages
In 2017, the Global Burden of Disease Risk Factor Collaborators included carbonated drinks, sodas, energy drinks, and fruit juices as SSBs [11], and excluded juices that were made entirely from fruits or vegetables from the SSB group. In the food intake-frequency survey, coke, cider, and carbonated fruit beverages were included as carbonated drinks, and the average intake of carbonated beverages and fruit juices for the past 1 year was surveyed. Most fruit juices contain sugar syrup and can, thus, be considered as SSBs. Therefore, in this study, the intake of SSBs was defined as the sum of the intakes of carbonated beverages (colas, cider, and carbonated fruit beverages) and fruit juices. The SSBs intake groups were further subcategorized as groups that consumed SSBs Ōēż2 times a week, 3ŌĆō4 times a week, and Ōēź5 times a week.
4. Definition of High Risk of Cardiovascular Disease
The risk of CVD was calculated using the Framingham Heart Study 10- year CVD Risk Calculator. Indicators such as age, gender, systolic blood pressure, hypertension treatment, smoking, diabetes, high-density lipoprotein cholesterol, and total cholesterol were used for risk calculation. A 10-year CVD risk of 10% or higher was defined as a high risk of CVD.
5. Statistical Analysis
In accordance with the characteristics of the KNHANES, which has a complex sampling design, this study conducted analyses by the weighting, stratification, and clustering of variables. Age; BMI; total daily energy intake; and daily carbohydrate, protein, and fat intake were all calculated as the mean and standard error. One-way analysis of variance was used to verify the differences between the groups based on the intake of SSBs. Marital status, education level, employment status, household income level, smoking, drinking, regular physical activity, hypertension, diabetes, dyslipidemia, and stress were all calculated frequencies and percentages (%). The chi-square test was used to verify the inter-group differences based on the intake of SSBs. To evaluate the association between the intake of SSBs and high risk of CVD, a multivariable-adjusted logistic regression analysis was conducted for each group stratified by SSB intake. After adjusting the variables in the three models developed for this study, the odds ratios (OR) for each SSB intake group were calculated. All analyses were conducted using Stata/MP ver. 15.0 (Stata Corp., College Station, TX, USA) and were interpreted as significant only when the P-value was less than 0.05.
RESULTS
1. General Characteristics of the Study Population
Table 1 shows the general characteristics of the study participants based on the intake of SSBs. The intake frequency of SSBs ranged from 0 to 28 times per week. We found that 2,440 (65.7%), 410 (11.1%), and 239 (6.5%) participants consumed SSBs Ōēż2, 3ŌĆō4, and Ōēź5 times a week, respectively. The average age of participants in this study population was 45.5 years, whereas the average age in the groups that consumed SSBs Ōēż2 and Ōēź5 times per week was 46.5 and 40 years, respectively. Our results show that the intake of SSBs increased inversely with reference to the average age. The proportion of married individuals was lowest (75.1%) in the group that consumed SSBs Ōēź5 times a week. The average BMI was highest, at 25.2 kg/m2, in the group that consumed SSBs Ōēź5 times a week, but there was no significant difference in the BMIs of the three groups. The current smoking rate was the highest (48.4%) in the group that consumed SSBs Ōēź5 times a week. In the group that had a high proportion of participants with hypertension, diabetes, and dyslipidemia, the intake of SSBs was low. The stress rate was highest (38.2%) in the group that consumed SSBs Ōēź5 times a week. The intake of total energy, carbohydrates, proteins, and fats intakes per day was highest in the group that consumed SSBs Ōēź5 times a week.
2. Association between the Intake of Sugar-Sweetened Beverages and the High Risk of Cardiovascular Disease
Table 2 shows the OR and the 95% confidence intervals (95% CI) for the high risk of CVD based on the consumption of SSBs per week. In the age-adjusted model 1, compared to the group that consumed SSBs Ōēż2 times a week, the OR for groups that consumed SSBs 3ŌĆō4 and Ōēź5 times a week was 1.32 (95% CI, 0.95ŌĆō1.83), and 1.53 (95% CI, 0.94ŌĆō 2.48), respectively. These differences were not significant. However, as the intake of SSBs increased, the risk for CVD increased (Ptrend=0.03). In model 2, in addition to model 1, we adjusted for marital status, education level, employment status, household income level, BMI, drinking, regular physical activity, dyslipidemia, and stress variables. Compared to the group that consumed SSBs Ōēż2 times a week, the ORs for a high risk of CVD in groups that consumed SSBs 3ŌĆō4 and Ōēź5 times a week were 1.41 (95% CI, 1.01ŌĆō1.98) and 1.54 (95% CI, 0.94ŌĆō2.51), respectively. The risk of CVD increased with the increase in the intake of SSBs (P-trend=0.02). In model 3, in addition to model 2, we adjusted the total daily intake of carbohydrates, proteins, and fats. In comparison with the group that consumed SSBs Ōēż2 times a week, the OR for high risk of CVD in the groups that consumed SSBs 3ŌĆō4 and Ōēź5 times a week was 1.49 (95% CI, 1.05ŌĆō2.11) and 1.61 (95% CI, 0.97ŌĆō2.67), respectively. As in models 1 and 2, the risk of CVD increased with the increase in the intake of SSBs (P-trend=0.01). Table 3 shows the OR and 95% CI for high risk of CVD on the basis of SSB intake per week by the different subgroups. Among participants younger than 45 years (wherein age >45 years is one of the risk factors for CVD in men), the risk of CVD was higher in the group that consumed SSBs Ōēź5 times a week (OR, 2.39; 95% CI, 1.17ŌĆō4.88) than in the group that consumed SSBs Ōēż2 times a week. The risk of CVD increased with the increased intake of SSBs (P-trend <0.05). However, this group showed no significant difference from the group over the age of 45 years (P for interaction=0.21). Among participants with BMI Ōēź25 kg/m2 (obesity criterion), the OR for high risk of CVD in groups that consumed beverages 3ŌĆō4 and Ōēź5 times a week was 1.45 (95% CI, 0.86ŌĆō2.43) and 1.84 (95% CI, 0.94ŌĆō3.61), respectively, compared to in the group that consumed SSBs Ōēż2 times a week. The risk of CVD increased as the intake of SSBs increased (P-trend=0.04). However, this group showed no difference from the group with BMI <25 kg/m2 (P for interaction=0.18). Among participants without regular physical activity, the ORs for high risk of CVD in groups that consumed SSBs 3ŌĆō4 and Ōēź5 times a week were 1.60 (95% CI, 0.99ŌĆō2.60) and 2.35 (95% CI, 1.08ŌĆō5.10), respectively, compared to that in the group that consumed SSBs Ōēż2 times a week. The risk of CVD increased with the increase in the intake of SSBs (Ptrend=0.01). However, in the group with regular physical activity, no association was observed between SSB intake and high CVD risk (P for interaction=0.01). Among participants who consumed Ōēź2,400 kcal/d, the ORs for high risk of CVD in groups that consumed SSBs 3ŌĆō4 and Ōēź5 times a week were 1.59 (95% CI, 0.95ŌĆō2.68) and 2.01 (95% CI, 1.01ŌĆō4.00), respectively, compared to those in the group that consumed SSBs Ōēż2 times a week. The risk of CVD increased with the increased intake of SSBs (P-trend=0.02). However, this group showed no difference from the group that consumed <2,400 kcal/d (P for interaction=0.23).
DISCUSSION
This study evaluated the association between the intake of SSBs and the high risk of CVD in Korean men using the data from the 2014ŌĆō2016 KNHANES. The present study demonstrated a significant association between the consumption of SSBs and the high risk of CVD, especially in individuals who consume these beverages Ōēź3 times a week. These findings are consistent with those of previous studies, which showed that the consumption of SSBs was related to a high risk of CVD [12-15]. In a meta-analysis of four prospective studies, Huang et al. [16] showed that the relative risk for coronary heart disease (CHD) increases with the increased intake of SSBs. With a once-daily increase in the intake of SSBs, the relative risk of CHD increased by 16%, and this association was reported to be particularly pronounced in men. We found that, in Korean men, the OR for high risk of CVD increased by 49% with the consumption of SSBs 3ŌĆō4 times a week compared with those who consumed SSBs Ōēż2 times per week. Malik and Hu [17] reported that SSBs have a strong positive association with weight gain, type 2 diabetes, and CHD risk, regardless of the fat intake. The relative risk of type 2 diabetes was reported to be 1.28 (95% CI, 1.12ŌĆō1.46) with SSBs, 1.29 (95% CI, 1.08ŌĆō1.54) with artificially sweetened beverages (ASBs), and 1.10 (95% CI, 1.01ŌĆō1.20) with fruit juices. Kim et al. [18] conducted a study using the data from the US National Health and Nutrition Examination Survey, and reported an increased risk of high blood pressure (87%; 95% CI, 1.06ŌĆō3.26), which is one of the risk factors for CVD, in individuals who consume SSBs Ōēź3 times a day compared to participants who did not. Several mechanisms have been suggested whereby SSBs can cause CVD. Malik and Hu [19] and Stanhope [20] have suggested that SSBs provide less satiety than actual calories. This indicates that the consumption of SSBs does not result in a decreased food intake; instead, this consumption can lead to a rapid increase in blood sugar that can promote an increase in appetite and result in overall weight gain. In addition, fructose-containing sugars can promote gout and dyslipidemia by promoting the production of uric acid, triglycerides, and cholesterol in the liver. Nakagawa et al. [21] have shown that increased blood levels of uric acid caused by the increased fructose intake decreases the levels of nitric oxide, which, in turn, impairs the functions of the vascular endothelium and increases the risk of CVD. Furthermore, SSBs can promote insulin secretion, with resultant retention of sodium and water in the body, which subsequently cause an increase in blood pressure [22]. Some studies have reported that replacing SSBs with ASBs may reduce the risk of CHD [23]. However, Imamura et al. [24] and Malik et al. [3] have reported that both SSBs and ASBs increase type 2 diabetesand CVD-associated mortality rates. Based on a computer-simulated study, Mekonnen et al. [25] predicted that reducing the intake of SSBs by 10%ŌĆō20% over the next 10 years will have significant health benefits and cost savings. In another study that reviewed the epidemiological and biochemical evidence, Thornley et al. [26] recommended that clinicians who undertake CVD counseling should advise patients to limit their sugar intake. Therefore, the steadily increasing intake of SSBs is an important factor in the increased prevalence and mortality of CVD, which makes it imperative to reduce SSB intake to ensure population health. In the past 30 years, most studies have focused on the role of saturated fats and sodium in CVDs. However, more recent studies have evaluated the relationship between excessive sugar intake and CVD. To confirm the role of sugars in the progression of CVD, there is a need for further research, including prospective studies, in several countries. And in the subgroup analysis, no association was observed between SSB intake and high CVD risk in the group with regular physical activity.
This study has a few limitations. First, given the cross-sectional study design, it was not possible to determine the exact temporal relationship between the intake of SSBs and the high risk of CVD. Second, the intake of SSBs was defined only as the sum of the intakes of carbonated beverages and fruit juices, which can possibly dilute the relationship between SSBs and the high risk of CVD; although carbonated beverages and fruit juices constitute the majority of sweetened beverages. Finally, as the traditional Framingham Risk Score was used, the risk of CVD in Koreans could have been overestimated [27]. Nonetheless, the Framingham Risk Score is one of the most widely applied risk-scoring methods in clinical practice because it can assess the risk of CVD based on easy-to-obtain medical history and cholesterol levels.
In conclusion, our study in Korean men, confirms the findings from previous research studies that a higher intake of SSBs is associated with a higher risk of CVD. The data of the KNHANES used for our analysis were representative of the whole Korean population and allowed an appropriate evaluation of the association while adjusting for several variables. This study found an association between the increased consumption of SSBs and a higher risk of CVD. The findings of this research will provide a basis for measures to improve the dietary intake of the Korean people to reduce the risk for CVD. It is recommended that more accurate data on the intake of added sugars, SSBs, and ASBs among Koreans be obtained through future periodic surveys to enable a more comprehensive evaluation of the risk, incidence, and mortality of CVDs. Prospective cohort studies are also recommended to validate and confirm the findings of this study.