Fruit Intake and Changes of Cardio-Metabolic Risk Factors in People with Obesity
Article information

Abstract
Background
This study aimed to explore the relationship between fruit intake, changes in fruit intake, and changes in cardiometabolic factors in people with obesity.
Methods
A total of 21,270 subjects (8,718 men, 12,552 women) aged 40 years and over, from the Korean-based Genome and Epidemiology Study, were followed up for an average of 4.4 years. Fruit intake was assessed using a food frequency questionnaire at baseline and the second follow-up. The beta coefficient and confidence intervals for changes in cardiometabolic risk factors according to fruit consumption were calculated using a linear regression model.
Results
In men, the abdominal circumference decreased with changes in fruit intake (P=0.029). Fruit intake and increased fruit intake in men were associated with a lower systolic blood pressure (P=0.012 and P=0.02, respectively) and lower triglyceride levels (P=0.002 and P<0.001, respectively). In women, abdominal circumference decreased with both fruit intake and increased fruit intake (P<0.001 and P=0.013, respectively). Systolic blood pressure and triglycerides tended to decrease only with fruit intake (P=0.048 and P<0.001, respectively). Unlike in men, fasting blood glucose tended to decrease in women with both fruit intake and increased fruit intake (P=0.011 and P=0.005, respectively).
Conclusion
Fruit intake and increased fruit intake may have beneficial effects on cardiometabolic risk factors among individuals who are obese.
INTRODUCTION
The prevalence of obesity has increased rapidly in the past 50 years. In 2016, more than 650 million adults were reported to be obese [1]. Its prevalence among Koreans has also increased significantly from 26.0% in 1998 to 34.1% in 2017 [2]. Obesity substantially increases the risk of type 2 diabetes mellitus; cardiovascular diseases, including myocardial infarction; stroke; osteoarthritis; obstructive sleep apnea; depression; and some types of cancer, including breast, ovarian, prostate, liver, kidney, and colon cancers [3,4]. Obesity is also an important factor related to metabolic syndrome that involves a cluster of cardiometabolic risk factors including abdominal obesity, high blood pressure, abnormal fasting glucose, and dyslipidemia [5-7].
Fruits constitute an important part of our diet, owing to their fiber, antioxidants, and micronutrient contents [8]. Hence, it is recommended as part of a healthy diet [9]. Fruit consumption also has beneficial effects on decreasing the risk of several chronic diseases [9]. Some studies have reported that fruit intake lowers the risk of metabolic syndrome and its components [10-12]. A meta-analysis on how fruit intake affects metabolic syndrome in a dose-response relationship reported that the risk of metabolic syndrome decreased with increased fruit intake [13]. In contrast, another study reported the two to be unrelated [14]. To date, the influence of fruit intake on metabolic syndrome remains controversial.
Many fruits are known to have high concentrations of fruit sugars and simple sugars such as glucose and fructose and are considered the main cause of increased adiposity [15]. Several studies have shown the pro-obesity effects of various types of fruits. One study has demonstrated a positive association between fruit juice consumption and adiposity in children, although this effect was observed only in children who were already obese or overweight [16].
Many epidemiological studies have evaluated the relationship between fruit consumption and cardiometabolic risk factors. However, the effect of fruit intake on cardiometabolic factors in individuals who are obese is not well known. This study aimed to explore the relationship between fruit intake or changes in fruit intake and changes in cardiometabolic factors in individuals who are obese by using data from Korean Genome and Epidemiology Study (KoGES).
METHODS
1. Study Population
The data of this study were from the rural-based cohort (2005–2011) and the city-based cohort (2004–2013) of the KoGES [17]. The KoGES is a cohort project conducted by the National Institute of Health and Human Services, Korea Centers for Disease Control and Prevention (currently, Korea Disease Control and Prevention Agency), to establish a scientific basis for the identification and prevention of risk factors for common chronic diseases in Korea. Since 2001, participants aged 40 years and over have been recruited from the general population, and follow-ups are ongoing.
To determine the cardiometabolic risk factors among adults who are obese, 133,427 individuals with a body mass index of less than 25 kg/m2 were excluded from the total cohort population of 201,546. Subjects who are on glucose-lowering medications or insulin treatment were also excluded. Moreover, subjects who had missing information related to the cardiometabolic parameters at baseline, those who did not complete a food frequency questionnaire (FFQ), those who were diagnosed with cancer or cardiovascular diseases such as angina and myocardial infarction at baseline, those with extraordinary energy intake (<500 kcal/d or >6,000 kcal/d) at baseline, and those who refused to participate in the follow-up examinations were excluded. Our final study population consisted of a total of 21,270 subjects (8,718 men and 12,552 women) with an average follow-up of 4.4 years (Figure 1). The Institutional Review Board of Bundang Seoul National University Hospital approved this study (IRB approval no., X-1910-568-906).
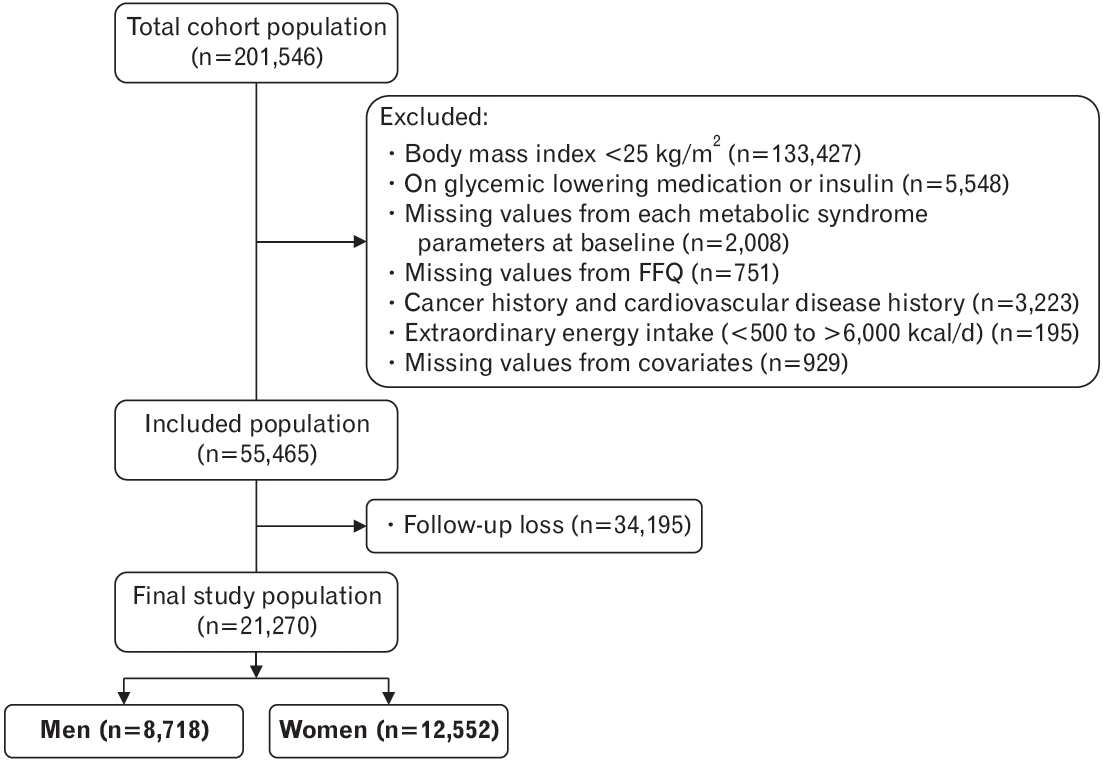
Flowchart of study population. FFQ, food frequency questionnaire.
2. Measurements of Cardiometabolic Factors and Socio-Demographic Factors
Basic information and data on past medical history, medication use,and health-related behaviors were collected using self-administered questionnaires. Height, weight, and waist circumference were measured with the subjects in light clothing and correct posture. The body mass index was calculated as weight (kg)/height (m2). The waist circumference was measured at the midpoint between the lowest rib and the iliac crest. Blood pressure was measured using a mercury sphygmomanometer (W. A. Baum Co. Inc., Copiague, NY, USA), with the persons in the correct posture during measurement by adjusting the height so that the feet touch the floor without twisting of the legs and the right upper arm is at the same level as the heart; furthermore, we also allowed more than 5 minutes of rest before the measurement. With the subject in a stable and correct measurement posture, the blood pressure was measured at least twice at each visit and on both arms, and the sound was measured by Korotkoff phase I and V, respectively. Blood tests were performed after fasting for at least 8 hours, and fasting blood glucose, triglyceride, and high-density lipoprotein cholesterol (HDL cholesterol) levels were assessed using an autoanalyzer (Bayer HealthCare, Berlin, Germany).
3. Cardiometabolic Risk Factors
We explored the parameters used to characterize metabolic syndrome. Metabolic syndrome was defined as per the National Cholesterol Education Program/Adult Treatment Panel III, namely, having three or more of the following five factors: central obesity, impaired glucose tolerance, hyperlipidemia, low HDL cholesterol, and hypertension [18]. We explored the changes in waist circumference, systolic and diastolic blood pressure, triglycerides, HDL cholesterol, and fasting blood glucose over time.
4. Dietary Assessment
In this study, validated semi-quantitative FFQ was used to assess total fruit intake [19]. The intake frequency, intake amount, and intake season of the past year were investigated. The intake frequency was changed daily, and the intake was converted to grams to calculate the average daily intake. The FFQ included a total of 11 fruits (strawberry, melon, watermelon, peach, banana, persimmon, tangerine, pear, apple, orange, and grape). The total energy intake and the intake of each macronutrient were also calculated as the average daily intake and corrected by calculating the grams per 1,000 kcal of total energy intake.
5. Covariates
Physical activity was coded as yes if the frequency of activity was more than 3 times per week with moderate intensity. Smoking status was categorized as never smoker, former smoker, or current smoker. Regarding alcohol consumption, each subject was categorized as a non-drinker, former drinker, or current drinker. Monthly family income was classified into four groups as follows: <1 million won (equivalent to US dollar [USD] 830), between 1 and 2 million won (equivalent to approximately USD 1,650), between 2 and 4 million won (equivalent to approximately USD 3,300), or >USD 3,300. Education level was classified as graduating from primary school, high school, or above.
6. Statistical Analysis
Categorical variables were presented as numbers with percentages, and continuous variables were presented as means and standard deviations.
The independent variables in this study were the amount of baseline fruit consumption and the changes in fruit consumption. The former was analyzed by baseline intake, while the latter was analyzed using the difference after subtracting baseline intake from follow-up intake. The beta coefficient and confidence intervals for changes in cardiometabolic risk factors according to fruit consumption were calculated using a linear regression model. Before applying linear regression, the following were assessed using Pearson correlations: baseline fruit intake, changes in fruit intake, and changes in cardiometabolic risk factors.
Model 1 was adjusted for age, body mass index, total energy intake, and macronutrient intake, with Model 2 additionally adjusted for smoking status, alcohol intake, and physical activity. Model 3 included socioeconomic factors, household income, and education level, in addition to the variables in Model 2. All statistical analyses were performed using STATA software ver. 16.0 (Stata Corp., College Station, TX, USA). Statistical significance was indicated by P-values less than 0.05.
RESULTS
1. General Characteristics
The baseline characteristics according to sex are presented in Table 1. The prevalence of hypertension and dyslipidemia was significantly higher in men than in women (P=0.003 and P=0.039, respectively). In men, the percentage who exercised more than 3 times per week with moderate intensity was higher than that in women (56.9% versus 46.1%, P<0.001). Moreover, current smokers (27.2% versus 1.8%, P<0.001) and current drinker (73.0% versus 28.7%, P<0.001) were significantly higher in men than in women.
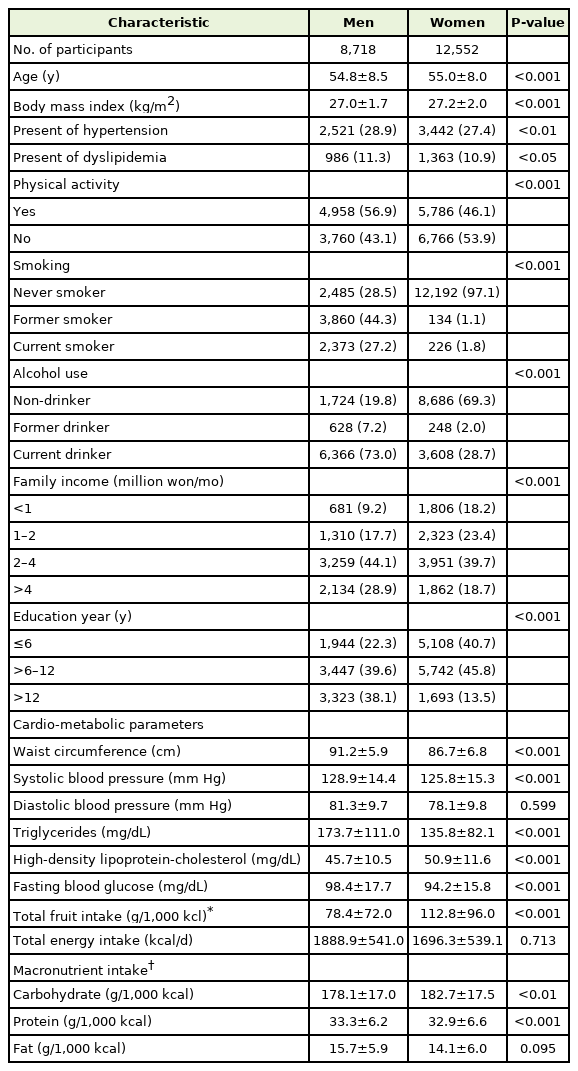
Baseline characteristics of participants
Baseline cardiometabolic parameters according to sex were identified. The average HDL cholesterol level was significantly higher in women than in men (P<0.001), and the average waist circumference, systolic blood pressure, triglyceride level, and fasting blood sugar levels were significantly higher in men than in women (all P<0.001). Total energy intake was measured to be 1,888.9±541.0 kcal/d for men and 1,696.3±539.1 kcal/d for women. The total fruit intake corrected for total energy intake per 1,000 kcal was higher in women (78.4±72.0 g/1,000 kcal for men and 112.8±96.0 g/1,000 kcal for women). The total amount of carbohydrates ingested was also higher in women (P=0.002), while protein intake was higher in men (P<0.001). Fat intake was not significantly different between men and women (P=0.095).
2. Relationship between Fruit Intake, Changes in Fruit Intake, and Cardiometabolic Syndrome Components
The effect of total baseline fruit intake and increased fruit intake with respect to baseline cardiometabolic risk factors, based on sex, are presented in Tables 2 and 3, along with the beta coefficient values and confidence intervals.
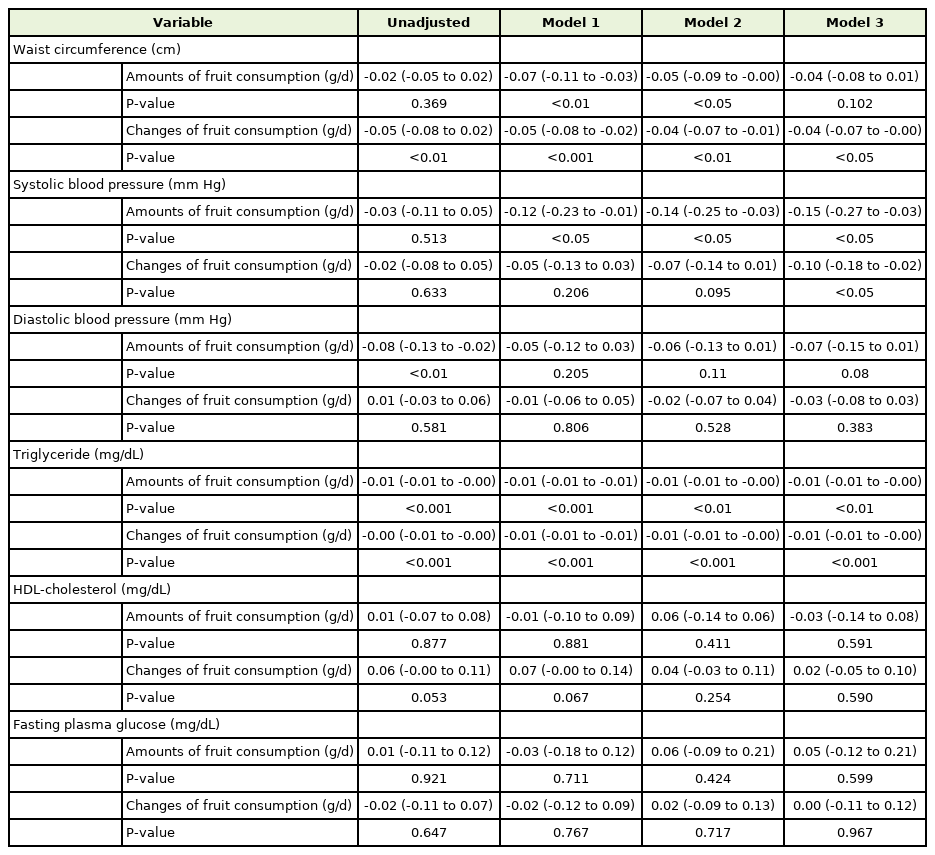
Linear regression and 95% confidence intervals for changes of each metabolic syndrome components according to whole fruit consumption and changes of fruit consumption in men (n=8,718)
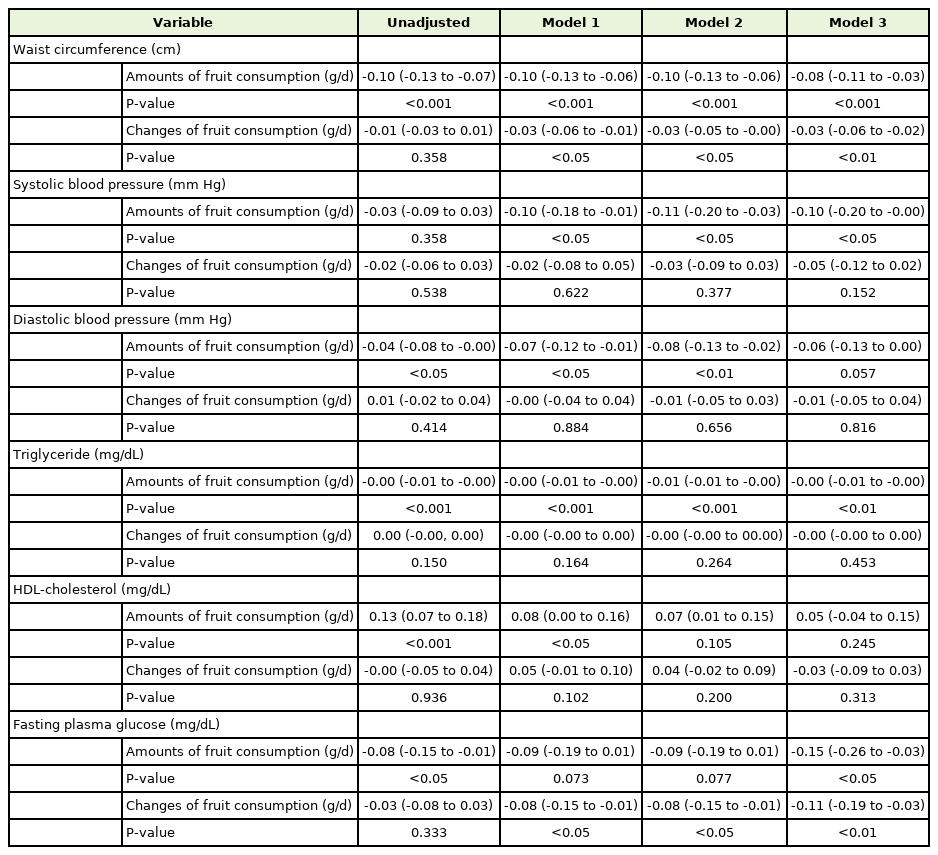
Linear regression and 95% confidence intervals for changes of each metabolic syndrome components according to whole fruit consumption and changes of fruit consumption in women (n=12,552)
In men, abdominal circumference decreased when the fruit intake was increased from baseline (P=0.002), even after correcting for all covariates (P=0.029). However, it was not related to the total fruit consumption at baseline (P=0.102). Both the total amount of fruit intake and increase in fruit intake were significantly associated with reduced systolic blood pressure (P=0.012 and P=0.02, respectively) and triglycerides (P=0.002 and P<0.001, respectively). In contrast, diastolic blood pressure, HDL cholesterol, and fasting blood glucose were not associated with fruit intake in men.
In women, abdominal circumference decreased with both the amount of fruit intake and an increase in fruit intake (P<0.001 and P=0.013, respectively). Systolic blood pressure and triglycerides tended to decrease only when the total baseline fruit intake increased (P=0.048 and P<0.001, respectively). Finally, unlike in men, fasting blood glucose decreased in women with baseline fruit intake and an increase in fruit intake with respect to baseline (P=0.011 and P=0.005, respectively). Similar to that in men, diastolic blood pressure and HDL cholesterol levels in women were not associated with fruit intake.
DISCUSSION
In this study, we found that generally favorable changes occurred when the total amount of fruit consumed or changes in fruit consumption increased among individuals who are obese. With the increase in total fruit consumption, waist circumference, systolic blood pressure, and triglycerides decreased in men and women. Unlike men, women’s fasting blood glucose also showed favorable changes with an increase in fruit intake.
A meta-analysis that examined the changes in body anthropometric variables according to fruit intake showed a decrease in waist circumference with an increase in fruit intake [20], which concurs with the results of our study. Several studies have shown that an increase in fruit intake among middle-aged adults lowers the risk of hypertension [21,22]. There are also longitudinal studies that have suggested that an increase in fruit intake is associated with a lower BP [10,23]. The results of our study also showed a tendency for systolic blood pressure to decrease with an increase in fruit intake. In the case of triglycerides, other studies have shown that it is significantly lowered as the amount of fruit intake increases, as in our study [15].
Regarding the association between fruit consumption and blood glucose, the effect of an increase in fruit intake on the risk of developing diabetes remains controversial. While some studies have not found a link between blood glucose and fruit intake [24,25], others have shown that the incidence of diabetes was decreased with an increase in fruit intake [26]. In our study, fasting blood glucose was reduced with increased fruit intake as well as by changes in fruit intake, but only in women who were obese but non-diabetic. The blood glucose level did not worsen as the fruit intake increased. We considered that the fiber in fruits may help to control blood sugar [27]. The relationship between fiber and blood glucose control has been well studied [8,27], and fiber intake has shown definite beneficial effects in controlling blood glucose. In addition to fiber, vitamin C, polyphenols, and high levels of potassium and magnesium also affect blood sugar regulation and may contribute to the lowering of blood glucose [28,29]. The reason that the effect was only observed in women in our study may be due to the amount of mean total fruit intake in women being significantly greater than that in men; thus, there may be some threshold of fruit intake required to protect against an increase in blood glucose. Fruits contain many nutrients that may act as antioxidants, such as vitamin C, vitamin E, minerals, and phytochemicals; their dietary fiber also helps to reduce oxidative stress, lower blood pressure, and improve insulin resistance [8]. These nutrients inhibit lipogenesis and adipogenesis and activate lipolysis and adipocyte apoptosis. The mechanism is collectively referred to as the anti-obesity effect. As fruit intake increases, the antiobesity effect may have a positive influence on cardiometabolic risk factors, even in adults who are obese [30].
1. Strengths and Limitations
Our study has several limitations. First, it is not possible to quantitatively suggest how much fruit should be consumed, as we did not express the degree of change in each risk factor according to the changes in fruit intake or fruit intake per se. Second, self-reported FFQ may lead to recall biases in the data obtained for the intake of each nutrient and fruit intake. Moreover, lifestyle factors, including exercise, have a major impact on cardiometabolic risk factors. Those who exercise intensely and maintain other healthy lifestyle habits are more likely to eat fruits. However, we did attempt to adjust for these variables in our analysis.
Our study also has several strengths. First, our cohort was representative of the Korean population; thus, the results are generalizable. Moreover, we used data from both rural and urban cohorts to reduce the regional bias. Second, using a longitudinal cohort, we were able to not only explore how the baseline fruit intake affects cardiometabolic risk factors but also the effects of changes in fruit intake on cardiometabolic risk factors. Most studies in the literature have analyzed cross-sectional data, and only a few studies have longitudinally analyzed the relationship between cardiometabolic risk factors and fruit intake or changes in fruit intake. Further studies are required to explore the effect of different fruit types on cardiometabolic risk factors. In conclusion, a higher amount of fruit intake as well as an increase in fruit intake may have beneficial effects on the cardiometabolic risk factors of individuals who are obese.
Notes
CONFLICT OF INTEREST
No potential conflict of interest relevant to this article was reported.