Current Status of Korean Alcohol Drinking in Accordance with the Korean Alcohol Guidelines for Moderate Drinking Based on Facial Flushing
Article information

Abstract
Since each person has a different ability to break down alcohol, it is inappropriate to apply a uniform standard to everyone when evaluating drinking status. In Korea, there has been a guideline for moderate drinking based not only on sex and age but Koreans’ alcohol metabolism capabilities that can be predicted by presence of facial flushing response. So far, there have been no studies that have investigated drinking habits of Koreans in accordance with the guideline. This study tried to identify the current drinking status of Koreans according to the guideline. As a result, it was confirmed that about 1/3 of the total population was accompanied by facial flushing when drinking alcohol, and it was found that different drinking habits were shown even in the same age and gender groups according to the presence of facial flushing. It is difficult to accurately evaluate drinking habits because facial flushing has not yet been investigated in some large data or various medical examinations. In the future, it is necessary to ensure that the presence of facial flushing can be confirmed at the medical treatment or examination site so that accurate drinking habit evaluation and prevention and resolution of drinking problems can be achieved.
INTRODUCTION
The World Health Organization (WHO) has reported that binge drinking is a leading cause of over 200 diseases and injuries, and is closely related to premature death and disability [1]. According to the WHO report of 2018, approximately 5.3% of all deaths worldwide in 2016 (i.e., approximately 3 million deaths) were related to alcohol consumption, and exceeded the number of deaths from tuberculosis, human immunodeficiency virus/acquired immunodeficiency syndrome, and diabetes [1]. In addition, alcohol consumption increases the risk of various cancers in different organs, such as the oral cavity, pharynx, esophagus, colon, liver, breast, pancreas, prostate, as well as melanoma [2]. The International Agency for Research on Cancer, the specialized cancer agency of the WHO, has designated both alcohol, the main component of alcoholic beverages, and their by-product, acetaldehyde, as first-class carcinogens [3].
Nevertheless, in 2016, the average volume of alcohol consumption by Koreans aged 15 years and older was 10.2 L per capita, which was higher than the mean volumes consumed by these age groups in the world overall (6.4 L), the WHO Western Pacific Region (7.3 L), and the United States (9.8 L) [1]. In Korea, when drinking 2 or more glasses of Soju (Korean liquor) per day, for males, and at least 1 glass of Soju per day, for females, the incidence of liver cancer increased by 1.4 times, and the mortality rate related to liver disease increased by 3.2 times as compared to those who drank less or never [4]. Moreover, it has been shown that Koreans who drink more than a certain amount of alcohol had increased risks of hypertension [5], metabolic syndrome [6-8], insulin resistance [9], high blood glucose levels [10], prediabetes or type 2 diabetes mellitus [11], high-risk colorectal adenoma [12], high intraocular pressure [13], increased carbohydrate-deficient transferrin and gamma-glutamyltransferase levels [14], lower serum high-density lipoprotein cholesterol level [15], being positive for rheumatoid factor [16], and/or testosterone deficiency [17]. In addition, excessive alcohol consumption causes serious personal and social problems, such as depression, dementia, suicide, domestic violence, pregnancy complications, birth defects, automobile accidents, and property damage [18]. According to a report by the Health Insurance Research Institute of the National Health Insurance Service (NHIS) in Korea, as of 2019, the socioeconomic cost of alcohol consumption was 15.806 trillion Korean won, which represented an increase of 12.4% from 13.4212 trillion Korean won in 2015 [19]. Since alcohol consumption causes serious problems for individuals and society, it is necessary to examine alcohol consumption and drinking behaviors, in order to prevent and resolve these issues.
Even when consuming the same amount of alcohol, some people quickly experience facial flushing (flushers), while others do not (i.e., non-flushers). Such different alcohol flush reactions to the same amount of alcohol consumption depends on each person’s ability to metabolize alcohol. Approximately 20% of the consumed alcohol is metabolized in the gastric mucosa by the enzyme alcohol dehydrogenase (ADH) before being absorbed into the bloodstream [20]. When ADH activity in the gastric mucosa is reduced, more alcohol is absorbed into the blood. In general, females have approximately half the level of ADH activity in the gastric mucosa as males [21]. Consequently, they are less able to process consumed alcohol. Additionally, females typically have more body fat and less body water than males of the same body weight [22]. Alcohol has low lipid solubility (lipid/water partition coefficient of 0.14), and is mainly distributed in the body water. Females and older individuals, who also have relatively lower body water percentages, show higher blood alcohol concentrations even when drinking the same amount of alcohol as males [23]. Alcohol absorbed into the blood is converted into acetaldehyde in the liver by cytosolic ADH, microsomal cytochrome P450, and peroxisomal catalase. The acetaldehyde is converted to acetate by aldehyde dehydrogenase (ALDH). During this metabolic process, a coenzyme, NAD+ is reduced to NADH. Inactive ALDH enzyme, due to a genetic variant of the ALDH2 gene, is common in Asians, and has a significantly low affinity for NAD+ [24,25]. These genetic variants follow a dominant pattern of inheritance. Drinking even a small amount of alcohol causes an increase in acetaldehyde in the blood of individuals bearing this variant, causing the face to flush immediately after consuming alcohol [26-28]. Such metabolic characteristics explain why many Koreans experience facial flushing after drinking. Conversely, it can readily be assumed that a person who demonstrates facial flushing after consuming alcohol may have a reduced ability to metabolize alcohol [29,30].
Therefore, it is unreasonable to apply a uniform standard to all when evaluating the alcohol consumption status. As a countermeasure, sex and age are also considered in the existing guidelines. Furthermore, in Korea, a new guideline for alcohol consumption has been proposed, which not only considers sex and age, but also reflects Korean body shape and alcohol-breakdown characteristics [31]. Although the proposed alcohol consumption guideline is a pioneering guideline, since they most properly reflect an individual’s alcohol metabolism capabilities, no studies that have investigated the drinking status of Koreans in accordance with this guideline [31], and in particular, no analyses of related large data, have been published to date.
In our study, in accordance with the new guideline, we tried to analyze the recent alcohol consumption status of Koreans based on representative data for Korea, i.e., the data from the Korea National Health and Nutrition Examination Survey (KNHANES) and the NHIS.
METHODS
1. Review of Items for Alcohol Status Assessment in Korea National Health and Nutrition Examination Survey and National Health Insurance Services Database
KNHANES is a statutory survey conducted by the Korea Disease Control and Prevention Agency (KDCA) on the health behavior of the people of Korea, the prevalence of chronic diseases, and the actual state of food and nutritional intake in accordance with the National Health Promotion Act, since 1998. In the past, from 1998 to 2005, the Korea Institute for Health and Social Affairs, the Korea Health Industry Development Institute, and the KDCA cooperated in conducting the survey every 3 years, and from the 4th survey, conducted in 2007, the KDCA has played an integrated role of conducting this survey every year. In the present study, raw data were used from 2019, the first year, and 2020, the second year of the 8th survey, when facial flushing began to be surveyed. The raw data can be requested and downloaded at https://knhanes.kdca.go.kr/ after signing and submitting the statistical data user compliance pledge and security pledge.
NHIS database (DB) of the Korean population’s health information contains 1.3 trillion items of big data, including qualifications and insurance premiums, health checkup results, treatment details, longterm care insurance data for older individuals, current status of medical institutions, and registration information for patients with cancer and incurable diseases. Among them, data with high demand were sampled and extracted based on national health insurance big data, and a standardized sample research DB was established for policy and academic research, after de-identifying the information of the patients. Currently, sample cohort DB, health examination cohort DB, and older cohort DB are available; however, a certain fee must be paid to use the data; the period of time for accessing the DB is limited, and the data cannot be downloaded. For this study, a research plan approved by the Institutional Review Board (IRB) of Chungnam National University Sejong Hospital (IRB no., CNUSH 2021-12-008) was submitted to and approved by the NHIS (http://nhiss.nhis.or.kr) for accessing the sample cohort DB and the health checkup cohort DB.
Items of the assessment of alcohol consumption status in the KNHANES and NHIS are summarized in Table 1.
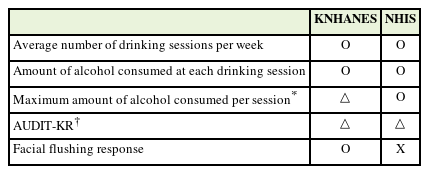
Summarization of items for alcohol status assessment
1) Amount of alcohol consumed
For alcohol consumption, the average number of drinking sessions per week, the average amount of alcohol consumed at each drinking session, and the maximum amount of alcohol consumed per session were identified to assess the drinking habits, i.e., “at-risk drinking” or “moderate drinking.” The amount of alcohol consumed was calculated by conversion to 1 standard drink. The National Institute on Alcohol Abuse and Alcoholism (NIAAA) in the United States [32] and the Korean alcohol consumption guidelines [31] define 14 g of pure alcohol as 1 standard drink, whereas the WHO defines 10 g of pure alcohol as 1 standard drink. In current study, 14 g of pure alcohol was converted into 1 standard drink according to the NIAAA and the Korean alcohol consumption guidelines. The amounts and/or volumes of 1 standard drink per various alcoholic beverages are 1.5 ounces (approximately 45 mL) of liquor (40%), 5 ounces (approximately 150 mL) of wine (12%), and 12 ounces (approximately 350 mL) of beer (4.5%). One standard drink of each liquor or wine is equal to 1 glass generally designed for each liquor or wine, and 1 bowl (approximately 300 mL) of Makgeolli (6%) (Korean rice beer). One standard drink of beer is equal to 1 can of beer or 1 small bottle of beer, and 500 mL of beer equals 1.3 standard drinks. One standard drink of Soju (20%) is 1/4 bottle (approximately 90 mL). For other alcoholic beverages, 1 standard drink was calculated using the WHO conversion formula [33]: drink volume (mL)×alcoholic strength by volume (%)×alcohol specific gravity (0.79)/100=amount of alcohol contained in one drink (g).
2) Alcohol use in lifetime and drinking frequency
In the KNHANES data, survey questions, answered by (1) “never” or (2) “yes,” regarding the individual’s alcohol consumption experience were asked to identify lifelong non-drinkers; if the answer was (2) “yes,” the following related question, such as the age at which a full glass of alcohol was first consumed, was also asked. In addition, among those who had ever drunk alcohol, the frequency of drinking during the past year was also investigated: (1) Haven’t drunk at all in the past year, (2) less than once a month, (3) once a month, (4) 2–4 times per month, (5) 2–3 times a week, and (6) 4 or more times a week. In the present study, both lifetime non-drinkers who checked (1) “never” in the question regarding lifetime drinking experience, and those who checked (2) “yes” for drinking experience, but who also checked (1) “never drank in the past year” for the question regarding the frequency of drinking in the last year, were classified as non-drinkers. Children under 12 years of age, cases with unknown data and/or non-respondents were treated as missing data.
Regarding the frequency of drinking in the past year in the NHIS data, only the following was asked: (1) ( ) times a week, (2) ( ) times a month, (3) ( ) times a year, and (4) I do not drink alcohol.
3) Amount of alcohol consumed at each drinking session
In the KNHANES, the survey question asked about the amount of alcohol consumed at each drinking session, for which the possible responses were as follows: (1) 1–2 glasses, (2) 3–4 glasses, (3) 5–6 glasses, (4) 7–9 glasses, and (5) 10 glasses or more. In present study, the answer categories from numbers 1–4 were calculated as the median values, i.e., 1.5 glasses, 3.5 glasses, 5.5 glasses, and 8 glasses. As those who consumed more than 10 cups were asked to write down the amount of alcohol consumed, the indicated amount was used as it was. Further answer categories (not applicable, don’t know, and no response) were treated as missing data. In the survey questions of the KNHANES, 1 glass of alcoholic beverage was explained with the example of 1 glass of Soju (i.e., 1 bottle of Soju is equal to 7 glasses); thus, in this study, the number of glasses of Soju×(4/7) was converted to the standard drink based on 14 grams of pure alcohol.
In the NHIS data, the amount of alcohol consumed at each drinking session was identified by asking respondents to write down directly how much they usually drink on the day of drinking. Respondents were only allowed to answer with 1 measure, i.e., glasses, bottles, cans, or volume in cubic centimeters (cc). Multiple answers were allowed for the type of alcohol. The total amount consumed per day was to be summed, and other types of alcohol were to be marked as similar types of alcohol.
4) Facial flushing
The KNHANES asked questions about alcohol-related flushing in the past as well as current alcohol flushing. For past alcohol flushing, the answer choices were (1) yes, and (2) no. For current alcohol flushing, the answer choices were (1) no, (2) occasionally, (3) often, and (4) always. Only one answer to these questions was allowed. In the current study, people who selected (1) “yes” regarding past alcohol flushing, and then selected one of (2) occasionally, (3) often, and (4) always regarding current alcohol flushing were classified as “flushers.” Those who selected (2) “no” regarding past alcohol flushing, and then selected (1) “no” regarding current alcohol flushing were classified as “nonflushers [29].” Responses of (8) not applicable, and (9) don’t know, and no response were treated as missing data. In the NHIS, no question was asked about facial flushing.
5) Heavy drinking
Heavy drinking can be determined by multiplying the amount of alcohol consumed at each drinking session (based on 1 standard drink) by the frequency of drinking per week in order to obtain the average amount of alcohol drinks per week, and then comparing this result with weekly drinking thresholds for heavy drinking.
In our study, based on the moderate drinking guidelines for Koreans, the rate of heavy drinking was investigated according to the criteria that reflected sex, age, and facial flushing. According to the drinking guidelines for Koreans, heavy drinking was defined if the average alcohol drinking per week for the non-flusher group exceeded 8 standard drinks for adult males aged up to 65 years, 4 standard drinks for adult females aged up to 65 years and adult males over 65 years of age, and 2 standard drinks for adult females over 65 years of age. For the flusher group, heavy drinking was defined if the average alcohol drinking per week exceeded half of the cut-off amounts of the abovementioned standard drink-based heavy drinking criteria for the non-flusher group [31].
In the NHIS data, the mean amount of alcohol drinks per week could also be obtained by multiplying the amount of alcohol consumed at each drinking session (based on 1 standard drink) by the frequency of drinking per week. The criteria for heavy drinking are presented in the Korean National Consultation Manual for Health Examining Physicians as the US NIAAA guidelines and the moderate drinking guidelines for Koreans, respectively [34].
6) Binge drinking
Regarding the maximum amount of alcohol consumed per session, it was impossible to apply the Korean alcohol consumption guidelines because the maximum amount/number of alcohol drinks was not directly entered in the case of KNHANES, and only a frequency of drinking more than a certain amount of alcohol was asked. In the case of males, for the question of “how often do you drink 7 or more glasses of Soju or liquor (or about 5 or more cans of beer), regardless of the type of alcoholic beverages, at 1 drinking party?,” a single answer was selected from the following: (1) never, (2) less than once a month, (3) once a month, (4) once a week, or (5) almost every day. In the case of females, for the question “how often do you drink 5 or more glasses of Soju or liquor (or about 3 or more cans of beer), regardless of the type of alcoholic beverages, at 1 drinking party?” a single answer was selected from among the same answer choices as for males. Those who selected the answer of (1) “never” were classified as non-binge drinkers, and those who selected any answer choices from (2) through (5) were classified as binge drinkers. Those who selected (8) not applicable, (9) don’t know, and no response were treated as missing data.
In the case of NHIS data, the maximum amount of alcohol drinks per day was designed to be entered directly. In accordance with the US NIAAA guidelines, binge drinking was defined when males exceeded 4 standard drinks (1 bottle of Soju) and females exceeded 3 standard drinks (3/4 bottles of Soju).
7) Clinical consultation for alcohol problems
The KNHANES asked whether people aged 19 years or more have received treatment or counseling for drinking problems at medical institutions, public health centers, alcohol counseling centers, mental health centers, etc., within the past year. The percentage of respondents who answered “yes” to this question in the 2-year survey from 2019 to 2020 was calculated. In the NHIS, there was no separate question about clinical consultation for drinking problems.
8) Alcohol drinking in adolescents
The current study also reviewed the alcohol status regarding adolescents from the KNHANES data. Drinking in adolescents aged 12–18 years was investigated: whether or not they drink, frequency of drinking, and amount of alcohol consumed per drinking session. The age of first alcohol use was also to be entered in the subjective format.
2. Research Subjects
In the case of the NHIS data, no data on facial flushing caused by drinking, which were essential data for the purpose of this study on drinking status reflecting the alcohol metabolism capabilities of Koreans, were available; thus, the NHIS data were excluded from the study. So, our study only analyzed the data from the KNHANES conducted in 2019 and 2020. The actual number of people surveyed in this KNHANES, from 2019 to 2020, was 15,469. Total 13,728 people were included in the final analysis after excluding those who were not eligible for this study, such as those under the age of 12 years, or for whom survey items necessary were missing, such as missing the drinking history, and so forth.
The present study complied with the regulations related to clinical research in accordance with the Declaration of Helsinki, and was conducted with the approval of the Institutional Review Board (IRB) of Chungnam National University Sejong Hospital (IRB no., CNUSH 2021-12-008).
3. Statistical Analysis
The complex samples were extracted by applying the primary sampling unit, stratification variables (“kstrata”), and the statistical weights set by the KNHANES in order to increase the representativeness and accuracy of the sample groups. For the complex samples, the drinking rate, drinking frequency, amount of alcohol consumed at each drinking session, facial flushing rate, heavy drinking rate, binge drinking rate, at-risk drinking rate, suspected AUD rate, and the rate of treatment and counseling history due to drinking problems within the past 1 year were identified through complex sample frequency analysis. Analyses were performed using the IBM SPSS ver. 23.0 (IBM Corp., Armonk, NY, USA).
RESULTS
1. Sociodemographic Characteristics for Subjects
The average adult male age was 47.01 years and the average adult female age was 49.12 years. In the case of children and adolescents, the average age of boys was 15.24 years, and the average age of girls was 15.08 years. In the case of men, the ratio of married people was 65.9%, and in the case of women, the ratio of married people was 75.1%. Regarding smoking history, the current smoker rate was 33.9% for males and 5.8% for females (Table 2).
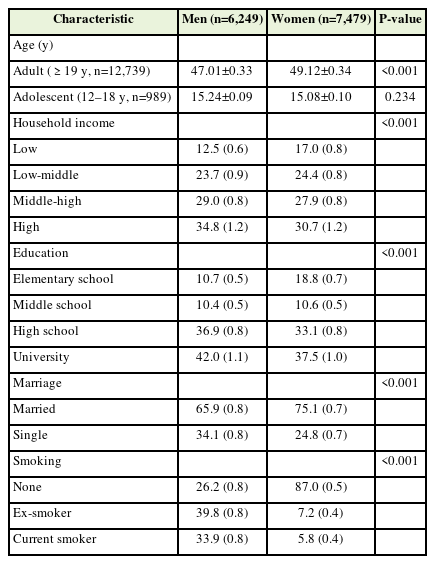
Sociodemographic characteristics for subjects
2. Alcohol Drinking rates of Korean Adults
As a result of identifying the KNHANES data, the proportion of drinkers among the total adult subjects was 74.8%. The drinking rate of total adult males was 84%, with 87.6% for men aged ≤65 years and 64.9% for men aged >65 years. The drinking rate among female drinkers was 65.8%. The proportion of drinkers among adult females ≤65 years was 73.7%, while that of adult females >65 years was 34.4% (Figure 1).

Alcohol drinking rates of Korean adults ≥19 years.
3. Proportion of Facial Flushing Response When Drinking Alcohol
When the total subjects were divided into the non-drinking group, the facial flushing drinking group, and the non-flushing drinking group, respectively, 25.2% of the total subjects belonged to the non-drinking group, and 21.5% of the remaining drinking group answered that facial flushing accompanied drinking. In the analysis by sex, the proportion of facial flushers among men was 24.8% and the proportion among females was 18.2% (Figure 2).
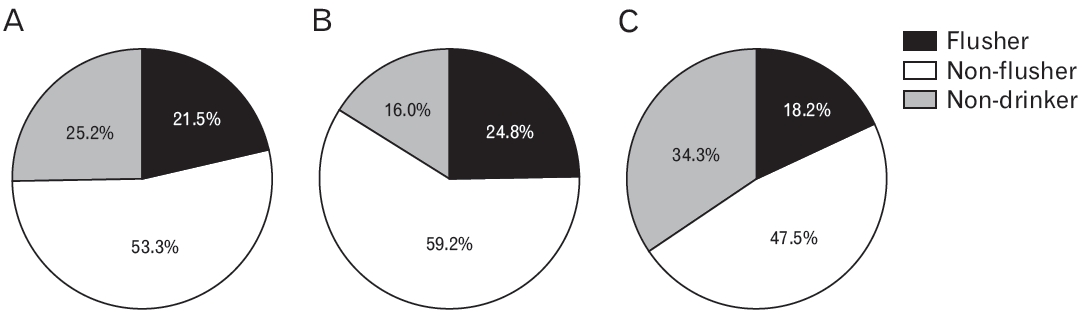
Proportion of facial flushing response when drinking alcohol. (A) Total. (B) Men. (C) Women.
4. Average Drinking Frequency per Week
In the case of adults ≤65 years among the total subjects of the KNHANES, the proportion of drinking 2–4 times a month was the highest at 25.6%. Adult males ≤65 years also had the highest proportion of drinking 2–4 times a month at 28.7%. In the case of adult females ≤65 years, the proportion of drinking less than once a month was the highest, except for non-drinkers, at 24.6%. In the case of the elderly >65 years among the total subjects, both in males and females, the proportion of non-drinkers who responded no drink at all in the last year was the highest at 52.4% (Figure 3).
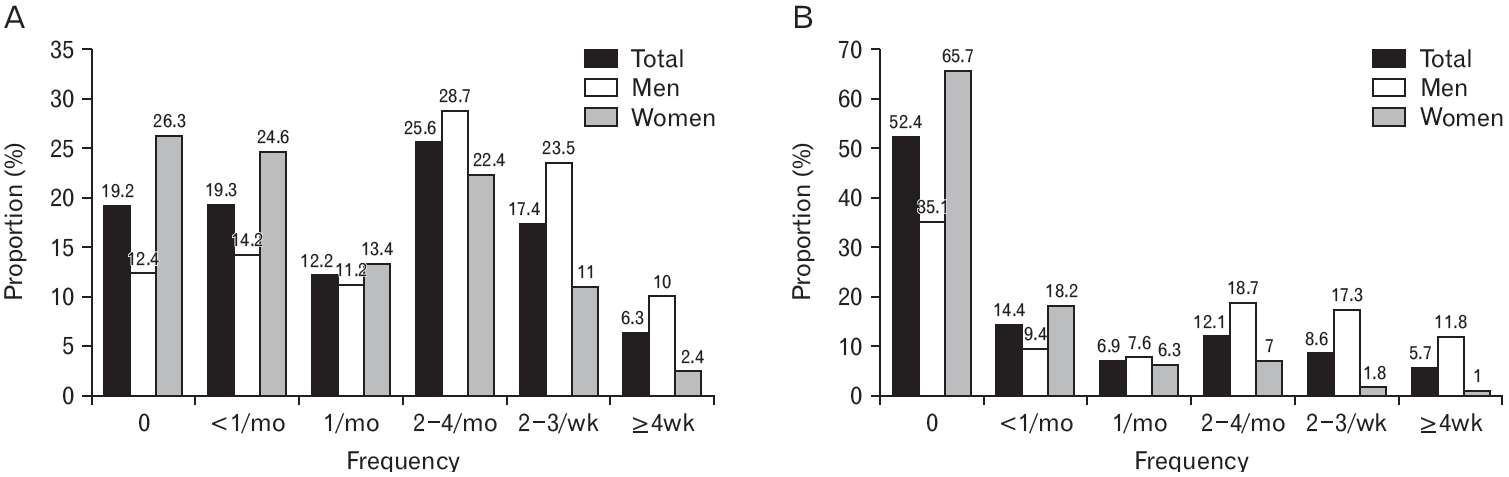
Average drinking frequency per week. (A) Age 19–65 years. (B) Age >65 years.
5. Amount of Alcohol Consumed at Each Drinking Session
According to KNHANES data, among the total subjects, all males and females ≤65 years and the male and female groups each had the highest average drinking amount of >0 but ≤2 standard drinks per drinking session at 40.2%, 28.8%, and 52.2%, respectively. In the elderly group >65 years, the non-drinking rate was the highest for total and females at 52.4% and 35.1% respectively. However, in the case of elderly males >65 years, the proportion of drinking >0 but ≤2 standard drinks per time was the highest at 38.9% (Figure 4).
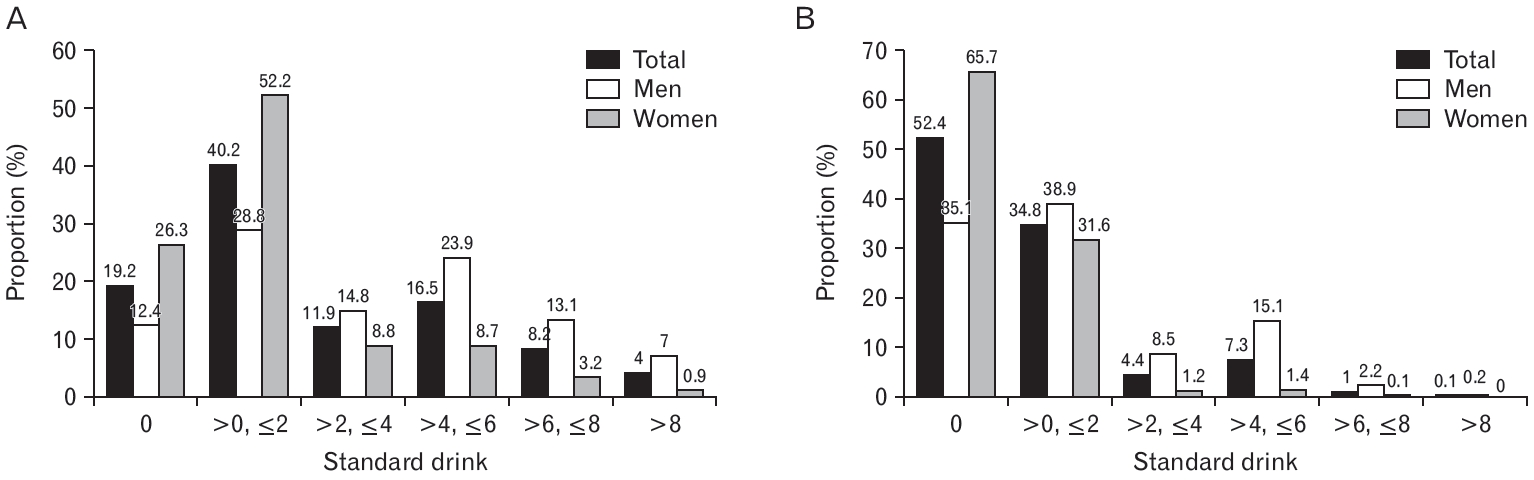
Amount of alcohol consumed at each drinking session. (A) Age 19–65 years. (B) Age >65 years.
6. Proportion of Heavy Drinking
The drinking status of all study subjects of KNHANES was classified according to age, sex, and facial flushing, as per the Korean alcohol consumption guidelines. In the case of adult ≤65 years, the proportion of heavy drinking was 28.3% for males and 14.5% for females. In the elderly >65 years, the proportion of heavy drinking was 30% for males and 4.5% for females (Supplement 1).
1) Proportion of heavy drinking by facial flushing in male drinkers
The heavy drinking proportion was analyzed based on the presence of facial flushing in the drinking group. Among adult male drinkers ≤65 years, the proportion of heavy drinking was 22% for flushers and 37% for non-flushers. Among adult male drinkers >65 years, the proportion of heavy drinking was 43% for flushers and 48% for non-flushers.
2) Proportion of heavy drinking by facial flushing in female drinkers
Among adult female drinkers ≤65 years, the proportion of heavy drinking was 28% for flushers while the proportion was 19% for non-flushers. Among adult female drinkers >65 years, the proportion of heavy drinking was 15% among flushers and 13% among non-flushers (Supplement 2).
7. Proportion of Binge Drinking
The proportion of binge drinking was determined and calculated based on the numbers of people who answered “yes” to the KNHANES questions related to binge drinking classifications. In the case of adult males ≤65 years, the proportion of binge drinking was 72.5%. For adult females ≤65 years, the proportion was 44%. The proportion of binge drinking among males >65 years was 39.9%, while that among females >65 years was 7.8% (Supplement 3).
1) Proportion of binge drinking by facial flushing in male drinkers
The proportion of binge drinking was analyzed based on the presence of facial flushing in the drinking group. In the case of adult male drinkers ≤65 years, the proportion of binge drinking was 64% for flushers and 91% for non-flushers. For adult male drinkers >65 years, the proportion of binge drinking among flushers was 46% and 68% among non-flushers.
2) Proportion of binge drinking by facial flushing in female drinkers
In the adult female drinkers ≤65 years, the proportion of binge drinking was 43% for flushers and 66% for non-flushers. Among adult female drinkers >65 years, the proportion of binge drinking was 27% for flushers and 21% for non-flushers (Supplement 4).
8. Proportion of At-Risk Drinking
At-risk drinking refers to any case of having a drinking habit that corresponds to either heavy drinking or binge drinking. The proportion of at-risk drinkers was analyzed among the total study subjects. For adult males ≤65 years, the proportion of at-risk drinking was 72.8%, and for their female counterparts, the proportion was 44.8%. In the case of adult males >65 years, the proportion of at-risk drinking was 44.4%, while that among adult females >65 years was 9.2% (Figure 5).

Proportion of at-risk drinking. (A) Age 19–65 years. (B) Age >65 years. *At-risk drinking refers to having any case of either heavy drinking or binge drinking.
1) Proportion of at-risk drinking by facial flushing in male drinkers
The proportion of at-risk drinking in the adult male flushing drinkers ≤65 years was 65%, and that in non-flushing drinkers in this age group was 91%. Among elderly male drinkers >65 years, the proportion of atrisk drinking was 53% for flushers and 75% for non-flushers.
2) Proportion of at-risk drinking by facial flushing in female drinkers
The proportion of at-risk drinking among the female drinkers ≤65 years was 46% for flushers and 67% for non-flushers. The proportion of at-risk drinking among female drinker >65 years was 28% for flushers and 26% for non-flushing group (Figure 6).
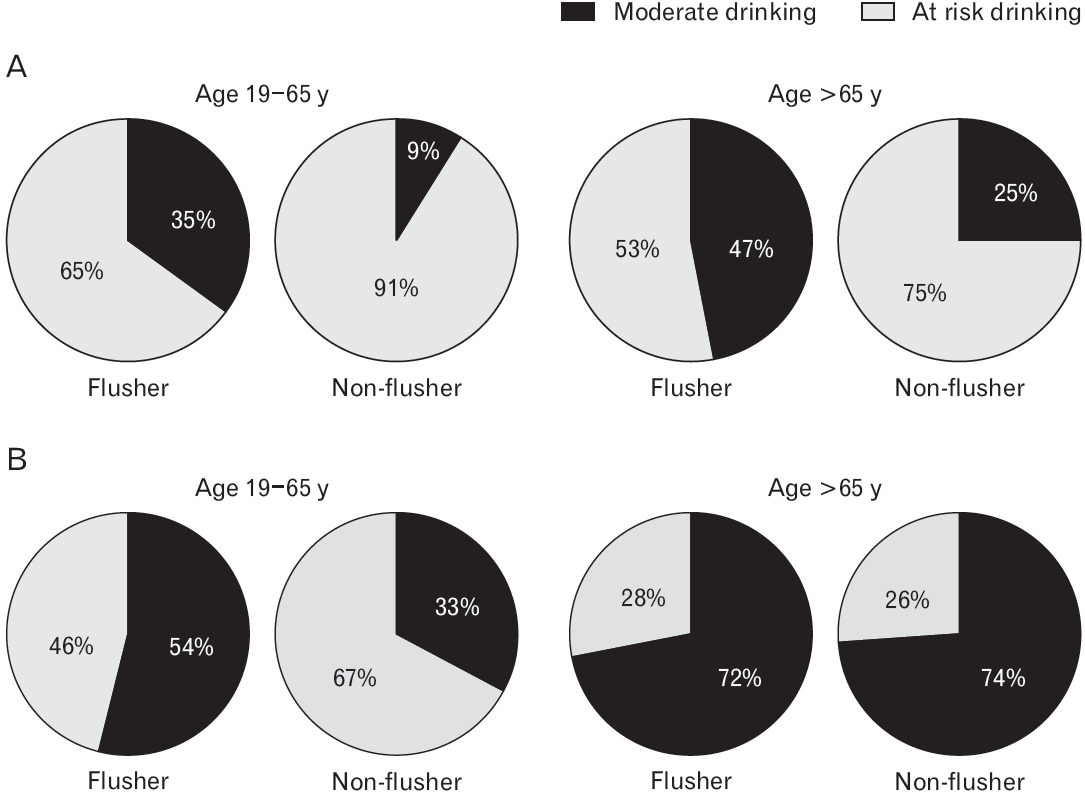
Proportion of at-risk drinking by facial flushing in drinkers. (A) Men. (B) Women.
9. Clinical Consultation for Alcohol Problems
Among all subjects aged 19 years and older, the proportion of those who answered that they had received treatment or counseling at a medical institution, public health center, alcohol counseling center, or mental health center for alcohol problems within the past year was 0.5%. By sex, only 0.8% of males and 0.3% of females had received treatment for alcohol problems (Supplement 5).
10. Alcohol Drinking in Adolescents
1) Proportion of adolescent alcohol drinking
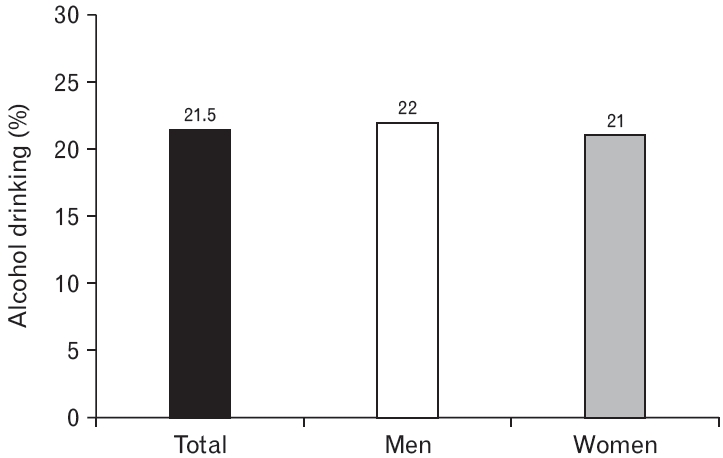
Among the total subjects aged 12 to 18, the drinking rate was 21.5%. The drinking rate was 22% among male adolescents and 21% among female adolescents (Figure 7).
Proportion of alcohol drinking in adolescents.
2) Age of first alcohol use in adolescents
Among the total adolescents, the mean age of drinking initiation was 15.45 years. By sex, males were 15.4 years and females were 15.5 years of age when they started drinking (Supplement 6).
3) Average number of drinking sessions per week in adolescents
Among all survey adolescents, the proportion of drinking less than once a month was 13.65% of the total, 12.8% of male adolescents, and 14.65% of female adolescents, the highest except for non-drinking rates. Both male and female adolescents responded that they did not drink alcohol for ≥4 times a week (Supplement 7).
4) Amount of alcohol consumed at each drinking session in adolescents
For the amount of alcohol consumed at each drinking session, 13.4% of all adolescents, 12.9% of males and 14.05% of females, responded that they had ≤2 standard drinks per drinking session (Supplement 8).
DISCUSSION
This study investigated the current status of drinking habits of Koreans according to guidelines based on Koreans’ alcohol metabolism capabilities. In particular, our study had significance as the first study to confirm whether the drinking habits of Koreans as of 2019–2020 meet the appropriate drinking standards suggested by the moderate-drinking guidelines for Koreans according to age, sex, and presence of facial flushing by utilizing the KNHANES data, which represents data derived from surveying the Korean population.
The results revealed that the drinking rate of Korean adults ≥19 years was 74.8%, which seems higher than the rates in the United States (69.5%) [35], European Union (EU) (72%) [36], and worldwide (≥15 years, 43%) [1]. In the sex-based analysis, the drinking rate of Korean adult males aged ≥19 years (84%) was higher than that of adult males in the United States in 2019 (72.0%) [35], and was similar to that of European adult males (83.3%) [36]. The alcohol drinking rate of adult females in Korea (65.8%) was not greatly different from that of females in the United States (67.1%) [35] and Europe (61.4%) [36]. In the current study, the alcohol drinking rate of elderly females >65 years was half that of elderly males during the same period, and was similar to the results of the Korean Ministry of Health and Welfare’s survey on the condition of older people during the same period (i.e., 58.4% of 4,346 elderly males, and 23.6% of 5,751 elderly females) [37].
Meanwhile, according to a press less by the KDCA based on the analysis of major health behaviors and chronic disease indicators before and after the coronavirus disease 2019 epidemic from 2019 to 2021, the monthly drinking rate showed a decreasing trend to 59.9%, 54.7%, and 53.7% [38]. The biggest reason for this is that social distancing has been enforced, and there has been a decrease in business dinners and gatherings. However, with the recent lifting of social distancing, the number of parties and drinking rates are expected to increase.
In terms of drinking frequency, adults ≤65 years had the highest proportion (≥25%) of drinking 2–4 times a month, which was similar to the highest proportion of drinking once a week (28.8%) [39] among adults in the EU. In the case of older individuals >65 years, the proportion of non-drinking was as high as 50% or more, and even if they drank, they mostly drank less than once a month (the next highest proportion). This was similar to the result of the 2018 Social Survey [40] conducted by Statistics Korea, in which the non-drinking rate of older individuals ≥65 years was high at 65.7%, and among drinkers, the rate of drinking less than once a month accounted for the highest proportion, at 29.8%.
In terms of the average amount of alcohol consumed per drinking session, adults ≤65 years mostly drank between >0 and ≤2 standard drinks per session. This was similar to the result of the Korea Welfare Panel Survey [41], conducted by the Korea Institute for Health and Social Affairs, in which the mean amount of alcohol consumed per drinking session was 1–2 glasses, as reported by approximately 25% of drinkers. According to the NIAAA study, Americans drink an average of 1.94 glasses of alcoholic beverages per drinking session [42]. In the present study, only the distribution of alcohol consumption could be identified due to the characteristics of the survey answer as categorical instead of continuous variables. However, the proportion of drinking ≤2 standard drinks per drinking session was close to 40%, which can be inferred to be similar to the mean drinking amount.
In this study, it is particularly significant that the presence of facial flushing for drinking was confirmed by using representative data for Koreans. When considering the current alcohol status, about 22% (24.8% for men, 18.2% for women) of total subjects had facial flushing accompanied by drinking alcohol. Regardless of whether they were currently drinking, about 1/3 of the total subjects were found to have experienced facial flushing before even with a small amount of alcohol. It has been reported that approximately 36% [43] to 45% [44] of East Asians, such as Korean, Japanese, and Chinese individuals, have an alcohol flushing response (i.e., “Asian flush”). The proportion of Korean facial flushing ascertained in this study was therefore similar to the percentages reported in previous studies. Facial flushing is caused by a genetic mutation: a single nucleotide polymorphism, rs671, in human ALDH2 on the long arm of chromosome 12, is known to be the cause of alcohol-related facial flushing [29,45]. Information on ALDH2 mutation can also be found in a number of DBs that allow analysis of genetic information [46-48].
The presence of facial flushing had not been properly investigated before. It was fortunate that facial flushing was reflected in the KNHANES data since 2019. Still, however, the NHIS data have no questions regarding facial flushing response. Our study attempted to analyze both the KNHANES and the NHIS data in the first place, but it was impossible to compare and analyze the Korean alcohol consumption guidelines reflecting the alcohol metabolic capabilities of Koreans with the NHIS data, which do not contain information on facial flushing. As the NHIS dataset is much larger than the KNHANES dataset, it would be useful if the NHIS data could be supplemented to reflect the information regarding facial flushing. Since the questions asked in the health examination conducted every 2 years by the NHIS are accumulated in the health examination cohort DB, it is recommended that the appropriate questionnaire items be added to allow investigation of facial flushing. With this information, it will become much easier to assess a moderate amount of drinking appropriately, based on the presence of facial flushing by sex and age.
After classifying heavy drinkers among the total subjects according to age, sex, and facial flushing, as per the alcohol consumption guidelines for Koreans, the proportion of heavy drinking among adult males ≤65 years (28.3%) and among adult females ≤65 years (14.5%) was much higher than that of US adults (6.6%). In the case of elderly females, the proportion of heavy drinking decreased by more than 1/3 around the age of 65 years, and although this proportion was higher, it was not largely different from the heavy drinking rate among older US individuals (approximately 3%). However, the proportion of heavy drinking among elderly males >65 years (30%) was higher than that of adult males ≤65 years in Korea, suggesting that the problem of heavy drinking in older males was much more serious. In the United States, the heavy drinking rate among older individuals (approximately 3%) was approximately half of that of all adults in the United States [35]. It seems that heavy drinking problems among Korean elderly individuals need to be addressed more actively.
The proportion of heavy drinking was higher in non-flushing male drinkers than in flushing drinkers, in all age group. It can be inferred that drinking more than a certain amount is more difficult for flushers than non-flushers due to the accompanying unpleasant disulfiramlike reactions (such as nausea and headache) [6] when drinking alcohol. In this study, heavy drinking was determined by taking the median value for each category of alcohol amounts consumed at each drinking session, which was not an exact figure. This is a limitation of the survey, in which participants were asked to choose among multiplechoice answers grouped by the number/amount of drinks instead of directly entering the number/amount of drinks per session.
Both males and females in Korea showed a very high rate of binge drinking. When compared to proportion of adult binge drinking worldwide (18.2% in 2016), in the United States (25.8% in 2019) [35], and even in Europe (30.4% for total, 47.4% for males and 14.4% for females in 2016) [36], the proportion of binge drinking among Korean adults ≤65 years was very high (72.5% for males, 44% for females). Among older individuals >65 years, 10% in the United States reported binge drinking at least for one time during the 2019 survey [49]. The rate of binge drinking among elderly males >65 years in Korea was much higher, at 39.9%, suggesting that they often drink until they become intoxicated at a drinking session. According to the WHO report, as of 2016, 30.5% (47.8% of males, 13.6% of females) of all adults ≥15 years in Korea were binge drinkers, which was higher than the rate in the United States (26.1% overall, 41.5% male, 11.1% female) [1]. This result was derived from defining the standard for binge drinking in the same way as in other countries, i.e., the consumption of 60 g or more of alcohol per drinking session. In contrast, in this study, the criteria by sex, age, and facial flushing presented in the alcohol consumption guidelines for Koreans were lower than the standard/cut-off value in other countries. Based on the Korean alcohol consumption guidelines, it is anticipated that the binge drinking rate would be even higher.
When considering the drinking group alone, the proportion of binge drinking was very high, over 90%, in non-flushing adult male drinkers ≤65 years. In other words, in the case of young adult males who may not experience facial flushing after drinking alcohol, most tended to have a binge drinking habit whenever they drink alcohol. The reason for such a habit may be a lower resistance to drinking. Therefore, more attention should be paid to drinking among non-flushers. However, in the case of elderly females >65 years, the proportion of binge drinking among flushing drinkers was higher than in non-flushing drinkers. This finding may be due to the lower number of cases of drinking alcohol in females >65 years with alcohol flushing; thus, further investigation is required.
Definitions of binge drinking vary per countries and institutions. One standard drink is defined as the amount of alcohol (14 g) that can be metabolized and broken down by the liver in 1 hour, and NIAAA defines binge drinking as drinking more than 4 (or 5 or more) drinks in a row for males, and more than 3 drinks in a row for females. These cut-off values are derived from the legal limit of intoxication of 0.08 g/dL, which could be reached within 2 hours after consuming 5 drinks for males and 4 drinks for females [50]. The WHO also defines heavy episodic drinking as drinking 6 or more drinks (i.e., 60 g of alcohol) in one drinking session, when a standard drink is defined by 10 g of alcohol [1]. In the Korean alcohol consumption guidelines, while reflecting the standards of the NIAAA, new standards have been proposed that reflect the alcohol metabolism capabilities of Koreans. After considering the significant difference in the average body weight between Korean adults and American adults (i.e., an average American adult males weigh about 1.3 times more than an average Korean adult males, and an average American adult female weighs about 1.4 times more than an average Korean adult female), the binge drinking cut-off value for Korean adult males is defined as drinking more than 3 standard drinks (more specifically, 3.16 standard drinks), which is lower than the US cut-off of 4 standard drinks, and for Korean adult females, when they drink more than 2 standard drinks (in detail, 2.21 standard drinks), which is lower than the US cut-off of 3 standard drinks; when considering that a moderate weekly drinking amount for flushers is half that for non-flushers: 1.5 standard drinks and 1 standard drink have been suggested as cut-off criteria for defining binge drinking among for male and female flushers, respectively [31].
However, there are limitations in the actual binge drinking assessment in both the KNHANES and the NHIS data, as follows. First, it is unable to assess the maximum amount of alcohol consumed per session accurately with the KNHANES. In the KNHANES, the cut-off value for binge drinking was provided as 7 glasses for males and 5 glasses for females, along with the frequency of drinking, in order to check whether drinking exceeds this provided amount, rather than a self-reported form in which the maximum amount of alcohol consumed per session can be directly entered. Therefore, it is not possible to obtain quantified data on the maximum drinking amount, which would differ across individuals.
Second, binge drinking was determined by the answer choice of drinking 7 or more glasses (or 5 cans of beer) for males, and drinking 5 or more glasses (or 3 cans of beer) for females, regardless of whether it is Soju or liquor. However, since the alcohol content of 1 glass of Soju and of 1 glass of liquor is not the same, measurement errors may occur. One glass of whisky of 40-degree liquor may contain approximately 45 mL (1.5 ounces), which may contain approximately 14 g of alcohol, which is equivalent to 1 standard drink. A 1/4 bottle (approximately 90 mL) of 20% Soju may contain approximately 14 g of alcohol, equivalent to 1 standard drink. The capacity of 1 glass of Soju is approximately 50 mL, equivalent to 0.57 standard drink (approximately 7.6 g of alcohol). One standard drink is equivalent to 1.875 Soju glasses. Therefore, when considering both a glass of Soju and a glass of liquor as the same standard drink, based on the binge drinking defined by the KNHANES, “drinking 7 or more glasses (or approximately 5 cans of beer) regardless of Soju or liquor,” a problem arises in that liquor drinkers, who may correspond to binge drinkers with a smaller amount of liquor than soju, may not be classified as binge drinkers.
Third, the KNHANES defined binge drinking as 7 or more drinks for males and 5 or more drinks for females, based on Soju or liquor glasses, per drinking session. As a result, it becomes difficult to assess binge drinking accurately, because the KNHANES definition of binge drinking did not meet both the standards of binge drinking in the United States and Korea.
Fourth, in the case of the NHIS data, it would be advantageous to obtain digitized data by directly entering the maximum amount of alcohol drinking. However, the NHIS data have a limitation in that the current binge drinking standard follows the US NIAAA standard. Even if we had attempted to apply the Korean standard, since the presence of facial flushing is not available in this dataset, it is difficult to apply the criteria for binge drinking of Koreans, which vary depending on age, sex, and presence of facial flushing. Thus, as discussed above, it is necessary to investigate the presence of facial flushing response.
Meanwhile, it is considered as at-risk drinking, if either binge drinking or heavy drinking is applicable. The proportion of at-risk drinking was 72.8% for adult males ≤65 years. This proportion was very high compared to that of adults in the United States (28% in 2005) [51]. In particular, when considering drinkers alone, the proportion of at-risk drinking was extremely high at 91% in adult male non-flushing drinkers ≤65 years. This rate was consistent with the high rate of heavy drinking and binge drinking discussed above. Among male drinkers, regardless of age and facial flushing, the proportion of at-risk drinking was higher than that of moderate drinking. Therefore, for males, it is particularly necessary to improve social awareness of at-risk drinking and to establish countermeasures. In the case of adult females, the proportion of at-risk drinking by those ≤65 years was approximately 45%, and in particular, among non-flushers ≤65 years, the proportion of at-risk drinking approximated 70%, which is a very high level. Among flushers ≤65 years, the proportion of moderate drinking was high, as in elderly females, suggesting that the facial flushing reaction seems to be a factor in preventing heavy drinking and binge drinking.
In the KNHANES, the proportion of respondents who answered that they had received treatment or counseling at a medical institution, public health center, alcohol counseling center, and/or mental health center for drinking problems within the past year was 0.5% of all adults ≥19 years (0.8% for males, and 0.3% for females). When considering the high rates of at-risk drinking and AUD among adults in Korea, it seems that those who need appropriate treatment have not been receiving clinical consultations.
In the United States, approximately 14% of adults ≥18 years were diagnosed with AUD in the past year, as of 2019, but only 7.3% (6.9% males, and 7.9% females) among them had received any treatment, while approximately 4% of them had received treatment with medication [52,53]. In Europe, the proportion of AUD diagnosis in primary health care settings was 11.8% per year, but only 17.6% of these individuals were receiving treatment [54]. In Korea, exceptionally fewer Koreans were seeking clinical consultations and/or advice for drinking problems, and consequently, most Koreans with alcohol-related problems do not receive diagnosis and any treatment.
There are several reasons for the low treatment rates for alcohol problems such as at-risk drinking or AUD. First, because primary care physicians (general practitioners) are unaware of alcohol problems, they are less likely to treat or refer patients to specialized healthcare. In addition, people tend to be reluctant to seek treatment due to the social stigma of AUD, and patients tend not to seek treatment until the problem becomes really severe [54,55]. If an individual has at-risk drinking or AUD, he or she has to seek treatment actively, because it can lead to various health problems. It should be possible to determine and diagnose whether or not drinking habits correspond to at-risk drinking or AUD, such as heavy drinking or binge drinking. If at-risk drinking or AUD is diagnosed, clinical consultations and treatment should be provided appropriately.
The proportion of alcohol drinking of Korean adolescents was 21.5%, which was similar to that in the United States (21.2%) [35]. The average age of first alcohol use in adolescents was about 15 years for both male and female adolescents. The ages in the present study were higher than the average ages of starting drinking determined in the Adolescent Health Behavior Survey (13.2 years overall, 12.9 years in male adolescents, and 13.5 years in female adolescents) [56]. In the United States, male adolescents started drinking on average at the age of 15.3 years, and female adolescents at the age of 15.6 years [57], and the median age was 14.87 years from 2017 to 2019, which was not significantly different from that in Korea [58]. In Europe, male adolescents started drinking on average at the age of 12.3 years, and female adolescents at the age of 12.9 years [59], and approximately 90% of adolescents aged 15–16 years have already experienced alcohol drinking [60]. It seems that drinking begins at a much younger age in Europe than in Korea and the United States. This could be explained by a legal drinking age of 19 years in Korea, 21 years in the United States; but 16–18 years in Europe. It is suggested that drinking prevention education is necessary, because the age at which drinking begins in children and adolescents can have a significant impact on drinking in adulthood, the rate of drinking, and the future health problems caused by drinking or other substance abuse [61].
Approximately 20% of adolescent experienced drinking, and the average number of drinking sessions per week, was the highest among those drinking less than once a month, except for non-drinkers, at about 14.8%. However, the proportion of drinking once or more per month accounted for approximately 8% among all adolescents, which is also considered to be a serious problem. According to a survey conducted by the Ministry of Health and Welfare in Korea, 21.8% of adolescents aged 12–17 years who have had a drinking experience in 2018 had drunk at least once in the last month [62], implying that more adolescents drink frequently than indicated by the results of this study. In the United States, 18% of males and 9% of females aged 12–17 years in 2018 reported drinking at least once a week [35], indicating that Korean adolescents were considered to drink less often than American adolescents. In terms of the average amount of alcohol consumed at each drinking session in adolescents, except for non-drinkers, the highest proportion was for 2 standard drinks or less. However, about 8% of adolescents drink more than 2 standard drinks per time. Youth prevention education on drinking problems is crucial.
In conclusion, this study is meaningful as an attempt to analyze the drinking status of Koreans in accordance with the moderate drinking guidelines that reflect the alcohol metabolic capabilities of Koreans. In addition, our study examined the presence of facial flushing using the representative data for Koreans of the KNHANES, which has not been reported previously. Although data from the NHIS were originally obtained to review alcohol related data, it could not be used because the information regarding the presence of facial flushing was not included. Hence, although the NHIS dataset includes very valuable data, it was excluded from the final analysis of the present study because it was not possible to analyze the data while reflecting the alcohol metabolism capabilities of Koreans as addressed in the Korean alcohol consumption guidelines. In addition, although the AUDIT-KR assessment is being conducted at the age of 40, 50, 60, and 70 years of age in the national health examination, such data do not yet exist as computerized and/or digitized data format in the NHIS DB. In future, therefore, computerization and/or digitization are required for research on drinking, along with drinking data with consideration of the alcohol metabolism capabilities of Koreans. Finally, although this is not a problem unique to Korea [63], there is no consistency in assessing drinking amount the KNHANES, the Ministry of Health and Welfare, and the NHIS in Korea, resulting in confusion not only in alcohol-related investigations, research, and policy establishment, but also in public awareness and prevention education. For an accurate assessment of drinking status, it is recommended that standard criteria presented in the drinking guidelines for Koreans be used, or that the amount of drinking should be matched by using an accurate conversion method. In conclusion, in order to prevent and reduce alcohol-related problems, it is necessary to have continuous discussions among industry, academia, and research institutes for the purpose of accurate assessment of alcohol consumption.
Notes
CONFLICT OF INTEREST
No potential conflict of interest relevant to this article was reported.
SUPPLEMENTARY MATERIALS
Supplementary materials can be found via https://doi.org/10.4082/kjfm.23.0024.
Proportion of heavy drinking.
Proportion of heavy drinking by facial flushing in drinkers.
Proportion of binge drinking.
Proportion of binge drinking by facial flushing in drinkers.
Clinical consultation for alcohol problems within the past year in Korean adults ≥19 years.
Age of first alcohol use in adolescents.
Average number of drinking sessions per week in adolescents.
Amount of alcohol consumed at each drinking session in adolescents.