Factors Associated with Depression among Working-Age Household Heads in Korea: A Cross-Sectional Household Study
Article information

Abstract
Background
Depression is a mental disorder common worldwide. This study determined the relationships between demographics, health status, household parameters, and depression rates among working-age household heads.
Methods
We analyzed data from the Korea Welfare Panel Study Survey conducted in 2020. The 11-item version of the Center for Epidemiologic Studies Depression Scale was used to assess depression. Bivariate analyses and a multiple logistic regression model were used to evaluate the influence of these factors on depression among household heads.
Results
The overall prevalence of depression among working-age household heads was 11.69% (19.83% of females and 9.58% of males). The relative risk of depression was 1.71 times higher among the unemployed than among wage earners and 2.18 times higher among those with low income than among those with general income. The relative risk of depression was 3.23 times higher in those with poor health status than in those with good health, and 2.45 times more in those with severe disabilities than in those without disabilities. The rate of depression decreased with education level, number of family members, and presence of children but increased with the presence of the disabled or elderly.
Conclusion
This study provides a comprehensive overview of depression among working-age household heads and identifies factors strongly associated with depression. These findings may have implications for policymakers to reduce the burden on and improve the quality of life of household heads.
INTRODUCTION
Depression has long been recognized as a common mental disorder worldwide. According to data from the World Health Organization, an estimated 3.8% of the global population suffers from depression, including 5.0% of adults [1]. Unlike normal mood fluctuations, depression is characterized by persistent sadness and a lack of interest or pleasure in previously rewarding or enjoyable activities [2]. It can disrupt sleep and appetite, cause tiredness and poor concentration, and can significantly affect a person’s ability to function and live a rewarding life [3]. At its worst, depression can also lead to suicide [4]. Depression is a leading cause of functional disability and contributes significantly to the global burden of disease [1]. It is projected to cause the highest burden of disease in high-income countries by 2030 [5]. Therefore, the identification of factors affecting depression has implications for healthcare in communities, families, and society.
A household is defined as a group of two or more people sharing the same accommodation and living expenses or a person living alone and occupying a housing unit. The household head is the one who provides most of the family’s needs and knows all the activities and occupations of the family members [6]. According to Statistics Korea’s 2020 Population Census [6], there were 21,484,785 households, of which approximately 78% had working-age household heads (aged less than 65 years). While recent studies have focused on analyzing depression in schoolchildren, students, females, and older adults, none have addressed working-age household heads, who are under considerable economic stress to support their families [7-10].
Several recent studies have examined depression among family caregivers [11,12]. Factors strongly associated with depression were also identified in this study. However, these studies only included households with members suffering from specific diseases such as stroke or cancer or those undergoing palliative radiotherapy. Moreover, it was difficult to determine the exact relationship between caregivers and the household heads.
A recent North-Central Nigeria study revealed the prevalence of depression and the correlation between armed conflict and depression among household heads [13]. However, the study did not show the influence of household parameters, such as the number of family members or the disability status of family members. Furthermore, cultural and socioeconomic differences have reduced the significance of this study in the Korean social context. Several other studies on the prevalence of depression in Korea have been conducted recently [14-20]. However, to the best of our knowledge, no study has analyzed the depression rate among working-age household heads.
Therefore, this study aimed to assess the associations of demographic factors, health status, and household parameters (such as household income; number of family members; and presence of children, elderly, or disabled members) with depression among working-age household heads who play a direct role in creating wealth and prosperity in society. This study is based on insights from a survey conducted in Korea in 2020.
METHODS
1. Study Design and Participants
This study used data from the Korea Welfare Panel Study (KOWEPS) survey conducted by the Korea Institute for Health and Social Affairs and Seoul National University. The KOWEPS has been conducted annually since 2006 as face-to-face interviews. It targets households living across the country and covers a wide range of topics, such as health and health care, economic activity status, income, and consumption. In particular, these surveys have significantly covered households with incomes below 60% of the standard median income, and 100% of household heads have been covered by either national health insurance or government benefits [21]. Thus, data from the KOWEPS are appropriate for confirming depression and economic pressure on household heads. In this study, we used 2020 data as the most recent year of published data. A total of 6,029 households were surveyed in the 2020 data, including heads of households aged between 22 and 98 years. This study targeted households with heads younger than 65 years (2,853 households). The aim of this study was to identify depression among working-age household heads who face significant economic burdens in supporting their families. After filtering and removing missing data, the final sample comprised 2,839 households, corresponding to 2,839 working-age household heads. Detailed information about these surveys and the KOWEPS data is publicly available on the survey organization’s website [22]. Because the KOWEPS data used in this study are publicly available, ethics approval from the institutional review boards of the authors’ affiliated institutions was not required.
2. Depression Status
The KOWEPS considers participant depression based on an 11-item version of the Center for Epidemiologic Studies Depression Scale and includes lack of appetite, unhappy state, depression, difficulty with activities of daily living, sleeplessness, loneliness, complaints, unfriendly treatment, sadness, dislike, and demoralization. This scale is a shortened version of the 20-item scale developed by Radloff [23]. This shortened version has been used extensively in recent research and has been found to be preferable to the original 20-item version because it reduced the likelihood of false positives, particularly in older adults [24]. In addition, results from previous studies demonstrated that the 11-item scale was highly correlated (Pearson correlation coefficient, r=0.95) with the full version [25]. There were four responses (0=“almost never”; 1=“some of the time”; 2=“much of the time”; and 3=“most of the time”) for each item, and participants indicated the corresponding score reflecting their experience of the previous week. The depression index was calculated as the sum of the scores on the 11 items. Participants with a higher depression index experienced more severe depression. In this study, to avoid data dispersion, we used the threshold proposed by the KOWEPS survey organization to define depression status. Accordingly, participants with a depression index less than 16 were considered non-depressed; otherwise, they were considered depressed. This approach is consistent with those of previous studies [21,25].
3. Demographic and Health Parameters
Demographic and health parameters of the household heads were considered in the research criteria. Demographics included sex (male and female), age group (22–54 years and 55–64 years or older, corresponding to the prime working-age group and mature working-age group, respectively, based on the classification of the South Korean Age structure [26]), educational status (middle school or lower, high school, and college or higher), marital status (married; unmarried including single mothers; and others including bereaved, divorced, and separated), and type of employment (wage earners, employers, and unemployed). The health parameters were self-rated health (good or not good), disability status (none, moderate, or severe), and the presence of chronic disease (yes or no).
4. Household Parameters
Household parameters played an important role in our study to indicate the depression of household heads. Household-related variables were defined based on KOWEPS survey information. These included household income classification (general and low, based on 60% of the standard median income before receiving government benefits), number of household members, presence of disabled members (yes or no), presence of the elderly aged 65 years or older (yes or no), and presence of children under 15 years of age (yes or no). Age determination for the elderly (65 years or older) and children (under 15 years) was based on the classification of the South Korea Age structure [26].
5. Statistical Analysis
We determined the prevalence of depression among household heads based on demographic characteristics, health status of the household head, and household parameters. Bivariate analyses were employed to determine participant characteristics and estimate the prevalence of depression. Fisher’s exact test was used to calculate P-values for the prevalence of depression across participant characteristics and household parameters [27]. A P-value less than 0.05 represented a significant difference.
A multiple logistic regression model was used to evaluate the influence of these factors on the presence of depression [28]. In this model, the depression status of the household head was the dependent variable, while the predictors were demographics, health parameters of the household head, and household parameters. The Wald test was used to calculate the P-value for parameter estimation, and the likelihood-ratio chi-square (LRC) test was used to assess model fit [29]. The “not depressed” category of depression status was designated as the reference for the model. The odds ratios (ORs) were obtained by exponentiating the regression coefficients and the corresponding 95% confidence intervals (95% CIs). The OR represents the relative risk ratio of depression status associated with a one-level change in the respective predictor. All analyses were conducted using the R software ver. 4.2.1 (The R Foundation for Statistical Computing, Vienna, Austria; https://www.r-project.org/).
RESULTS
1. Characteristics of Household Heads and the Prevalence of Depression
We included 2,839 household heads with a mean age of 49.23 years (standard deviation=10.24 years; range, 22–64 years), of whom 2,254 (approximately 79.4%) were male. The overall prevalence of depression was 11.69%; however, 19.83% of the female household heads had depression, which was more than double the prevalence among males (9.58%). Participants of prime working-age (22–54 years) comprised 63.75% of the study population, but the prevalence of depression among them (10.17%) was significantly lower than in the mature working-age population (14.38%). Considering educational status, household heads with a college education or higher accounted for the largest proportion (47.52%), while those with a middle school education or lower accounted for 14.93%. The prevalence of depression decreased sharply with an increase in education level: 19.58% among household heads with middle school education or lower, 13.04% among those with high school education, and 8.15% among those with college education or higher. The prevalence of depression varied sharply by marital status, from 8.23% among married couples to 15.61% among unmarried people (including single mothers) and up to 20.73% among those bereaved, separated, or divorced. With respect to the employment type, the lowest prevalence of depression was among wage earners (8.53%) and the highest was among unemployed household heads (29.73%). Those who rated their health as “not good” had a high prevalence of depression (38.22%). Similarly, the depression rate among those with severe disabilities was 35.64%. The characteristics of the household heads and prevalence of depression are shown in Table 1.

Characteristics of household heads and the difference in the prevalence of depression
2. Prevalence of Depression among Household Heads by Household Parameters
Depression rates among household heads according to household parameters are shown in Table 2. Low-income households accounted for 85.45% of all households. The depression rate among the heads of low-income households was approximately 31%, which was more than 3.6 times higher than the rate among the general-income households. The depression rate among the household heads gradually decreased as the number of family members increased. Specifically, for single-member households, the depression rate among household heads was 17.2%, which decreased to 14.51% for two-member households, 10.7% for three-member households, and 7.79% for households with more than three members. This was similar in households with and without children. Specifically, the depression rate among heads of households with children was low (7.27%), whereas it was 13.51% for households without children. In households with disabled members, the depression rate among household heads (19.6%) was nearly twice as that among households without disabled members.
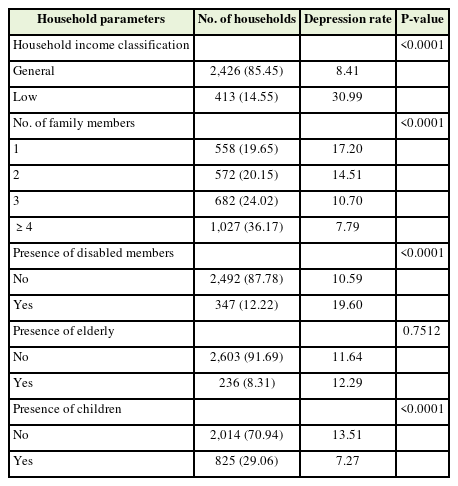
Prevalence of depression among household heads by household parameters
3. Sex-Differentiated Impact on Depression Rates in Household Heads
Figure 1 illustrates the sex-differentiated impacts of demographics, health status, and household parameters on the prevalence of depression among household heads. In general, the rate of depression was significantly higher among female household heads than male household heads. However, in the group of household heads with a severe disability, the prevalence of depression was significantly lower among females than among males (25.81% versus over 40%, respectively) and even lower than the prevalence in females with a moderate disability (39.13%). There was no significant difference in depression between males and females in households with children.
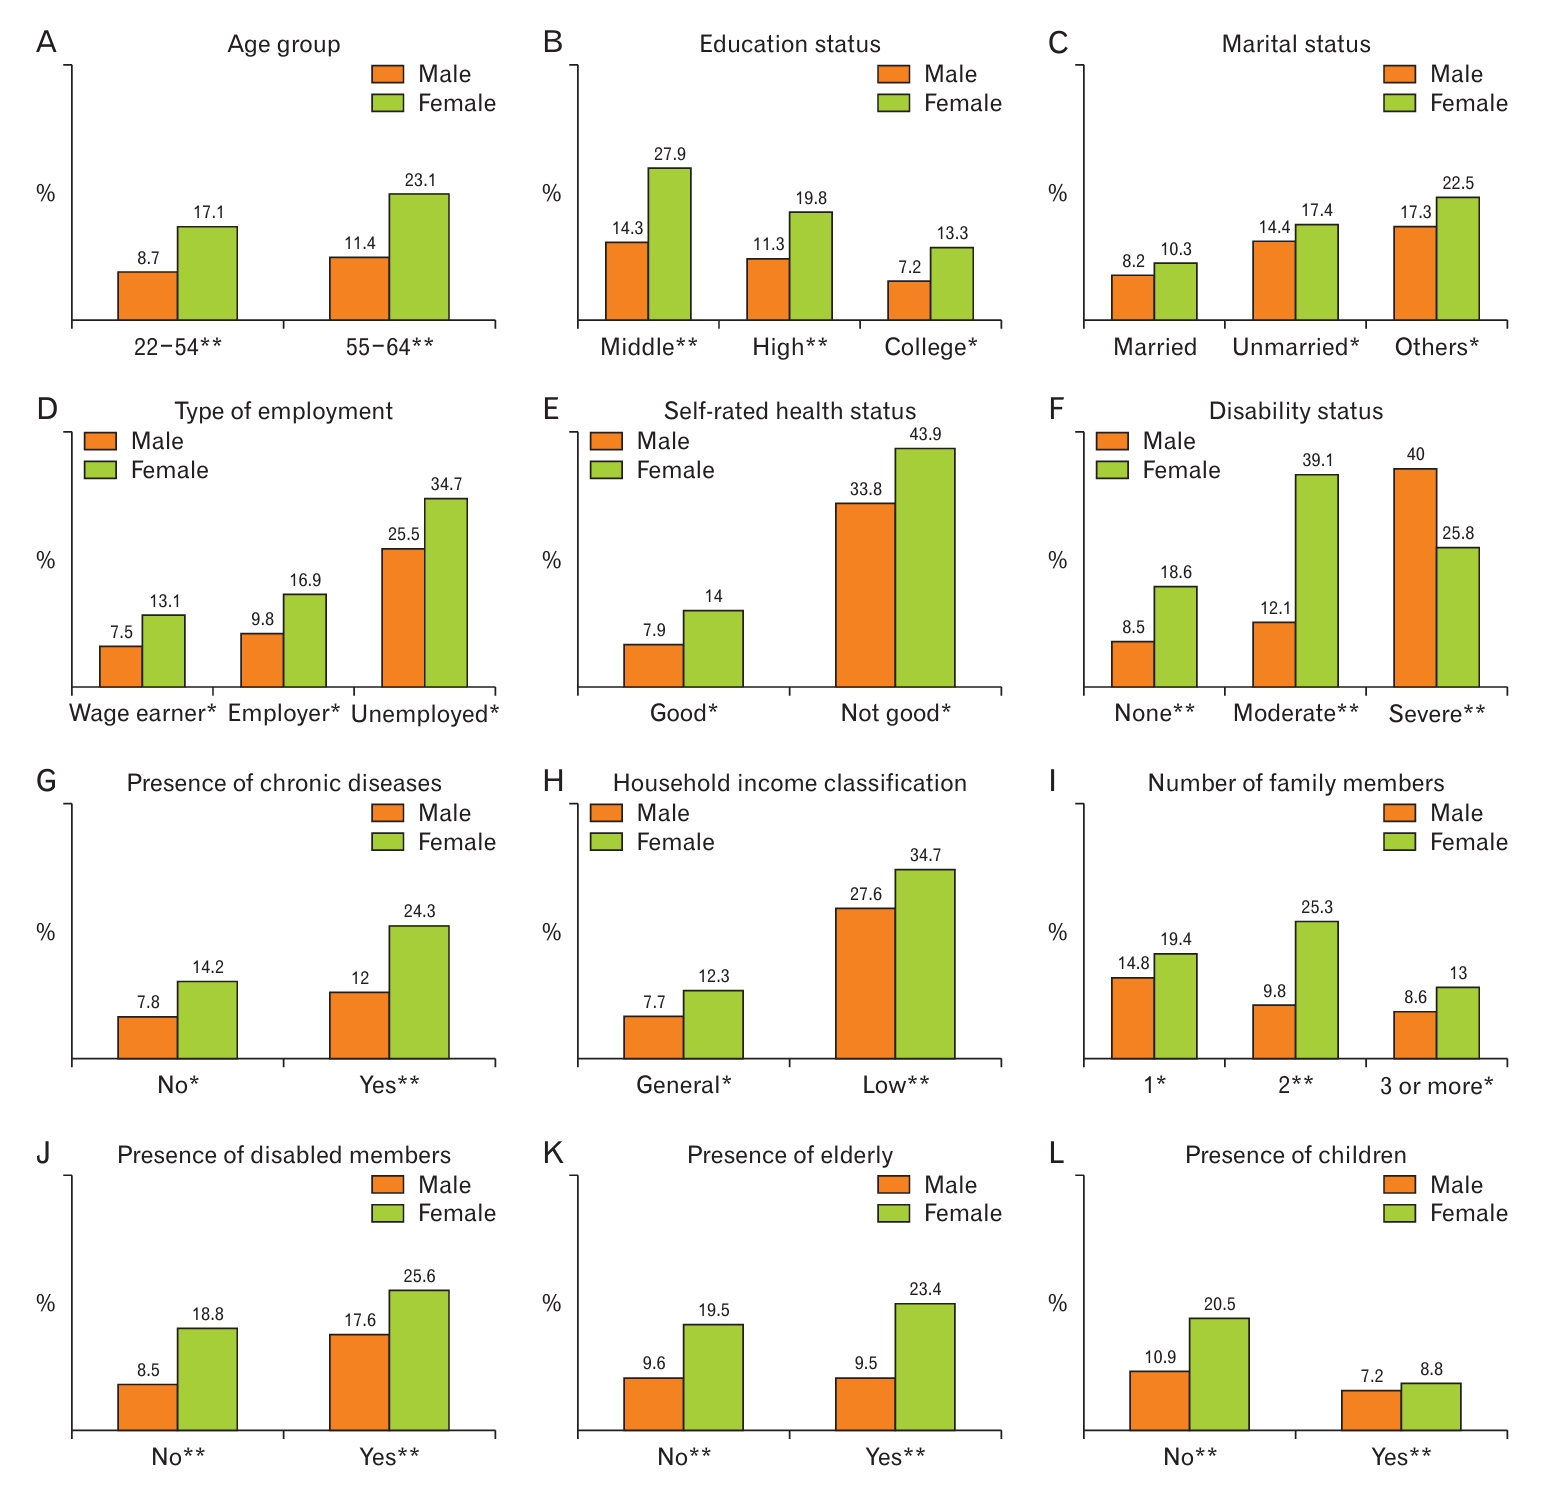
Sex-differentiated impact of demographics, health status, and household parameters on the prevalence of depression among household heads. Fisher’s exact test was used to calculate P-values for different factors affecting the prevalence of depression. (A) Age group. (B) Education status. (C) Marital status. (D) Type of employment. (E) Self-rated health status. (F) Disability status. (G) Presence of chronic diseases. (H) Household income classification. (I) Number of family members. (J) Presence of disabled members. (K) Presence of elderly. (L) Presence of children. *P<0.05. **P<0.01.
4. Multiple Logistic Regression Analysis
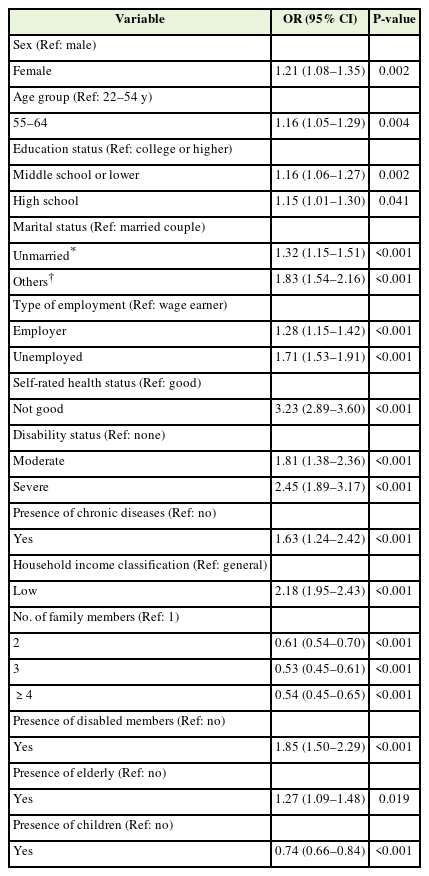
The results of the multiple logistic regression analysis are presented in Table 3. The small P-value from the LRC test (<0.00001) demonstrates the adequacy and robustness of the model.
Results of multiple logistic regression analysis for depression among household heads
The results obtained from multiple logistic regression analysis showed the varying influences of factors on depression among household heads. All factors had a significant effect on depression (P<0.05). The relative risk of depression was 1.21 times higher among female household heads than among the male household heads. Unmarried household heads (including single mothers) had a relative risk of depression that was 1.32 times higher than married household heads and 1.83 times higher than household heads who were bereaved, divorced, or separated. Similarly, the relative risk of depression was 1.71 times higher for unemployed household heads than for wage earners. The relative risk of depression was 3.23 times higher in those with poor health status than in those with good health, and 2.45 times more in those with severe disabilities than in those without disabilities. Those with chronic diseases had a higher relative risk of depression (1.63 times) than those without. Household income had the strongest influence on depression among household heads. The relative risk of depression among household heads with low household incomes was 2.18 times higher than the risk among household heads with general household incomes. The relative risk of depression among household heads decreased with the number of family members or family members who were children but increased in households with members who were disabled or elderly.
DISCUSSION
The prevalence of depression has been increasing, particularly in developed countries such as Korea [30]. While recent studies have focused on analyzing depression in schoolchildren, students, women, the elderly, and people with disabilities, heads of households who are under considerable economic stress to support their families have been ignored [7-10]. This study focused on the prevalence of depression among working-age household heads, based on insights from the Korea Welfare Panel Study survey conducted by the Korea Institute for Health and Social Affairs and Seoul National University in Korea in 2020.
Using statistical analysis, this study highlighted the prevalence of depression among working-age household heads and the factors strongly related to the presence of depression. We analyzed the influence of demographic factors, health factors, and household parameters on depression among household heads. The results show that the factors strongly related to depression among working-age household heads include sex, marital status, education status, type of employment, health status, disability status, presence of chronic diseases, household income, number of family members, and the presence of elderly members, disabled members, or children. These findings provide a scientific basis for policymakers in healthcare, welfare, family, and society in Korea.
We found that the relative risk of depression in female heads was 1.21 times higher than that in male heads of household. In Korean society, the percentage of female heads of households is much lower than that of males, mainly consisting of single mothers, those living alone, and those who are widowed, separated, or divorced [8]. The economic burden placed on them was greater than that on the male heads of households. This finding is consistent with those of recent studies conducted in Korea [11]. However, in the group of household heads with severe disabilities, the rate of depression in females was significantly lower than in males. This is a novel and interesting finding. This may stem from the gender perspective in East Asian societies where men are always conscious of being the breadwinners of their families [31]. Therefore, having a severe disability causes them to be significantly limited in carrying out their role. Furthermore, men’s mental stamina may not be as enduring as women’s [32]. These factors may explain have increased the rates of depression. Further studies on depression among female heads of households should be conducted.
Interestingly, the relative risk of depression was significantly higher among employers than among wage earners. This can be explained by the greater pressure experienced by employers to grow their businesses, avoid losses and bankruptcy, and ensure employee income. However, these burdens do not apply to wage earners.
The risk of depression is much higher among household heads in poor health compared with those in good health (3.23 times) or among those with severe disabilities compared with those without disabilities (2.45 times). In particular, the prevalence of depression was significantly higher in male heads with severe disabilities (over 40%) than in female heads (25.81%). This finding suggests the need for governmental policies related to the healthcare of people with disabilities.
Interestingly, the risk of depression among the household heads decreased as the number of family members increased, particularly in households with children. In recent decades, with strong economic development, Korea has been facing problems related to population aging, decreasing birth rates, and an increasing proportion of unmarried adults [33-35]. This places a heavy burden on the government to provide welfare services. In recent years, increasing welfare for households so that they have more children has been proposed.
We also found that the risk of depression among heads of households with elderly members was significantly higher than among the rest of the households, especially for female heads. Elderly people living with their families can increase the burden on household heads, resulting in increased stress and depression. This study also shows that the government must implement separate policies to support female-headed households with elderly members.
Our study has several limitations. First, it used secondary data from a nationwide survey in Korea that was administered through face-to-face interviews; therefore, some participants may have provided incomplete answers due to bias or fear of making their private status public. This limits the generalizability of our findings. Second, because this was a cross-sectional study, it was not possible to infer the trend of depression and causal effects between the factors of depression among household heads. Third, factors related to daily habits, social activities, and religion were excluded. Instead, this study focused on the relationships between demographic factors, health status, household parameters, and depression of the household head. Fourth, this study focused on the cohort of working-age household heads to minimize possible estimation bias because some factors related to depression in the elderly may be different from those in the working age group, such as social benefits, leisure activities, and public health. Wider studies should be conducted in the future.
In conclusion, this study provides a comprehensive look at the prevalence of depression among working-age household heads and identifies the factors that are strongly associated with depression. The rate of depression was significantly higher in females than in males. The rate decreased with the education level of the household head, number of family members, and presence of children but increased in heads of households with low incomes, where disabled or elderly members were present, where the household head was unemployed, or with spouses bereaved, divorced, or separated. These findings have important implications for policymakers in reducing the burden on household heads and contributing to improving households’ quality of life.
Notes
CONFLICT OF INTEREST
No potential conflict of interest relevant to this article was reported.
Acknowledgements
The authors express their gratitude to the professionals who contributed to improving the quality of this study.