Relationship between Serum Total Testosterone Concentration and Metabolic Syndrome in Premenopausal Obese Women
Article information

Abstract
Background
Men with low testosterone levels are at an increased risk of developing metabolic syndrome, irrespective of age or obesity. However, the relationship between metabolic syndrome and testosterone levels in women remains unclear. We compared the total testosterone concentrations between premenopausal obese women with and without metabolic syndrome and identified the factors affecting these concentrations.
Methods
A single-center retrospective analysis was conducted using the medical records of 580 premenopausal women with obesity. The diagnostic criteria for metabolic syndrome were established using the National Cholesterol Education Program Adult Treatment Panel III guidelines.
Results
The mean±standard deviation age, weight, and body mass index were 38.8±8.4 years, 78.0±11.8 kg, and 30.0±4.1 kg/m2, respectively. The mean total testosterone concentration was lower in the metabolic syndrome group than in the non-metabolic syndrome group (n=385 vs. n=195; 0.22±0.10 ng/mL vs. 0.24±0.11 ng/mL; P<0.001). In a model adjusted for age, body mass index, skeletal muscle mass, body fat mass, and body fat percentage, the odds ratio for metabolic syndrome with respect to the total testosterone level was 0.128 (P=0.028). Testosterone concentration was negatively correlated with age (r=-0.334), systolic blood pressure (r=-0.084), and triglyceride concentration (r=-0.093) but positively correlated with weight (r=0.144), body mass index (r=0.140), waist circumference (r=0.133), body fat mass (r=0.167), and body fat percentage (r=0.167). Stepwise regression analysis revealed that age (β=-0.004, P<0.001), body mass index (β=0.003, P=0.004), and high-density lipoprotein cholesterol concentration (β=0.001, P=0.019) were independently associated with total testosterone concentration (adjusted R2=12.6%).
Conclusion
Metabolic syndrome and obesity may be independently associated with testosterone levels in premenopausal women with obesity.
INTRODUCTION
Obesity is defined as the abnormal or excessive accumulation of fat and is considered a significant threat to public health worldwide [1]. Obese individuals are at an increased risk of various diseases, such as type 2 diabetes, cardiovascular diseases, and cancers, compared with non-obese individuals [2,3].
According to a report by the Korea Disease Control and Prevention Agency in 2021, the overall obesity prevalence among adults in South Korea is 37.1%, with that among adult men and women at 46.3% and 26.9%, respectively. Compared to the obesity prevalence in 2009, which was 35.8% among adult men and 26.0% among adult women, the prevalence has increased among adult men and remained relatively stable among adult women [4].
Testosterone is a key sex hormone present in men and women. In males, this stimulates the development of secondary sexual characteristics during puberty. In adulthood, testosterone plays an essential role in male reproductive function and the maintenance of muscle mass [5]. In men, an increasing degree of obesity is associated with a decrease in total and free testosterone concentrations, and a bidirectional interaction between obesity and testosterone concentrations has been reported [6,7]. Low testosterone concentrations in men are associated with obesity, abdominal obesity, and visceral fat accumulation and reportedly increase the risk of metabolic syndrome independent of age or obesity [8-10]. Additionally, low testosterone levels in men are associated with insulin resistance, type 2 diabetes, dyslipidemia, hypertension, and cardiovascular diseases [7].
Obese men exhibit progressively declining testosterone levels as their weight increases, whereas obese women (especially those with an abdominal phenotype) tend to develop functional hyperandrogenism [11]. Therefore, the effects of testosterone on obesity and the metabolic syndrome are likely to differ between men and women. However, studies on the relationship between metabolic syndrome and serum testosterone concentrations in women have yielded inconsistent results; research on the association between testosterone levels and obesity-related metabolic markers in premenopausal women is lacking [12-14]. During menopause, a reduction in oocytes and ovarian follicles is accompanied by a decrease in ovarian androgen production, which subsequently leads to a decline in total testosterone concentration [12]. Therefore, it was inappropriate to analyze premenopausal and postmenopausal women.
This study aimed to compare total testosterone concentrations according to the presence of metabolic syndrome in premenopausal obese women and investigate the factors affecting total testosterone concentrations in this population.
METHODS
1. Study Population
A total of 1,170 obese women were included in this cross-sectional study, excluding 806 patients for whom clinical outcomes, such as blood test results and medical history, were missing from a sample of 1,976 first-time visitors to the outpatient department of Konyang University Hospital’s department of family medicine for weight loss from May 1, 2020, to April 30, 2022. We used medical records, physical examination results, body composition analyses, and results of blood tests conducted on the day of the initial visit.
2. Study Design
Patient histories, including medical conditions, medication use, and smoking status, were obtained from outpatient medical records. Menopausal status was defined based on the absence of menstrual periods for at least 1 year in patients who had not undergone a hysterectomy. In patients who underwent hysterectomy, a follicle-stimulating hormone concentration >40 IU/mL was considered indicative of menopause [15]. We excluded the following: menopausal women (n=435), women under 20 years of age, women with a body mass index (BMI) <25 kg/m2, current smokers, and patients with arrhythmia, myocardial infarction, cerebral hemorrhage, stroke, cancer, adenomyosis, endometrial hyperplasia, polycystic ovary syndrome (PCOS), symptoms associated with PCOS (amenorrhea, irregular menstruation, hirsutism, and so forth), psychiatric disorders, asthma, skin diseases, aspirin usage, steroid usage, hormone therapy, chronic kidney disease with an estimated glomerular filtration rate <60 mL/min/1.73m2, abnormal liver function test (alanine aminotransferase [ALT] concentration >70 IU/L, more than 2 times the upper limit of the normal range), abnormal prolactin concentration (prolactin >200 ng/mL), abnormal thyroid function test (thyroid-stimulating hormone concentration <0.38 µIU/mL or >5.33 µIU/mL) or an abnormal thyroxine concentration (<0.58 ng/dL or >4.64 ng/dL), or a total testosterone concentration above the upper limit of the normal range (>0.481 ng/mL). An additional 155 patients who met the exclusion criteria were excluded, resulting in a final sample size of 580 patients.
3. Definition of Metabolic Syndrome
Metabolic syndrome was defined according to the criteria provided by the National Cholesterol Education Program Adult Treatment Panel III. It was defined as the presence of three or more of the following: a waist circumference ≥85 cm [16], triglyceride concentration ≥150 mg/dL or undergoing medication treatment for hypertriglyceridemia, high-density lipoprotein cholesterol (HDL-C) concentration <50 mg/dL or taking medication for low HDL-C, blood pressure ≥130/85 mm Hg or taking medication for hypertension, and fasting glucose concentration ≥100 mg/dL or taking medication for diabetes.
4. Body Measurements
Blood pressure was measured using an automatic electronic sphygmomanometer (BPBIO 750; Biospace, Seoul, Korea). The patients were instructed to sit quietly for at least 5 minutes before the measurement, and the measurement was taken after removing any clothing covering the arm. Height and weight were measured using an automated body composition analyzer (Biospace), and BMI was calculated based on these measurements (weight/height2, kg/m2). Waist circumference was measured using a tape measure, while the participants stood upright with their feet approximately 25–30 cm apart and evenly distributing their weight. The measurement was taken at the midpoint between the lowest rib and the tubercle of the iliac crest, with the participants exhaling lightly. Body composition analysis, including skeletal muscle mass, body fat mass, and body fat percentage, was conducted using bioelectrical impedance analysis (BIA) with an InBody 720 analyzer (Biospace).
5. Laboratory Tests
After an 8-hour fasting period, venous blood samples were collected from each participant. Fasting blood glucose, total cholesterol, triglyceride, HDL-C, low-density lipoprotein cholesterol (LDL-C), aspartate aminotransferase (AST), ALT, gamma-glutamyl transferase (γ-GT), and C-reactive protein (CRP) concentrations were measured using the AU5800 analyzer (Beckman Coulter, Brea, CA, USA). The specific assay methods were as follows: fasting blood glucose (hexokinase method), total cholesterol (CHOD-POD method), triglycerides (enzymatic method without free glycerol elimination), HDL-C and LDL-C (enzymatic method with detergent), AST (malate dehydrogenase method without pyridoxal 5’-phosphate), ALT (lactate dehydrogenase method without pyridoxal 5’-phosphate), γ-GT (gamma-glutamyl-3-carboxy4-nitroanilide method), and CRP (immunoturbidimetric test). The total testosterone concentration was measured using an E411 analyzer (Roche Holding, Basel, Switzerland) and an electrochemiluminescence immunoassay.
6. Statistical Analysis
Statistical analyses were performed using the IBM SPSS ver. 28.0 (IBM Corp., Armonk, NY, USA), and a two-tailed significance level of P<0.05 was used to determine statistical significance. Premenopausal women were divided into groups based on the presence or absence of metabolic syndrome, and a t-test was used to compare mean testosterone concentrations between the two groups. Multiple logistic regression analysis was conducted to assess the association between total testosterone levels and metabolic syndrome. Pearson’s correlation analysis was conducted to examine the association between total testosterone concentration and other continuous variables. Multiple stepwise linear regression analysis was performed to identify factors independently influencing total testosterone concentration.
7. Institutional Review Board Approval
This study was approved by the institutional review board (IRB) of Konyang University Hospital (IRB file no., 2023-03-021) and was conducted as a retrospective study using medical records, which exempted the need to obtain informed consent from patients, according to our IRB guidelines.
RESULTS
1. General Characteristics of Study Participants
The mean±standard deviation age of the 580 participants was 38.8±8.4 years. Their average weight was 78.0±11.8 kg, with a mean BMI of 30.0±4.1 kg/m2. The mean waist circumference was 98.5±9.8 cm. Measurements obtained through BIA revealed a mean skeletal muscle mass of 25.0±3.1 kg, body fat mass of 32.4±3.1 kg, and body fat percentage of 41.1%±5.0%. The mean systolic and diastolic blood pressure values were 131.1±15.7 mm Hg and 81.3±13.3 mm Hg, respectively. The median fasting blood glucose concentration was 103.0 mg/dL (interquartile range [IQR], 97.0–113.0 mg/dL), the mean total cholesterol concentration was 198.1±36.1 mg/dL, the median triglyceride concentration was 129.2 mg/dL (IQR, 90.2–188.7 mg/dL), the mean HDL-C concentration was 56.5±11.8 mg/dL, and the mean LDL-C concentration was 119.1±26.4 mg/dL. Among the liver function tests, the median ALT concentration was 19.0 IU/L (IQR, 14.0–28.0 IU/L), and the median CRP concentration was 0.14 mg/dL (IQR, 0.07–0.29 mg/dL). The mean total testosterone concentration was 0.23±0.11 ng/mL (Table 1).

General characteristics of the participants (n=580)
2. Comparison of General Characteristics according to the Presence of Metabolic Syndrome
The 580 premenopausal obese women were divided into a metabolic syndrome group (n=385) and a non-metabolic syndrome group (n=195). The metabolic syndrome group had significantly higher age, weight, BMI, waist circumference, skeletal muscle mass, body fat mass, body fat percentage, and blood pressure than the non-metabolic syndrome group (Table 2). In terms of blood test results, the HDL-C concentration was significantly lower in the metabolic syndrome group, whereas all other parameters were significantly higher in the metabolic syndrome group than in the non-metabolic syndrome group (Table 2). The mean total testosterone concentration was 0.22±0.10 ng/mL in the metabolic syndrome group and 0.24±0.11 ng/mL in the non-metabolic syndrome group (P<0.001) (Table 2, Figure 1).
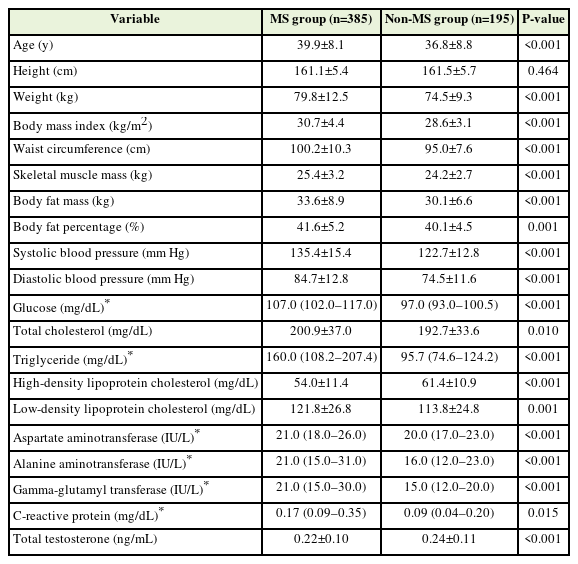
Comparison of variables between patients with MS and those without MS
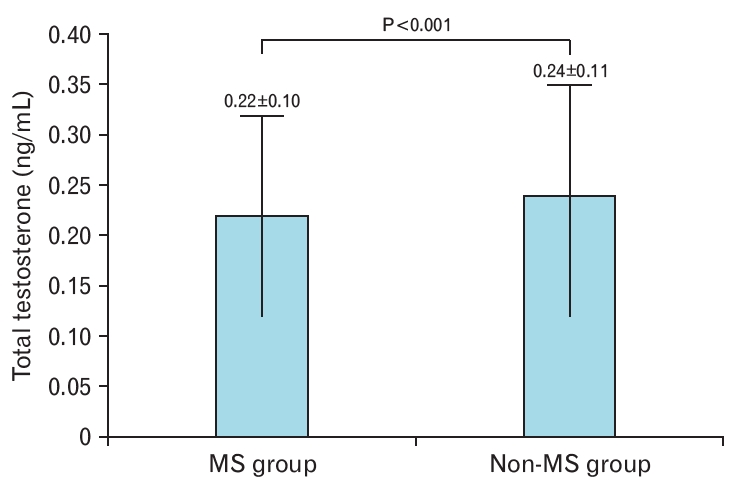
Total testosterone concentration in women with and without metabolic syndrome (MS). Total testosterone concentration is presented as mean±standard deviation. The P-value was obtained using a t-test to compare the two groups.
3. Multiple Logistic Regression Analysis Results about Metabolic Syndrome
Multiple logistic regression analysis was conducted to assess the effect of total testosterone concentration on metabolic syndrome. When setting variables for logistic regression analysis, waist circumference and laboratory test results were not included, considering the components of metabolic syndrome. Weight was excluded because of multicollinearity with BMI. The non-metabolic syndrome group was set as the reference group, with an odds ratio of 0.0. The regression model was adjusted for age and body measurements, including BMI, skeletal muscle mass, body fat mass, and body fat percentage. The odds ratio for metabolic syndrome with respect to total testosterone level was 0.128 (P=0.028) (Table 3).
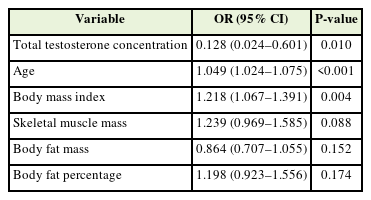
Results from multiple logistic regression analysis on metabolic syndrome
4. Correlations between Total Testosterone Concentration and Other Variables, Including Components of Metabolic Syndrome
Age (r=-0.334, P<0.001) showed statistically significant negative correlations with total testosterone concentration. Systolic blood pressure (r=-0.084, P=0.042) and triglyceride concentration (r=-0.093, P=0.026), both components of metabolic syndrome, exhibited statistically significant negative correlations with total testosterone concentration. Weight (r=0.144, P=0.001), BMI (r=0.140, P=0.001), waist circumference (r=0.133, P=0.001), body fat mass (r=0.167, P<0.001), and body fat percentage (r=0.167, P<0.001) were significantly positively correlated with total testosterone concentration. Among the components of metabolic syndrome, diastolic blood pressure (r=-0.035, P=0.395), glucose (r=-0.053, P=0.201), and HDL-C level (r=0.059, P=0.156) were not significantly correlated with total testosterone concentration (Table 4).

Correlation between total testosterone concentration and other variables including components of metabolic syndrome
5. Multivariable Analysis between Variables, Including Components of Metabolic Syndrome and Total Testosterone Concentration
Stepwise multivariable linear regression analysis was performed with total testosterone concentration, including components of metabolic syndrome, as the dependent variable, and variables other than total testosterone concentration as the independent variables. To account for multicollinearity, variables such as weight, body fat percentage, diastolic blood pressure, and concentrations of total cholesterol, AST, and γ-GT were excluded. The final model included age, BMI, waist circumference, skeletal muscle mass, body fat mass, systolic blood pressure, and concentrations of fasting blood glucose, triglycerides, HDL-C, LDL-C, ALT, and CRP as independent variables. Among the components of the metabolic syndrome, excluding HDL-C, the remaining variables were not significant independent variables. Age (β=-0.004, standard error [SE]=0.000, P<0.001), BMI (β=0.003, SE=0.001, P=0.004), and HDL-C (β=0.001, SE=0.000, P=0.019) significantly and independently influenced the total testosterone concentration. The model’s adjusted R2 was 12.6% (Table 5).

Multivariable analysis between variables including components of metabolic syndrome and total testosterone concentration
DISCUSSION
In this study, the total testosterone level was significantly lower in premenopausal obese women with metabolic syndrome than in those without metabolic syndrome (Table 2, Figure 1). Our findings confirmed that even after adjusting for age and body measurements, the odds ratio for metabolic syndrome decreased significantly as testosterone levels increased (Table 3). Among the components of metabolic syndrome, total testosterone concentration was significantly negatively correlated with systolic blood pressure and triglyceride concentration and significantly positively correlated with waist circumference (Table 4).
The relationship between total testosterone concentration and metabolic syndrome in premenopausal women with obesity in this study aligns with previous findings in men [7]. Low serum testosterone levels in men contribute to obesity, visceral fat accumulation, insulin resistance, and metabolic syndrome development [8-10]. Lower testosterone concentrations promote triglyceride storage within visceral adipose tissues by activating lipoprotein lipase and induce fatty acyl-CoA synthetase overexpression, leading to intracellular accumulation of fatty acids and mitochondrial function impairment in muscle cells, which increases insulin resistance in adipose, liver, and muscle tissues [6,17].
The relationship between total serum testosterone concentration and metabolic syndrome in women varies across studies. In a cross-sectional study, Liang et al. [12] divided Chinese adult women into two groups based on their menopausal status and compared the odds ratios of metabolic syndrome among the quartiles of total testosterone concentration (Q1: <12.99 ng/mL, Q2: 12.99–19.38 ng/mL, Q3: 19.39–28.38 ng/mL, and Q4: >28.40 ng/mL). Compared with women in Q1, premenopausal women in Q3 and Q4 and postmenopausal women in Q2 and Q4 had significantly lower risks of metabolic syndrome, which is consistent with the findings of our study. Conversely, in a cross-sectional study on adult Saudi women, Fatani et al. [13] compared total testosterone concentrations between 95 women with a BMI of ≥30 kg/m2 (metabolic syndrome group; with a waist circumference: ≥88 cm) and 47 women with a BMI of <25 kg/m2 (control group). Total testosterone concentration was significantly higher in the metabolic syndrome group than in the control group (2.13 ng/mL versus 1.06 ng/mL, P<0.0001). Such discrepant findings on the relationship between metabolic syndrome and testosterone levels in women may be attributed to differences in age, menopausal status, prevalence of PCOS, and obesity among the study samples.
Using stepwise multiple linear regression analysis, we identified age, BMI, and HDL-C concentration as factors significantly and independently associated with total testosterone concentration. This finding is consistent with that of a cross-sectional study by Hong et al. [18], wherein the associations among testosterone concentration, obesity, and metabolic syndrome were analyzed in Korean women aged 44–64 years, with an average BMI of approximately 23 kg/m2. They observed that total testosterone concentration decreased with increasing age, regardless of menopausal status. Testosterone in women is derived from the ovaries (25%), adrenal glands (25%), and peripheral conversion of androstenedione (50%); its concentration decreases with age owing to diminished ovarian and adrenal function [19,20].
In another cross-sectional study, Mäkinen et al. [21] investigated the association between testosterone concentration and lipid profiles in men aged 40–69 years with andropathic symptoms. They discovered a positive correlation between testosterone and HDL-C concentrations, which is consistent with our findings (r=0.24, P<0.0001).
Unlike men (in whom obesity indicators and testosterone concentrations exhibit a consistent inverse relationship across all ages) [22], we observed a positive correlation between obesity indicators (weight, BMI, body fat, and waist circumference) and testosterone concentrations in premenopausal obese women, with testosterone levels below the upper limit of the normal range. This suggests that the association between obesity indicators and total testosterone concentration may differ depending on sex.
In women, excessive visceral fat leads to insulin resistance and hyperinsulinemia [23]. High insulin concentrations stimulate testosterone synthesis in the ovaries and suppress sex hormone-binding globulin (SHBG) synthesis, which increases the concentration of free testosterone in the bloodstream [23,24]. However, in men, excessive visceral fat suppresses gonadotropin secretion, leading to a decrease in serum testosterone concentration [23]. Long-term androgen therapy in obese men promotes lipolysis, reducing intra-abdominal fat and increasing muscle mass [24].
Women with PCOS, which is characterized by hyperandrogenism, may experience carbohydrate cravings, a strong appetite, and a high degree of visceral fat deposition [25,26]. In these women, a high androgen concentration, even in the absence of obesity, can result in high insulin concentration, which, in turn, upregulates adrenal androgen production through increased steroidogenesis [27,28]. In our study of premenopausal women without signs or symptoms of PCOS and with a normal total testosterone level, serum testosterone level was positively correlated with obesity.
In a cross-sectional study by Kirchner et al. [29] on 29 premenopausal obese women (aged 20–40 years) with a weight of ≥80 kg and a BMI ≥30 kg/m2, the daily testosterone production rates were significantly higher in those with upper-body obesity than in those with lower-body obesity. This finding is consistent with that of our study, wherein a positive correlation was noted between total testosterone concentration and waist circumference.
This study had several limitations. First, it was conducted on a sample of 580 premenopausal obese women who visited a single institution, which may have introduced a selection bias. Further studies with larger sample sizes are necessary to verify these findings. Second, owing to the cross-sectional nature of the study, we could not establish a causal relationship between total testosterone levels and metabolic syndrome components or obesity indices in premenopausal obese women. Longitudinal studies are required to address this issue. Third, to exclude women with endogenous hyperandrogenism (such as those with PCOS), we excluded those with total testosterone concentrations above the upper limit of the normal range, which may have influenced our results. Fourth, SHBG levels were not measured in this study. It is associated with testosterone bioavailability and is an insulin-dependent protein that decreases with increased insulin concentrations [7]. Low SHBG concentrations have been linked to metabolic syndrome and type 2 diabetes [14,30]. This factor may have confounded our results and should be analyzed in the future.
Previous studies in men have revealed that lower testosterone concentrations increase the risk of metabolic syndrome [17]. Nevertheless, the association between testosterone levels and metabolic syndrome in women has been inconsistent across studies [12-14]. This discrepancy may be attributed to the fact that, unlike in men, waist circumference (a metabolic syndrome component) in obese women may be positively correlated with testosterone concentrations [29]. Additionally, differences in participant characteristics—age, degree of obesity, menopausal status, and presence of PCOS (which can potentially affect serum testosterone concentrations in women)—may contribute to the inconsistent findings across studies. In this study, we specifically focused on premenopausal obese women without a history of PCOS and its symptoms and with normal testosterone concentrations to minimize the influence of these confounding variables. Unlike previous studies, this study targeted premenopausal women before they exhibited a decrease in total testosterone levels. This approach has a clinical significance for the study findings.
In conclusion, serum total testosterone concentration was significantly lower in premenopausal obese women with metabolic syndrome (even with testosterone levels in the normal range) than in those without metabolic syndrome. Among the metabolic syndrome components, systolic blood pressure and triglyceride concentration were significantly negatively correlated with testosterone level, whereas waist circumference was significantly positively correlated with testosterone level. Regression analysis revealed that higher total testosterone concentration was independently associated with lower age, higher BMI, and higher HDL-C concentration. These findings suggest that in premenopausal obese women, metabolic syndrome and obesity may be independently associated with testosterone levels. However, the generalizability of these findings is limited, and further studies involving larger samples of premenopausal women with obesity are required for confirmation.
Notes
CONFLICT OF INTEREST
No potential conflict of interest relevant to this article was reported.