Relationship between Food-frequency and Glycated Hemoglobin in Korean Diabetics: Using Data from the 4th Korea National Health and Nutrition Examination Survey
Article information
Abstract
Background
This study was performed to evaluate the association between food intake frequencies and long-term blood glucose control using glycated hemoglobin (HbA1c) in Korean diabetes.
Methods
This study used data collected from the 4th Korea National Health and Nutrition Examination Survey. Patients with diabetes were defined as people who responded "yes" to the question "Are you currently suffering from diabetes?" or in whom serum fasting glucose was 126 mg/dL or more. Using the food frequency questionnaire and HbA1c in surveys, we examined the association between the annual food-frequencies of each food group and long-term blood glucose control.
Results
After adjustment for other covariates, HbA1c decreased significantly as the frequency of the intake of fish increased in each population (P = 0.001 for all, P = 0.043 for men, P = 0.001 for women). The intake of mackerel played an especially important role in the control of diabetes. Among women, HbA1c decreased as the frequency of intake of legumes increased (P = 0.029) and increased as the frequency of intake of staple carbohydrates increased (P = 0.015). On the other hand, any intake of other food groups showed no significant relationship with HbA1c.
Conclusion
Frequent intake of fish in all populations and legumes in woman were associated with good glycemic control in diabetics. Frequent intake of carbohydrates was associated with elevated HbA1c in women.
INTRODUCTION
Diabetes is a chronic illness that requires comprehensive treatment to prevent associated complications. Such treatment includes medical care from a physician-coordinated team, self-management education, and problem-solving skills in the various aspects of diabetes management. Above all, the complications (micorvascular1) or macrovascular2)) associated with diabetes are closely linked to the extent of long-term blood glucose control, so a primary goal in the management of diabetes is the regulation of blood glucose to achieve near-normal blood glucose.
Recently, type 2 diabetes mellitus has increased in prevalence throughout the world. In Korea, lifestyles are becoming increasingly westernized, and physical inactivity is widely prevalent, making type 2 diabetes an important public health issue today. The prevalence of diabetes in Korea has increased from 6- to 7-fold from 1.5% to 10% during the past 40 years.3,4) Diabetes-related mortality increased dramatically from 5.2 to 23.1 (a 4.4-fold increase) for men, and 3.8 to 22.8 for women (a 6.0-fold increase) between 1983 and 2007.5)
An integral component of diabetes self-management education is medical nutrition therapy (MNT). MNT is important in managing diabetes to prevent or slow the rate of development of diabetes complications, and optimize energy intake and macronutrient composition. Although controversial, there are several recommendations by the American Diabetes Association regarding MNT: 1) Carbohydrate intake from fruits, vegetables, whole grains, legumes, and low-fat milk is encouraged. 2) Monitoring carbohydrate intake, whether by carbohydrate counting, exchanges, or experienced-based estimation, is recommended, and the use of glycemic index and load may provide a modest additional benefit. 3) Consumption of a variety of fiber-containing foods is recommended. 4) Limitation of saturated fat to 7% of total calories. 5) Two or more servings of fish per week is recommended.6)
The relation of specific foods and nutrients such as vegetables,7) dietary fiber,8) and glycemic load9) to risk of type 2 diabetes has been examined in many studies, but few have addressed the association with long-term blood glucose control in diabetes. Although long-term glycemic control through caloric restriction is most important in diabetes patients, it is also important to maintain individual pleasure of eating. However, there has been little research on the optimal dietary macronutrient composition and the extent of glycemic control in relation to each food group for patients with type 2 diabetes. Thus, many physicians are reluctant to choose foods and decide the intake frequency of each food for their patients.
Glycated hemoglobin (HbA1c) is a biomarker of longterm glucose control that reflects blood glucose concentrations over the previous 6 to 8 weeks.10) As shown previously, a single measurement of HbA1c is reliable to classify diabetes and predict the vascular complications according to long-term blood glucose concentration.11)
In this study, we examined the food-frequencies of each food group and evaluated the relationship between the intake frequencies of certain food groups and long-term blood glucose control in Korean diabetes patients using data collected from the 4th Korea National Health and Nutrition Examination Survey.
METHODS
1. Study Population
The study population was derived from the data of the 4th Korea National Health and Nutrition Examination Survey during 2007 to 2009. These surveys gathered data about the health and nutritional status of 24,871 subjects in various regions of Korea. In the surveys, there were 1,561 diabetics who responded "yes" to the question "Are you currently suffering from diabetes?" or in whom serum fasting glucose was more than 126 mg/dL. We excluded the 190 subjects who did not respond to the food frequency questionnaire (FFQ). Thus 1,371 subjects were included in this study. This study was approved by the ethics committee of a university hospital in Seoul.
2. Food Group and Food Frequency
In the FFQ of these surveys, there were 11 food groups consisting of 63 food items. Using this questionnaire, we reclassified the foods into 11 new food groups consisting of 58 food items. The new 11 food groups in this study were staple carbohydrates (rice and grains other than rice), other carbohydrates (ramen, noodles, breads, rice cakes, and confectionery), legumes (bean curd, legumes, and soybean milk), potatoes (potato and sweat potato), meat and eggs (beef, chicken, pork, ham/bacon/sausage, and egg), fish (mackerel, tuna, croaker, and Pollack), vegetables (Chinese cabbage, radish, radish leaves, bean sprouts, spinach, cucumber, red pepper, carrot, pumpkin, cabbage, tomato, and mushrooms), seaweeds (sea mustard and laver), fruits (tangerine, persimmon/dried persimmon, pear, watermelon, oriental melon, strawberry, grape, peach, apple, banana, and orange), milk and dairy products (milk, yogurt, and ice cream), and instant foods (hamburger, pizza, and fried foods).
The study participants checked the most appropriate answers to the 10 multiple-choice questions about the food frequency of each food item. The 10 multiple-choice answers were "1, 2, 3 times per day or 1, 2-3, 4-6 times per week or 1, 2-3 times per month or 6-11 times per year or never." Using the questions, we calculated the annual food-frequency and the result was "0, 9, 12, 30, 52, 130, 260, 365, 730, and 1,095 times per year." The foodfrequency of each food group in this study was the sum of the annual food-frequencies of all foods included in the group.
3. Assessment of Nondietary Covariates (Data Collection)
The nondietary covariates collected from the data were sociodemographic characteristics (e.g., age, education, household income), anthropometric measurements (height, weight, abdominal circumference), serum fasting glucose, HbA1c, total cholesterol, high density lipoprotein (HDL) cholesterol, triglyceride (TG), smoking, alcohol consumption, physical activity, duration of diabetes, and current medication status.
From the data, we calculated the body mass index ([BMI], calculated as kg/m2), the daily average amount of current smoking, the annual average amount of alcohol consumption, and the International Physical Activity Questionnaire score12) for physical activity.
4. Statistical Analysis
All analyses were performed by reflecting weighted values at the stratification of the samples applied to the Korea National Health and Nutrition Examination Survey. The characteristics of the study subjects were compared using the Student t-test. Household income and education were compared by the linear by linear test while the current medication status was compared by the Pearson χ2 test. Multiple linear regression analyses were used to evaluate the relationship between food frequency and HbA1c, while controlling for other covariates, including age, BMI, physical activity, smoking, and alcohol consumption. Statistical analyses were performed by using SPSS ver. 18.0 (SPSS Inc., Chicago, IL, USA).
RESULTS
General characteristics of the subjects are shown in Table 1. With statistical significance, the age, BMI, fasting glucose, HbA1c, total cholesterol, HDL cholesterol, duration of diabetes, and therapy of diabetes by insulin and oral medication were higher in women, while the abdominal circumference, TG, smoking, physical activity, alcohol consumption, household income, education, and behavioral therapy frequency were higher in men.
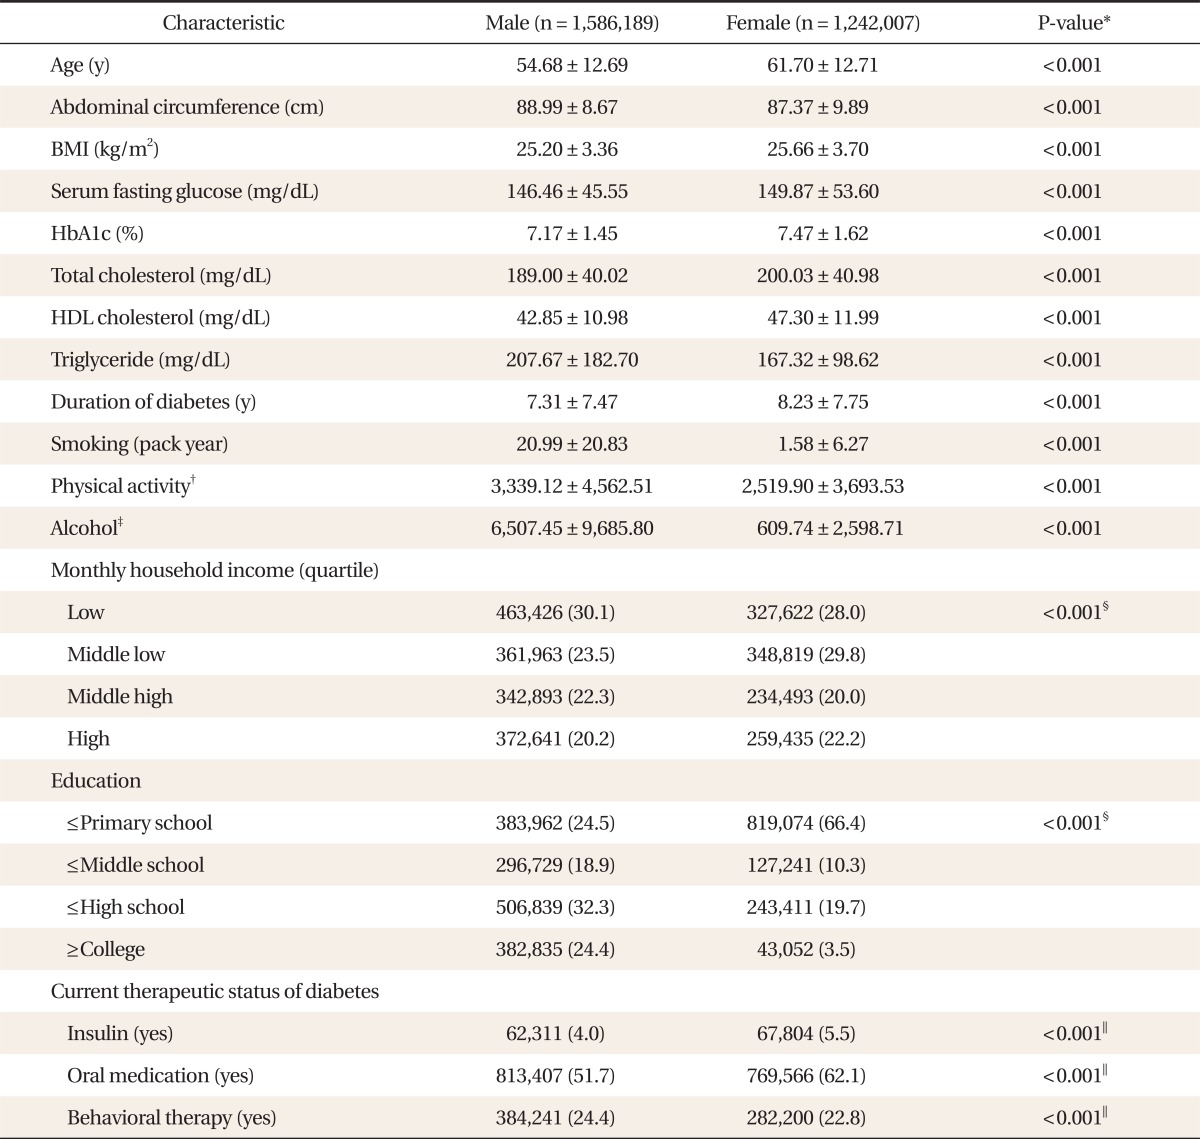
General characteristics of subjects.
The food-frequencies of each food group are shown in Table 2. There is a statistically significant male predominance in the food-frequencies of other carbohydrates, meat and eggs, fish, vegetables, seaweeds, milk and dairy products, and instant foods.
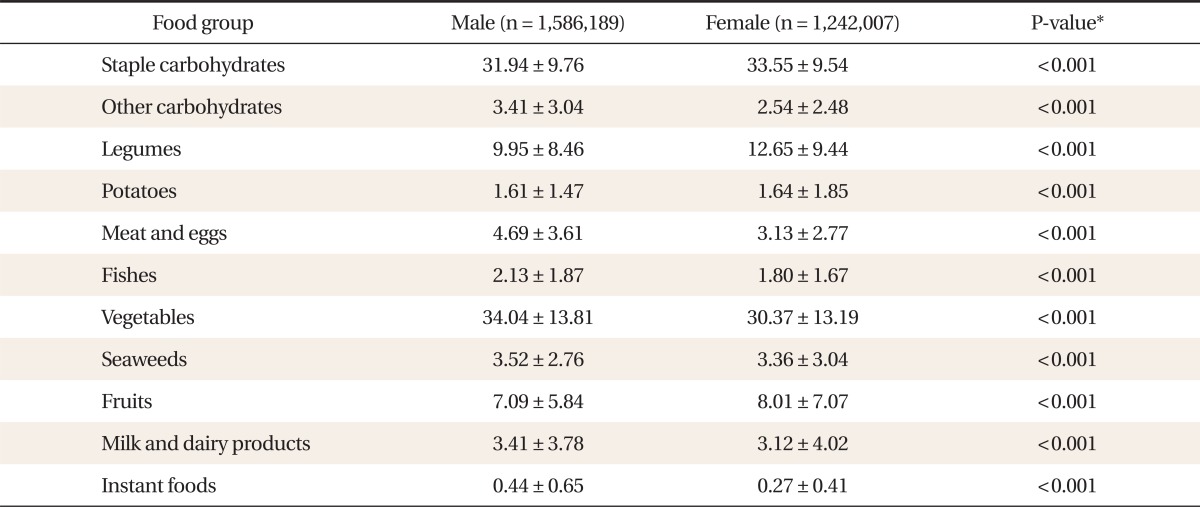
Weekly food frequency (times/wk) of each food group.
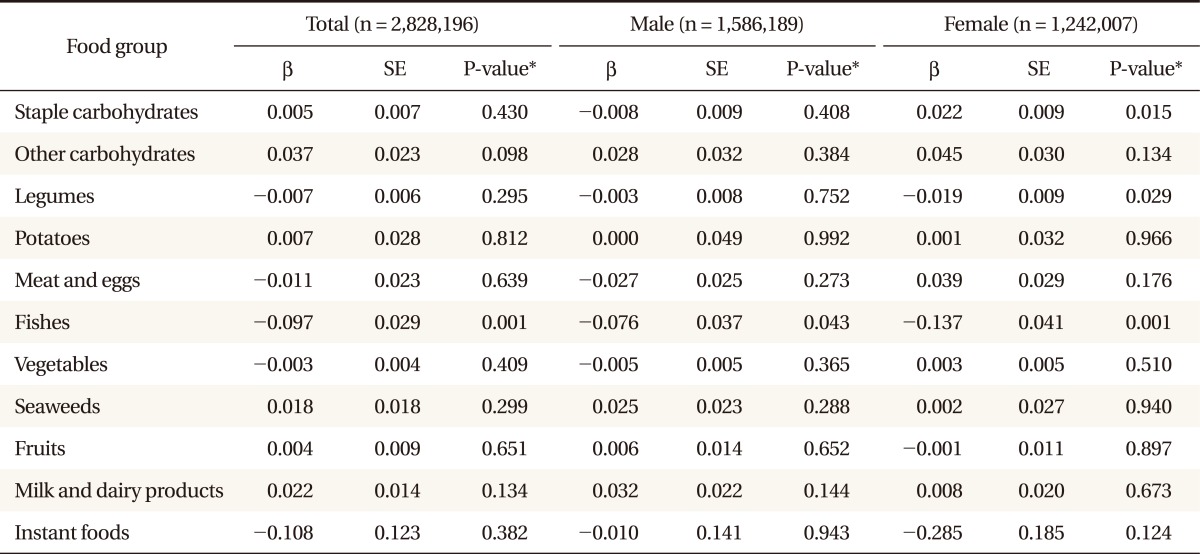
Table 3 shows the relationship between the food frequency and HbA1c. After adjustment for other covariates, HbA1c decreased significantly as the frequency of the intake of fish increased all populations (P = 0.001 for all, P = 0.043 for men, P = 0.001 for women). Among women, HbA1c decreased as the frequency of intake of legumes increased (P = 0.029) and increased as the frequency of intake of staple carbohydrates increased (P = 0.015). On the other hand, any intake of other food groups showed no significant relationship with HbA1c.
Association between glycated hemoglobin and food-frequency (times/wk).
Fish consumption consistently abated HbA1c, so we evaluated the relationship between each fish type included in the group and HbA1c. The results are shown in Table 4. With statistical significance, the mackerel decreased HbA1c in total and in women (P = 0.022 for total, P = 0.006 for women).
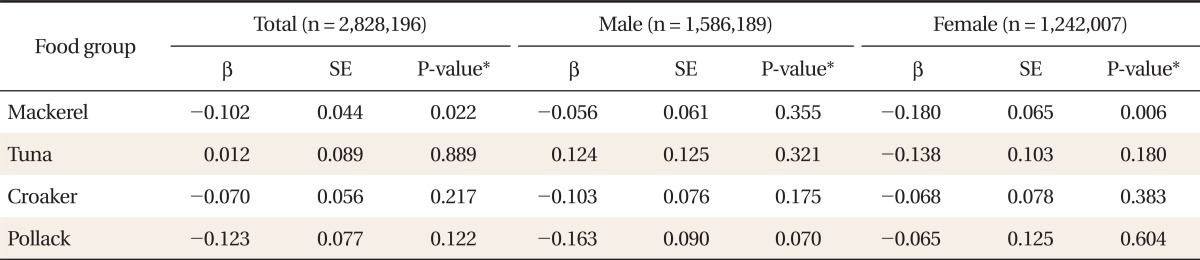
Association between glycated hemoglobin and food-frequency (times/wk) of fishes.
DISCUSSION
Notably, fish consumption affected HbA1c inversely in both men and women. From previous studies, the consumption of fish and related nutrients (especially long-chain omega-3 fatty acids) seems to have various metabolic effects on patients with diabetes, and the risks and benefits remain controversial. Intake of fish and related nutrients resulted in beneficial effects on glucose tolerance,13) microalbuminuria,14) and cardiovascular disease (CVD),15) while deteriorated glycemic control.16) Furthermore, environmental pollutants found in fish such as dioxins may raise the risk of diabetes in the recent study.17) However, we found that frequent intake of fish improved glycemic control in patients with diabetes. Mackerel played a particularly important role among the types of fish consumed.
Staple carbohydrates had negative effects on HbA1c in women. Korean main dishes include carbohydrate foods such as rice, brown rice, and barley. The result of this study demonstrated this fact, as seen in the staple foods frequency. However, the effect of carbohydrate composition on glycemic control is controversial.18-20) In a recent study from Japan, it was shown that a dietary pattern using rice as a main meal may deteriorate glucose metabolism in Japanese men and women.21) Our result that frequent intake of staple carbohydrates increased HbA1c in women corroborates that finding.
Legumes had a positive effect on HbA1c in women. Legumes are composed of various nutrients, including complex carbohydrates, vegetable protein, dietary fiber, oligosaccharides, and minerals. Legumes consisting of complex carbohydrates and dietary fiber are considered foods with low glycemic index, which are thought to be beneficial to patients with diabetes.22)
Several studies have suggested that the consumption of milk and dairy products may have beneficial effects on body weight,23,24) insulin resistance syndrome,25,26) and cardiovascular disease.27,28) However, there is few data relating dairy intake frequency to blood glucose control of diabetes. Recently, one study found that low-fat dairy products reduced the risk of diabetes.29) However, we could not find the association between intake of milk and dairy products and HbA1c.
There are several limitations in this study. First, the cross-sectional design of this study lacks the power to prove causality, and long-term follow-up studies are needed to establish a causal relationship between food-frequency and HbA1c. Second, we used food-frequency in considering the dietary habits in the population because of the form of the FFQ in the surveys. Thus, this study failed to consider the true amount of food consumed at one time.
In conclusion, frequent intake of fish was associated with glycemic control in patients with diabetes. Especially in women, frequent intake of staple carbohydrates was associated with elevated HbA1c, and frequent intake of legumes was associated with decreased HbA1c.
Notes
No potential conflict of interest relevant to this article was reported.