Dietary Fat Intake and the Risk of Metabolic Syndrome in Korean Adults
Article information
Abstract
Background
The effect of dietary fat intake on the risk of cardiovascular disease remains unclear. We investigated the association between dietary fat and specific types of fat intake and the risk of metabolic syndrome.
Methods
The study population included 1,662 healthy adults who were 50.2 years of age and had no known hypertension, diabetes, hyperlipidemia, or metabolic syndrome at the initial visit. Dietary intake was obtained from a 1-day food record. During 20.7 months of follow-up, we documented 147 cases of metabolic syndrome confirmed by self-report, anthropometric data, and blood test results. The intakes of total fat, vegetable fat, animal fat, saturated fatty acid (SFA), polyunsaturated fatty acid (PUFA), monounsaturated fatty acid (MUFA), and cholesterol level divided by quintile. Multivariate analyses included age, sex, body mass index, smoking status, alcohol intake, physical activity, total calorie, and protein intake.
Results
Vegetable fat intake was inversely associated with metabolic syndrome risk (odds ratio for the highest vs. the lowest quintile, 0.33; 95% confidence interval, 0.14 to 0.76). Total fat, animal fat, SFA, PUFA, MUFA, and cholesterol intakes showed no association with metabolic syndrome. Vegetable fat intake was inversely associated with the risk of hypertriglyceridemia among the components of metabolic syndrome.
Conclusion
These data support an inverse association between vegetable fat and the risk of metabolic syndrome.
INTRODUCTION
It is widely known through various studies that there is discrepancy in the effect of different types of fat on the risk of cardiovascular diseases. In the results of previous prospective studies, unlike animal fat consumption, intake of vegetable fat had a positive association with the reduction in the incidences of cardiovascular diseases and diabetes mellitus.12) Saturated fatty acid (SFA) intake is known to increase the risk of cardiovascular disease unlike unsaturated fatty acid, which has an opposite effect.13) According to these results, increasing the consumption of unsaturated fatty acid and decreasing the SFA intake were recommended. However, recent meta-analyses suggested that there is no meaningful relationship between the intake of these two types of fatty acids and the risk of cardiovascular disease,45) attracting attention to the impact of dietary fat intake on cardiovascular disease and its risk factors.
Metabolic syndrome, which is caused by obesity and insulin resistance, is well known for its predictive capability for the risk of diabetes mellitus and cardiovascular disease.678) According to previous studies on the effect of different types of fatty acids on the main factors of metabolic syndrome, SFA intake aggravated insulin resistance, whereas monounsaturated fatty acid (MUFA) and polyunsaturated fatty acid (PUFA) consumptions had inverse effects.910) The possibility of the intake of PUFA affecting the onset of metabolic syndrome by involving in the functions of adipocytes or various cytokines has also been suggested.1112)
In South Korea, the percentage of fat in total calorie intake is lower than that in Western countries such as the United States. In addition, the effects of fat intake on obesity and cardiovascular risk factors might differ from those in Western countries.1314) According to a cross-sectional study that used data from the Korea National Health and Nutrition Examination Survey, people with metabolic syndrome had larger proportions of carbohydrate intake and lower percentage of fat intake than those who were free from the disease.15) However, the relationship between saturated or unsaturated fat and the risk of metabolic syndrome has not been further analyzed. In addition, this study did not reflect the possibility of change in dietary behavior for lifestyle modification in patients who had chronic diseases such as hypertension or diabetes. This could be considered as a limitation of cross-sectional studies. Prospective studies on the effect of fat intake on the risk of metabolic syndrome and other cardiovascular risk factors are still lacking, even though such studies are needed concerning healthy Korean adults.
The purpose of this study was to investigate the association between dietary fat and specific types of fat intake and the risk of metabolic syndrome in healthy Korean adults without chronic diseases such as hypertension, diabetes, or hyperlipidemia.
METHODS
1. Study Population
This study included Korean adults aged 20 to 80 years who participated in a routine health evaluation, including the one-day food record for the purpose of health checkup in Seoul National University Hospital Healthcare System Gangnam Center. The study period was from January 2007 to October 2014. Only the participants who underwent the examination for two consecutive times with a time gap of at least 6 months were included. The number of participants who visited the hospital two consecutive times within the period was 3,154. Those who were found to have no metabolic syndrome in the first visit were 2,356. Of the 2,356 participants, 694 were on medication due to cancer, hypertension, diabetes, or other cardiovascular diseases, and they were excluded for the possibility of change in dietary behavior. Hence, the number of participants in the final analysis was 1,662. This study was approved by the institutional review board of Seoul National University Hospital in Seoul, Korea (IRB number: 1505-025-670).
2. Study Variables
Blood glucose, triglyceride (TG), and high density lipoprotein cholesterol (HDLC) levels were measured after 12 hours of fasting by using the automated analyzer (Architect c8000; Toshiba Inc., Tokyo, Japan). Height and body weight were assessed after wearing light hospital gowns, and body mass index was calculated based on the ratio of body weight to the square of height (kg/m2). Waist circumference was obtained in the midpoint of the iliac ridge and the lower end of the rib by using the measuring tape. An automated sphygmomanometer was used for blood pressure (BP) after enough resting time. Information on disease history such as hypertension, diabetes, and lifestyle behaviors, including smoking and exercise, was obtained through a self-report. People who exercised more than 3 times a week for 30 minutes were included in the regular-exercise group.
The dietary record obtained in the first visit was a 1-day food report, which was subjected to confirmation by trained dieticians. The obtained dietary intake data were then analyzed by using a program called CAN-Pro 3.0 (computer-aided nutrient analysis program; Korea Nutrition Society, Seoul, Korea), which was based on the Korean nutritional standards to investigate total calorie, total fat, animal and vegetable fat, SFA, MUFA, PUFA, carbohydrate, protein, and alcohol intakes.
3. Diagnosis of Metabolic Syndrome
The diagnostic criteria of Adult Treatment Panel III of the National Cholesterol Education Program Expert Panel on Detection, Evaluation, and Treatment of High Blood Cholesterol in Adult were used.16) Abdominal obesity was diagnosed by using the guideline of the Korean Obesity Society.16) Metabolic syndrome was diagnosed if more than 3 of the following indications were present: (1) systolic BP≥130 mm Hg or diastolic BP ≥85 mm Hg or currently on hypertension medication, (2) TG ≥150 mg/dL, (3) HDLC level <40 mg/dL for men and<50 mg/dL for women, (4) fasting blood glucose (FBG) level ≥100 mg/dL or currently on diabetes medication, and (5) waist circumference ≥90 cm for men and ≥85 cm for women.
4. Statistical Analysis
Baseline characteristics were assessed by dividing into 5 quintiles by total fat intake of the first visit. The mean and standard deviation were calculated for continuous variables, and the percentage was calculated for the categorical variables. Moreover, the basic difference between quintiles was assessed by using the χ2 test and analysis of variance. For the analysis of macronutrients, the total calorie intake was adjusted by using the residual regression method.17)
Fat intake was divided into 5 quintiles after adjusting by total calorie intake. The odds ratio (OR) of the higher intake groups (Q2-Q5) in the reference of the lowest group (Q1) of the onset of metabolic syndrome was analyzed by performing a multivariate logistic regression. Crude OR; model 1 adjusted for age, sex, body mass index, smoking status, alcohol intake, regular exercise, systolic BP, FBG level, TG level, HDLC level, protein intake, and total calorie intake in the first visit; and models 2 and 3 adjusted for specific types of fat were analyzed separately. In addition, the risk of individual components of metabolic syndrome (high FBG, high TG, high BP, and low HDLC levels) was assessed by using the same method. Statistical analysis was performed by using Stata ver. 13.0 (Stata Co., College Station, TX, USA), and results were considered statistically meaningful if P<0.05.
RESULTS
1. Basic Characteristics of the Study Population
In this study, 1,662 subjects were included. The participants included 739 (44.5%) women and 923 men (55.5%). The mean age of the total participants was 50.2 years. The percentage of people who exercised regularly was 66.5%, and the mean intake of alcohol per week was 46.7 g. Basic characteristics were assessed after dividing into quintiles by total fat intake. During 20.7 months of follow-up, we documented 147 cases (8.8%) of metabolic syndrome confirmed by self-report, anthropometric data, and blood test results (Table 1). The characteristics of macronutrient intake, including fat consumption, illustrated that the mean total calorie intake was 2,160.4 kcal and the ratio of carbohydrate, protein, and fat energy was 52.8:19.7:27.5 (Table 2).
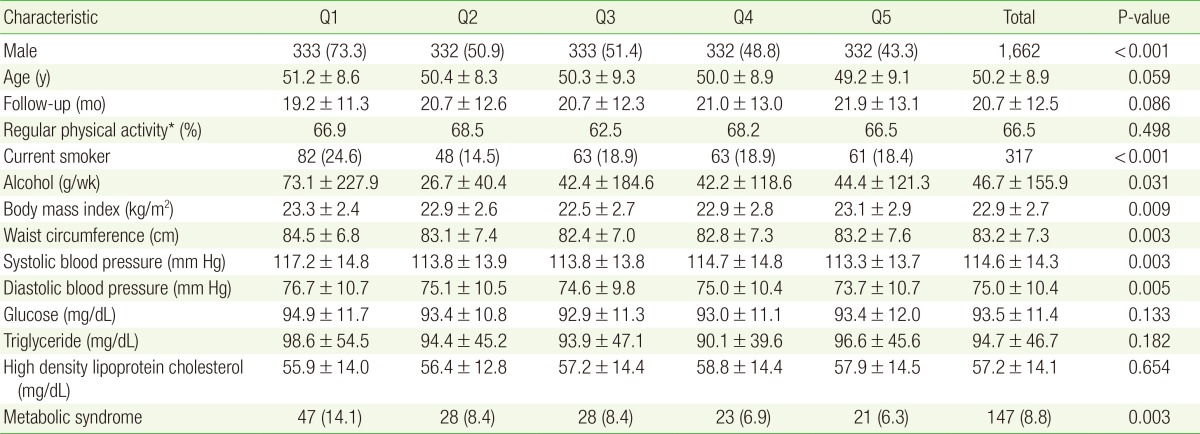
Baseline characteristics of the study participants according to quintiles of energy-adjusted dietary fat intake (g/d) (n=1,662)
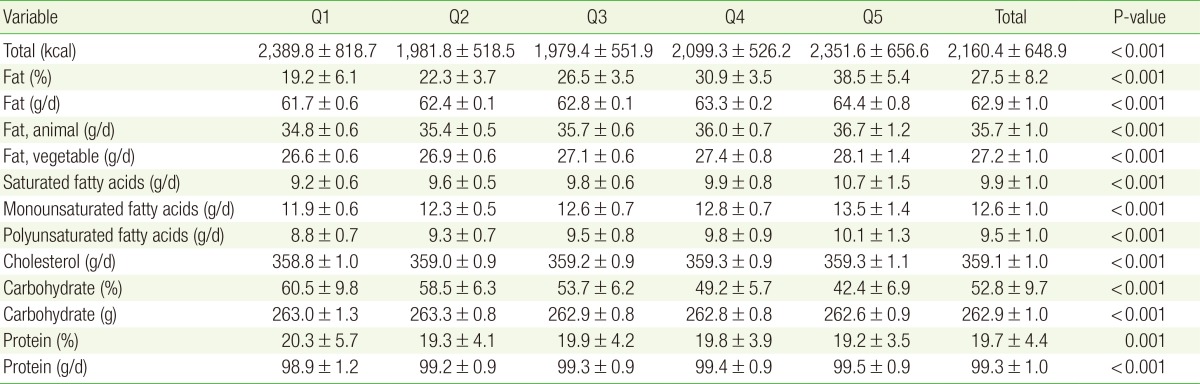
Baseline macronutrient intake according to quintiles of energy-adjusted dietary fat intake (g/d) (n=1,662)
2. The Risk of Metabolic Syndrome according to Dietary Fat Intake
The risk of metabolic syndrome was analyzed by total fat and specific fat intakes, which were divided into quintiles (Table 3). The risk of metabolic syndrome decreased as the intake of total fat increased, but the change was not statistically significant in the multivariate analysis. As for vegetable and animal fats, the risk of metabolic syndrome in relation to the amount of intake showed significance only in vegetable fat. The risk of metabolic syndrome was lowest in the group that had the highest vegetable fat intake (model 1: OR, 0.35; 95% confidence interval [CI], 0.15-0.81; model 2: OR, 0.33; 95% CI, 0.14-0.76). As the intake increased, the risk of disease showed a decreasing trend. However, the relationship between the risk of metabolic syndrome and the intakes of SFA, PUFA, MUFA, and cholesterol showed no statistical relevance.
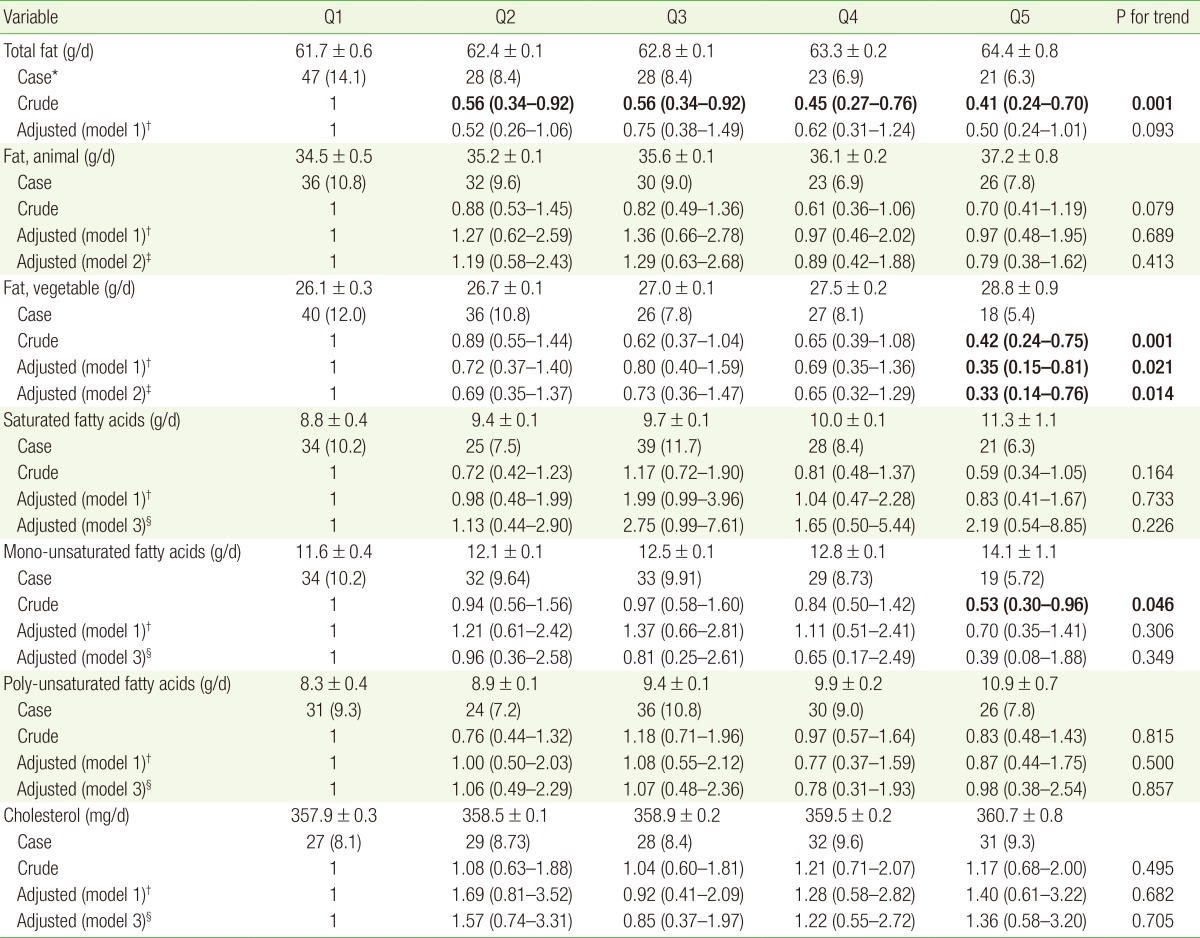
Risk of metabolic syndrome according to quintiles of dietary fat intake
3. Fat Intake and the Risk of Individual Components of Metabolic Syndrome
The risk of individual metabolic syndrome components (high BP, high FBG, high TG, and low HDLC levels) was analyzed in the groups with higher intakes (Q2-Q5) of total and other specific types of fat in comparison with the group with lowest intakes (Q1). In the multivariate analysis, the risk of high TG level was significantly low in the group that had the highest intake of vegetable fat (model 1: OR, 0.45; 95% CI, 0.23-0.88; model 2: OR, 0.46; 95% CI, 0.23-0.90) (Table 4). Taking into account the fact that higher intake of carbohydrate is related to hypertriglyceridemia,18) a multivariate analysis that adjusted for carbohydrate intake rather than protein intake showed the same results. No other meaningful relationship was found between the intake of other specific types of fat and individual metabolic syndrome components.

Risk of metabolic syndrome components in the highest intake group as compared with the lowest intake group
DISCUSSION
In this study, we found an inverse relationship between vegetable fat intake and the risk of metabolic syndrome. However, no significant relationships were found between SFA, PUFA, MUFA, and cholesterol intakes and the risk of metabolic syndrome.
No association was found between the intake of total fat and the risk of metabolic syndrome. This finding correlated with those of previous prospective studies that assessed the relationship between the intake of fat and the risk of diabetes or cardiovascular disease.2319) Recent studies showed that the difference in the amount of specific fat intake, rather than the intake of total fat alone, had greater effect on the risk of cardiovascular disease. In a 14-year cohort of Nurse's Health Study that included more than 80,000 subjects, total fat intake was not relevant to cardiovascular risk. However, the results of this study showed that when the intake of vegetable fat was divided into quintiles, the risk of the highest intake group was 33% less compared with the lowest intake group.1) In the Iowa Women's Health Study that assessed 35,988 women for 11 years by the same method, the group that had the highest intake of vegetable fat had 20% less risk of diabetes than the lowest group.2) In our study, as the intake of vegetable fat increased, the risk of metabolic syndrome decreased. In addition, when the amount of intake was divided into quintiles, the highest-intake group had 67% less risk than the lowest-intake group. However, the intake of animal fat was not associated with the risk of metabolic syndrome, and the main food sources of the animal fat were beef, pork, egg, mackerel, cutlass, etc. Of these animal fat food sources, fish has abundant unsaturated fat such as docosahexaenoic acid and eicosapentaenoic acid, unlike meat. These types of unsaturated fatty acid are well known for their role in the prevention of cardiovascular diseases and metabolic syndrome.2021) The reason why previous studies and our study showed no relationship between animal fat intake and the risk of metabolic syndrome or cardiovascular disease seems to be because food sources that have different characteristics have not been taken into account.
This study did not show significant relationships between the intakes of SFA and the risk of metabolic syndrome. Because of the fact that there are different types of fatty acids in one food, adjusting for other types of diet or fat types with the main target fat should be considered in studies that investigate about saturated and unsaturated fatty acid.10) The past studies did not consider these limitations, but recent prospective studies amended these disadvantages. In the Nurses' Health Study and Iowa Women's Health Study, SFA intake did not have an independent relationship with the risk of cardiovascular disease and diabetes.12) In the Health Professional's Follow-up Study that observed 40,000 men for 12 years, SFA intake increased the risk of diabetes, but the relationship disappeared after adjusting for obesity.22) Recently, two meta-analysis studies conducted using data from previous prospective studies showed that SFA intake was not related to fat intake.45) The results of these previous studies were the same as those of our study that did not illustrate the significant association between saturated fat and the risk of metabolic syndrome.
In this study, no relationship was found between the intake of PUFA or MUFA, and the risk of metabolic syndrome. In the case of MUFA, the risk of metabolic syndrome was lowest in the highest-intake group in the univariate analysis, with statistical significance. However, in the multivariate study, the relationship disappeared. This is different from the results of other previous studies. In the Nurses' Health Study, when the proportion of PUFA and MUFA in total calorie intake increased both by 5%, the risk of cardiovascular disease decreased by 19% and 38% each.1) However, the Health Professionals Follow-up Study did not show a significant relationship between the intake of MUFA and PUFA, and the risk of diabetes in a multivariate analysis.22) In the Iowa Women's Health Study, the intake of PUFA increased the risk of diabetes, but the intake of MUFA was irrelevant to the risk of the disease.2) When SFA intake decreased by 5% of the total calorie intake and PUFA intake increased in a pooled analysis of 11 prospective studies, the risk of cardiovascular disease decreased by 13%, but MUFA intake showed no relationship.23) However, in the most recent published meta-analysis, intakes of both PUFA and MUFA did not show any significant relationship with the risk of cardiovascular diseases.5)
One of the reasons why our study was unlike the previous studies is that there was a difference in the method of assessment of food intake. This study evaluated the nutrient intake by self-reported 1-day food record, and most of the previous prospective studies also used self-reporting systems such as food frequency questionnaires. A recent published study evaluated the relationship between the intake of linoleic acid by food frequency questionnaire and fatty acid composition of plasma phospholipids and the risk of diabetes. Plasma linoleic acid showed inverse relationship with the risk of diabetes, which was opposite to that of the intake of linoleic acid.24) These distinct results illustrate the fact that nutrient intake analysis is limited by the self-report system. Several prospective studies that used fatty acid biomarkers reported that high SFA intake and low unsaturated fatty acid intake increased the risk of diabetes. However, in a meta-analysis, circulating composition of PUFA and MUFA had no relationship with the risk of cardiovascular disease and further studies regarding this issue seem necessary.5)
The other reason of the disparity with the results of the previous studies is that different sources of fatty acids differ in their effects on the risk of diabetes and cardiovascular disease. For example, even though dairy products have similar SFA content as those of different food products, they have relevantly positive effects. The cause of the increased intake of MUFA could be because of meat and dairy food intakes or vegetable fat intake. The method of adjusting for individual types of fatty acids as that in our study could be helpful in eliminating the effect of different sources of food. Moreover, it is well known that even in the same PUFA, the risk of cardiovascular disease could change depending on the proportion of omega-3 and omega-6. In a recent study that reevaluated randomized controlled data, mortality due to cardiovascular disease increased in the intervention group, which had an increased proportion of omega-6 linoleic acid other than SFA, but not in the control group.25) These results illustrate that a thorough assessment is needed for the evaluation of the effect of fatty acid intake.
Concerning the effect of dietary fatty acid intake on the risk of cardiovascular disease, the individual genetic difference is the other element affecting the study results. Plasma lipid concentration is well known to affect the interaction between gene and dietary fatty acid. A study with Koreans reported a difference in the effect of PUFA intake on HDLC concentration ac-cording to a specific genetic mutation.26)
Considering the results of the meta-analyses in previous studies, PUFA intake could have positive effects on BP, HDLC concentration, and TG concentration.272829) However, we did not obtain similar results in this study when we analyzed the individual components of metabolic syndrome. However, this study showed that in a group with high vegetable fat intake, the risk of hypertriglyceridemia was low. It is difficult to find previous studies that evaluated the relationship between vegetable fat and TG concentrations. In a study with Japanese older than 65 years, vegetable intake had a positive effect on TG level. However, in a study that used data from the Korea National Health and Nutrition Examination Survey, no association was found between vegetable intake and hypertriglyceridemia.3031) There seems to be a need for further investigation concerning this issue.
This study defined metabolic syndrome by using the Korean Society for the Study of Obesity's cutoff for abdominal obesity, which is 85 cm for women. For sensitivity analysis, we conducted further assessment by using the standard from the World Health Organization (WHO) Asia-Pacific cutoff for abdominal obesity (male ≥90 cm and female ≥80 cm). The result was similar for the relationship between vegetable fat intake and the risk of metabolic syndrome. However, the statistical significance disappeared after the mutivariate analysis (data not shown). A study based on data from the Korea National Health and Nutrition Examination Survey showed that 85 cm is a more appropriate standard than that indicated by the WHO Asia-Pacific guidelines, which is 80 cm.16) Moreover, in a different study that was also based on data from the Korea National Health and Nutrition Examination Survey, the cutoff set by the Korean Society for the Study of Obesity showed a more significant association with glomerular filtration rate than the cutoff set by the WHO Asia-Pacific guidelines.32)
This study has several limitations. First, the 1-day recall food report that we used for the analysis of nutrient intake was limited in terms of reflecting the usual dietary behavior. Second, because we only used the result of the nutrient analysis on the first visit, the dietary behavior after the first visit was not considered. However, only a few subjects could have changed their dietary behavior because we excluded those who had chronic diseases such as hypertension, hyperlipidemia, diabetes, and others. Third, as mentioned earlier, we have not analyzed different types of fatty acid, including trans-fatty acid, in greater detail. This is the limit of the database of Korean dietary information, so further evaluation is needed to solve this problem. Fourth, in this study, we had difficulty generalizing the study results because the data were only based on subject who visited one university hospital. For example, the subjects of this study consumed a mean of 27.5% of fat in total calorie intake, which is relatively high compared with the known average consumption of Koreans.13) However, considering that not many prospective studies have been conducted on groups that have lower intake of fat than Western people, the results of this study are meaningful.
This study included healthy Korean adults and showed an inverse relationship between vegetable fat intake and the risk of metabolic syndrome. Considering the results of our study, further prospective investigation is needed to assess the relationship between dietary fat intake and the risk of cardiovascular disease.
Notes
CONFLICT OF INTEREST: No potential conflict of interest relevant to this article was reported.