Association between Body Mass Index, Waist Circumference and Prevalence of Microalbuminuria in Korean Adults of Age 30 Years and Older without Diabetes, Hypertension, Renal Failure, or Overt Proteinuria: The 2013 Korean National Health and Nutrition Examination Survey
Article information
Abstract
Background
Microalbuminuria and obesity markers are known risk factors for cardiovascular or renal disease. This study aimed to evaluate the prevalence of microalbuminuria according to body mass index (BMI) and abdominal obesity criteria.
Methods
The study subjects included 3,979 individuals aged 30 years or older who did not have diabetes, hypertension, renal failure, or overt proteinuria, from among those who participated in The Korean National Health and Nutrition Examination Survey in 2013, a cross-sectional, nationally representative, stratified survey. Microalbuminuria was defined as a urinary albumin to creatinine ratio of 30 to 300 mg/g. BMI and waist circumference were classified according to the Asia-Pacific criteria.
Results
The prevalence of microalbuminuria was found to be 5.1%. In the normoalbuminuria group, 3.4%, 41.7%, 24%, 27.6%, and 3.2% of participants were included in the underweight, normal, overweight, obesity 1, and obesity 2 groups, respectively. These percentages in the microalbuminuria group were 7.1%, 34.5%, 19.2%, 28.6%, and 10.6%, respectively (P<0.001). The waist circumference in men was 21.4% in the normoalbuminuria group and 36.5% in the microalbuminuria group (P=0.004). Logistic regression analyses were performed to evaluate the relationship between the presence of microalbuminuria and BMI or waist circumference groups. The risk of microalbuminuria was significant only in the underweight group (odds ratio, 13.22; 95% confidence interval, 2.55–68.63; P=0.002) after adjusting for confounding factors, abdominal obesity was not significantly associated with microalbuminuria.
Conclusion
The prevalence of microalbuminuria in a general population in Korea was associated with underweight in men and was not associated with waist circumference in either men or women.
INTRODUCTION
Microalbuminuria is among the strongest predictors of both diabetic nephropathy and cardiovascular disease outcomes in patients with type 2 diabetes mellitus or hypertension.12) The early detection of microalbuminuria is important in the general population as well3) because studies have shown that microalbuminuria is independently associated with an increase in the prevalence and mortality from cardiovascular disease.4)
Microalbuminuria is considered to be an indicator of a poor renal prognosis because it is associated with hemodynamic adaptations of glomerular hypertension and hyperfiltration in remnant nephrons due to glomerular permeability dysfunction, which ultimately proves detrimental.5) Glomerular albumin leakage is considered to reflect widespread atherosclerosis-mediated capillary vasculopathy or dysfunction of the coagulation and fibrinolytic systems.6)
Several studies have shown that risk factors associated with microalbuminuria include age, systolic blood pressure, fasting serum glucose, body mass index, waist circumference (WC), visceral fat, insulin resistance, malnutrition, chronic inflammation as well as diabetes mellitus, hypertension, and chronic kidney disease.27891011121314) However, studies on the general population are lacking.
Abdominal obesity is found to be more strongly associated with microalbuminuria rather obesity in general,28) and WC and body mass index (BMI) have been frequently used as obesity indices in assessing the relationship between obesity and microalbuminuria, because these variables are easy to measure.1516)
The aim of the current study was to examine the association of BMI and WC with the prevalence of microalbuminuria in Korean adults aged 30 years and older who did not have diabetes, hypertension, renal failure, or overt proteinuria by using The Korean National Health and Nutrition Examination Survey (KNHANES) of 2013.
METHODS
1. Sample
This study included 3,979 individuals aged 30 years or older who did not have overt proteinuria (i.e., urine albumin to creatinine ratio >300 mg/g), diabetes (diagnosed or being treated), hypertension, or renal failure, from among 8,018 individuals who participated in The KNHANES VI-1 in 2013, a cross-sectional, nationally representative, and stratified survey.
2. Physical Measurements and Clinical Examination
Height was measured to the nearest 1 mm using a stadiometer (SECA 255; SECA, Hamburg, Germany). Weight was measured to the nearest 0.1 kg using GL-6000-20 (G-tech, Seoul, Korea).17) BMI was calculated by dividing weight by the square of height (kg/m2). WC was measured to the nearest 1 mm using SECA 200 (SECA) by palpating the two points of the upper portion of the iliac ridge and the lower end of the rib when the study subjects breathed out.17) Abdominal obesity was defined using the Asia-pacific criteria.18)
Blood samples were collected in the morning after fasting for at least 8 hours to measure fasting plasma glucose, hemoglobin A1c (HbA1c), total cholesterol, high density lipoprotein (HDL) cholesterol, low density cholesterol (LDL) cholesterol, triglycerides, serum creatinine, and blood urea nitrogen using ADIVIA650 (Siemens, Madison, WI, USA).17)
Single-spot urine specimens were collected (20–30 mL of midstream voided urine). The ratio of urinary albumin to urinary creatinine, measured using Hitachi 7600 (Hitachi, Tokyo, Japan),17) was reported as urinary albumin-to-creatinine ratio (UACR, mg/g).
Blood pressure (BP) was measured by standard methods using a sphygmomanometer after the subject rested for 5 minutes in the sitting position. Three measurements were taken for each subject at 30-second intervals; the average of the second and third measurements was used in the analysis.17)
The estimated glomerular filtration rate (eGFR) was calculated by the researcher using the Modification of Diet in Renal Disease study equation.19)
3. Definitions
Microalbuminuria was defined as a UACR of 30 to 300 mg/g. The subjects were categorized as having normoalbuminuria (UACR <30 mg/g) or microalbuminuria (UACR 30–300 mg/g). Baseline characteristics were compared between the two groups. These included age, sex, body weight, BMI, obesity, WC, systolic BP, diastolic BP, fasting plasma glucose, HbA1c, total cholesterol, HDL cholesterol, triglycerides, LDL cholesterol, blood urea nitrogen, and eGFR.
Body weight was classified according to BMI as underweight (BMI<18.5 kg/m2), normal (18.5≤BMI<23.0), overweight (23.0 ≤BMI<25.0), obesity 1 (25.0≤BMI<30.0), or obesity 2 (BMI ≥30.0) according to Asia-Pacific obesity criteria. WC was categorized as follows: WC <90 cm and WC ≥90 cm for male participants and WC <80 cm and WC ≥80 cm for female participants.20)
4. Statistical Analysis
The KNHANES VI-1 had a complex sample design, which included a primary extraction unit, multistage stratification, and weighted values to minimize selection bias. To compare baseline characteristics between albuminuria categories, means with standard errors of the mean or standard deviations were extracted using the independent t-test for continuous variables. The chi-square test was used to extract ratios for categorical variables.
The presence of normoalbuminuria or microalbuminuria was used as the binary dependent variable. The 5 BMI (underweight, normal, overweight, obesity 1, and obesity 2) and 2 WC categories were used as independent variables. Multiple logistic regression analyses were performed to analyze the association between microalbuminuria and each dependent variable after adjustment for various confounding variables (those found to be associated with microalbuminuria in previous studies). All analyses were performed using IBM SPSS ver. 20.0 (IBM Co., Armonk, NY, USA). Statistical significance was set at P<0.05.
RESULTS
Of the 3,979 participants considered for inclusion in the study, 3,257 had a UACR of less than 300 mg/g and were included in the final analysis. Of these, 3,091 participants (94.9%) had normoalbuminuria and 166 (5.1%) had microalbuminuria. Age, obesity, systolic BP, diastolic BP, fasting plasma glucose, HbA1c, total cholesterol, triglycerides, serum creatinine, and eGFR were significantly different between the two groups, whereas body weight, BMI, WC, HDL cholesterol, and blood urea nitrogen were not significantly different. In the normoalbuminuria group, 3.4%, 41.7%, 24%, 27.6%, and 3.2% of participants were included in the underweight, normal, overweight, obesity 1, and obesity 2 groups, respectively, while these percentages were 7.1%, 34.5%, 19.2%, 28.6%, and 10.6%, respectively, in the microalbuminuria group (P<0.001). The prevalence of abdominal obesity was significantly different between the normoalbuminuria and microalbuminuria groups for men (21.4% versus 36.5%, P=0.004), although there was no significant difference for women (Table 1).
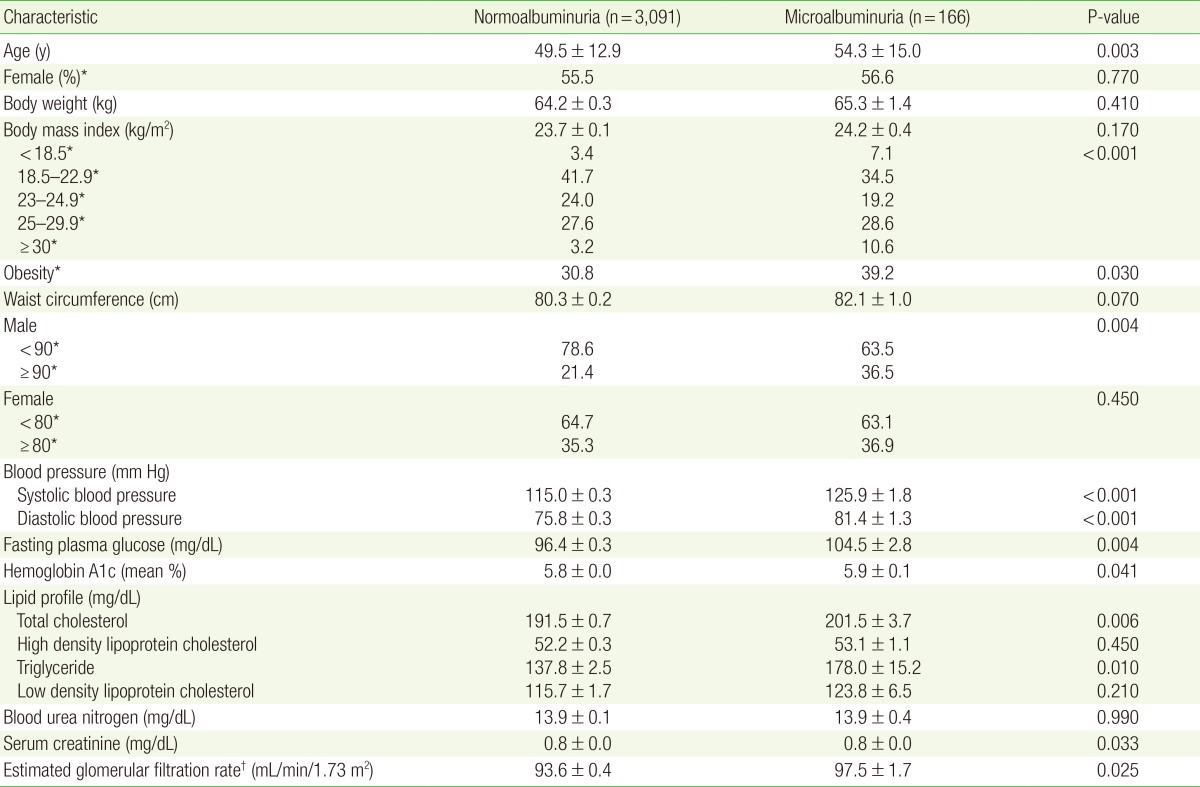
Baseline characteristics and BMI and WC categories in each albuminuria group
In multiple logistic regression analyses, the normal BMI group was used as reference. The risk of microalbuminuria was significantly increased in the underweight and obesity 2 groups (odds ratio [OR], 2.49; 95% confidence interval [CI], 1.28–4.83; P=0.007 for the underweight group; OR, 4.01; 95% CI, 1.95–8.21; P<0.001 for the obesity 2 group). After adjusting for age and sex (model 2), the risk of microalbuminuria was still significantly increased in the underweight and obesity 2 groups (OR, 2.41; 95% CI, 1.22–4.77; P=0.010 for the underweight group; OR, 4.01; 95% CI, 1.95–8.21; P<0.001 for the obesity 2 group). After adjusting for fasting plasma glucose, HbA1c, systolic BP, diastolic BP, triglycerides, total cholesterol, and WC in model 2 (model 3), the risk of microalbuminuria was significantly increased in only the underweight group (OR, 3.82; 95% CI, 1.62–9.02; P=0.002) (Table 2).
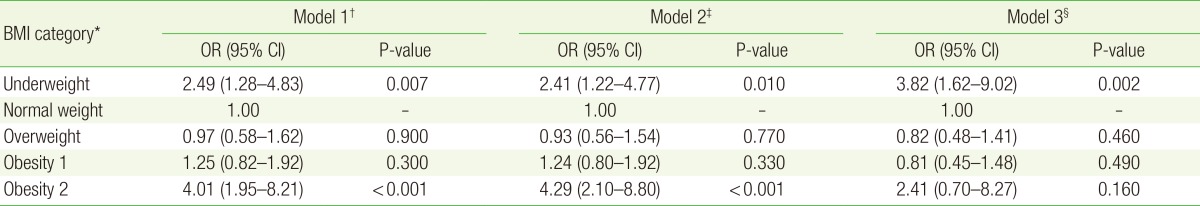
ORs for microalbuminuria in each BMI category, with the normal weight category (18.5≤BMI<23.0) used as reference
For male subjects alone, the risk of microalbuminuria was significantly increased in the underweight and obesity 2 groups in multiple logistic analyses (OR, 5.15; 95% CI, 1.66–16.01; P=0.005 for the underweight group; OR, 5.93; 95% CI, 2.22–15.88; P<0.001 for the obesity 2 group). After adjusting for age (model 2), the risk of microalbuminuria was still significantly increased in the underweight and obesity 2 groups (OR, 4.33; 95% CI, 1.40–13.41; P=0.010 for the underweight group; OR, 7.02; 95% CI, 2.49–19.76; P<0.001 for the obesity 2 group). After adjusting for age, fasting plasma glucose, HbA1c, systolic BP, diastolic BP, triglycerides, total cholesterol, and WC (model 3), the risk of microalbuminuria was significantly increased in only the underweight group (OR, 13.22; 95% CI, 2.55–68.63; P=0.002) (Table 3).
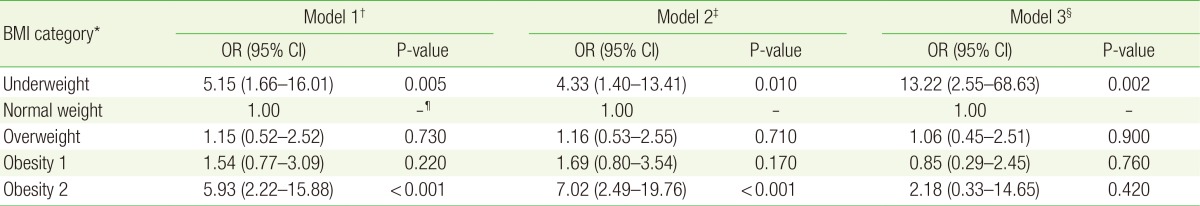
ORs for microalbuminuria in each BMI category for men, with the normal weight category (18.5≤BMI<23.0) used as reference
On the other hand, for female subjects alone, the risk of microalbuminuria was not significantly increased in the underweight, obesity 1, or obesity 2 group, compared with the normal BMI group (OR, 1.65; 95% CI, 0.67–4.09; P=0.280 for the underweight group; OR, 1.05; 95% CI, 0.58–1.91; P=0.860 for the obesity 1 group; OR, 2.59; 95% CI, 0.96–7.04; P=0.060 for the obesity 2 group). After adjusting for confounding factors, the risk of microalbuminuria was not significantly increased in either model 2 or model 3 (Table 4).
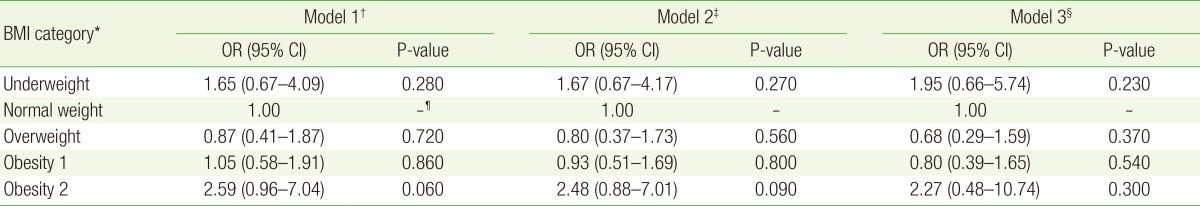
ORs for microalbuminuria in each BMI category for women, with the normal weight category (18.5≤BMI<23.0) used as reference
When multiple logistic regression analysis was performed to determine the risk of microalbuminuria in the abdominal obesity group compared to the normal WC group in male subjects, the OR was 2.12 (95% CI, 1.19–3.77; P=0.010). In female subjects on the other hand, the risk of microalbuminuria was not significantly increased in multiple logistic regression analysis. In men, after adjusting for age, the result was still significant (OR, 2.16; 95% CI, 1.21–3.87; P=0.010). However, in women, the OR decreased to 1.02 after adjusting for age (95% CI, 0.61–1.72; P=0.930) and was no longer significant. After adjusting for confounding factors, the risk of microalbuminuria was not significant in either men or women (Table 5).

ORs for microalbuminuria according to WC (with < 90 cm used as reference for men and < 80 cm used as reference for women)
DISCUSSION
This study aimed to identify the association of BMI and WC categories with the prevalence of microalbuminuria in Korean adults aged 30 years or older who did not have diabetes, hypertension, renal failure, or over proteinuria and participated in The KNHANES in 2013. The BMI category of underweight was found to be an independent risk factor for the presence of microalbuminuria in men.
A previous study showed that microalbuminuria might be associated with abdominal obesity in non-diabetic, non-hypertensive men who attended a Korean health care center.8) Another study showed that abdominal obesity rather than overall obesity was an independent risk factor for microalbuminuria.2)
In men, the proportion of participants with abdominal obesity was significantly different between the normoalbuminuria and microalbuminuria groups (21.4% vs. 36.5%). The risk of microalbuminuria was higher in abdominal obesity group than in the normal WC group in the logistic analyses before adjustments in men. Thus, a positive correlation could exist between abdominal obesity and microalbuminuria, partially confirming the results of previous studies.
Several studies have reported positive correlations between underweight and microalbuminuria both in Korea and in other countries. A possible explanation is that, since underweight is associated with a low muscle mass, the excretion of urinary creatinine is decreased, thereby resulting in an increased risk of microalbuminuria.1221)
A Japanese study reported a U-shaped association between BMI and proteinuria. Postural proteinuria is suggested to be associated with renal ptosis or wandering kidney, which is often found in thin people, and it increases the prevalence of microalbuminuria in underweight individuals.15) A small nephron number increases the risk of hyperfiltration; thus, it might result in proteinuria because underweight individuals may have had a low birth weight as well.2223)
The term 'malnutrition inflammation complex syndrome' has been used for patients diagnosed with end-stage renal disease because malnutrition has been found to be closely associated with an inflammatory reaction in these patients.13)
Serum albumin, total iron binding capacity, and BMI are commonly used markers of nutritional status,13) and the C-reactive protein level is often employed as a marker of inflammation. The associations between these factors and cardiovascular disease have been investigated in several studies.242526)
A low BMI might reflect low muscle mass. A reduced muscle mass in turn might trigger an inflammatory reaction, resulting in an increase in the levels of inflammatory markers such as interleukin-6 or C-reactive protein27) or coronary heart disease.2128) Although fat might be expected to decrease during weight loss, visceral fat is not easily lost, whereas muscle mass and water content decreases more easily in humans.29) Thus, the underweight BMI group could be affected by inflammatory reactions of visceral fat and have a decreased muscle mass, thus explaining the high risk of microalbuminuria in this group in this study.
In this current study, there was definite gender-related difference in the risk of microalbuminuria according to BMI category. This result might be associated with the fact that men are more likely to have more visceral fat than other fat components whereas women are more likely to have more subcutaneous fat than other fat components, due to hormonal differences.30)
Adiponectin, which is secreted by adipocytes, is an anti-atherosclerotic, anti-inflammatory substance, and its secretion is decreased with an increase in visceral fat, resulting in an increase in the prevalence of cardiovascular disease. The greater the proportion of visceral fat in the body, the higher the level of inflammatory substances secreted; this adversely affects blood vessels and insulin action, and increases the risk of cardiovascular disease.731) The male subjects in the underweight group in this study might have had the most severe inflammatory reaction because of the relatively decreased muscle mass and increased proportion of visceral fat, thus increasing the prevalence of microalbuminuria.
According to the statistical data of KHANES VI-1 (2013), the rate of subjectively recognizing obesity and the proportion of individuals trying to lose weight are showing an increasing trend.17) This is encouraging on the one hand because the prevalence of obesity is estimated to be 30% in Korea. On the other hand however, the results of this study indicated that excessive weight loss have an adverse effect on health. Therefore, a balanced diet, an increase in muscle mass, and a decrease in fat would be more important than unconditional excessive weight loss.
Because of its cross-sectional design, this study did not allow the investigation of causality in the association between microalbuminuria and malnutrition. However, this study is valuable because of the early results indicating an association between microalbuminuria and underweight in a general population aged 30 years or older in a representative sample of the Korean population. Further studies that include an analysis of the serum albumin level, C-reactive protein level, and body fat ratio, which are relatively easy to evaluate, are expected to be undertaken in the future.
Notes
CONFLICT OF INTEREST: No potential conflict of interest relevant to this article was reported.