Association of Fasting Glucose Level with Neutrophil-Lymphocyte Ratio Compared to Leukocyte Count and Serum C-Reactive Protein
Article information

Abstract
Background
The neutrophil-lymphocyte ratio (NLR) is often used as an inflammatory marker in chronic diseases such as cancer or cardiovascular diseases. However, there are few studies about the association between the NLR and diabetes mellitus (DM) or impaired fasting glucose (IFG) patients in Korea. This study investigated the association between the fasting plasma glucose (FPG) level and NLR in Koreans.
Methods
This cross-sectional retrospective study included 3,219 healthy subjects who visited Konyang University Hospital in South Korea for regular health examinations. Participants with a history of insulin administration, anti-diabetic drugs, anti-inflammatory drugs, or underlying diseases related to inflammation were excluded.
Results
All statistical evaluation was performed by dividing participants into males and females. Based on FPG levels, the subjects were classified into three groups, with normal fasting glucose (n=1,969), IFG (n=1,138), and DM (n=122). The NLR had no significant mean differences among these groups for both sexes. Multiple linear regression analysis between FPG level and NLR showed an independent and significantly negative association (β±standard error, −0.67±0.24; P=0.006) in normal subjects after adjustment. Log(serum C-reactive protein [S-CRP]) showed an independently and significantly positive association with FPG in male IFG/DM patients. Total leukocyte (white blood cell [WBC]) showed an independently and significantly positive association with FPG in female IFG/DM patients.
Conclusion
In normal subjects, NLR shows an independently and significantly negative association with FPG. In IFG/DM patients, NLR was not significantly related to FPG. WBC count in female patients and S-CRP level in male patients were significantly positively associated with FPG only in IFG/DM.
INTRODUCTION
Type 2 diabetes mellitus (DM) is an epidemic in Korea. About 4.8 million (13.7%) Korean adults aged 30 years or older, had DM and 8.3 million (24.8%) Korean adults had impaired fasting glucose (IFG) in 2014.1)
Insulin resistance is a metabolic disturbance that may result in central obesity and type 2 DM, as well as cardiovascular disease.2) Several studies have confirmed that insulin resistance is associated with a chronic inflammatory state in which immunological changes play a key role in the initiation of type 2 DM.345)
Systemic inflammation is characterized by increased neutrophil and decreased lymphocyte counts in chronic diseases such as cancer and cardiovascular disease.678) The neutrophil-lymphocyte ratio (NLR) is a laboratory test that does not have to be performed in the fasting state, and is a readily available inflammatory marker used to evaluate the severity of chronic diseases.9) Although insulin resistance is closely related to chronic inflammatory status,10) few studies have evaluated the relationship between the NLR and fasting plasma glucose (FPG) level or insulin resistance in Korea. Therefore, we assessed the association of FPG with inflammation based on the NLR, compared to other inflammatory markers such as serum C-reactive protein (S-CRP) and white blood cell (WBC) count.11)
METHODS
1. Study Population and Design
This retrospective cross-sectional study included 20,320 individuals that underwent health examinations at Konyang University Hospital in Daejeon, South Korea between June 1, 2014, and May 31, 2016. Medical records for 4,107 of these subjects were available for the assessment of chronic inflammatory status based on the levels of FPG, S-CRP and insulin, as well as WBC.
We excluded subjects who were taking anti-diabetic drugs or injected insulin. Patients with hepatitis B virus (surface antigen positive) or (hepatitis C virus-RNA >15 IU/mL or 40 copies/mL) infection, rheumatologic diseases (psoriasis, ankylosing spondylitis, or rheumatoid arthritis), asthma, and other forms of arthritis were also excluded, as well as examinees who were taking anti-allergic drugs, and regularly took steroids. Foreigners (regarding nationality and ethnicity) were also excluded, including those of Russian, African, American, Indian, Vietnamese, Chinese, and Japanese descent. Subjects whose WBC >10,000 were excluded by assuming acute inflammation. We did not exclude subjects with hypertension, hyperthyroidism, hypothyroidism, dyslipidemia, and depression. Based on the above exclusion criteria, a total of 3,219 subjects were selected for this study.
2. Definitions
DM and IFG were diagnosed based on the 2003 American Diabetes Association Expert Committee on the Diagnosis and Classification of Diabetes Mellitus using fasting glucose levels (DM: FPG ≥126 mg/dL [7.0 mmol/L] and IFG: FPG ≥100 mg/dL [5.6 mmol/L] to <126 mg/dL [6.9 mmol/L]).12) The homeostatic model assessment of insulin resistance (HOMA-IR) index was calculated from fasting glucose and insulin levels at the visit using the following equation:13) (fasting glucose [mg/dL]×fasting insulin [µIU/mL])÷405. The homeostatic model assessment of beta-cell function (HOMA-beta), which is used to identify pancreatic beta cell dysfunction, was calculated using the following equation:14) (360×fasting insulin [µIU/mL])÷(fasting glucose [mg/dL]−63) (%).
Participants' history of underlying disease, drug administration, alcohol intake, smoking, and exercise was collected using a subject-completed questionnaire saved in the medical record. Hypertension was diagnosed as systolic blood pressure ≥140 mm Hg, diastolic blood pressure ≥90 mm Hg, or the use of antihypertensive drugs. Smoking was defined as a participant smoking more than 100 cigarettes in his/her whole lifetime. Alcohol intake was defined as the consumption of >14 g/d. Exercise was defined as regular physical activity summing to at least 2 hours per week.
3. Anthropometric Measurements
Weight and height were measured using an automated machine (HM-170; Fanics, Seoul, Korea) and bioelectrical impedance analyzer (Inbody 720; Biospace, Seoul, Korea) with subjects standing on a firm horizontal surface. Body mass index (BMI) was calculated using the formula: weight (kg)÷(height2) (m2). Blood pressure was recorded to the nearest 2 mm Hg from the right arm with the subject in a seated position (BPBIO320; Biospace, Cheonan, Korea). Two readings were taken 5 minutes apart, and the mean was recorded as the blood pressure. Waist circumference was measured using a tape passed through bilateral midpoints of a vertical line between the lowest rib and anterior superior iliac spine during mid-exhalation.
4. Biochemical Parameters and Leukocyte Count
Venous blood was drawn from the antecubital vein after fasting for at least 9 hours. WBC with differential count was measured using an LH-780 analyzer (Beckman Coulter, Brea, CA, USA). S-CRP, total cholesterol, high-density lipoprotein cholesterol (HDL-C), low-density lipoprotein cholesterol (LDL-C), triacylglycerol (TG), FPG, protein, albumin, alanine transaminase (ALT), and aspartate transaminase (AST) levels were measured using an AU-5800 analyzer (Beckman Coulter, Shizuoka, Japan). Glycated hemoglobin (HbA1c) was measured using an ADAMS A1c HA-8180 machine (Arkray, Shiga, Japan). Insulin was measured using an RIA-mat 280 machine (STRATEC, Birkenfeld, Germany).
5. Statistical Analysis
Data for continuous biochemical skewed parameters (S-CRP, insulin, HOMA-IR, HOMA-beta, AST, ALT, and TG) were expressed as median (interquartile range) and the other continuous biochemical parameters were shown as mean±standard deviation (SD). By the law of large numbers, we assumed a normal distribution of values except for skewed variables. Skewness was tested by Q-Q plot in the R statistics program (http://www.r-project.org). Categorical values were expressed as numbers and percentages (%). Wilcoxon rank-sum tests were used for skewed variables and t-tests were used non-skewed variables in Table 1. Since there were significant differences between males and females in many parameters, we needed to divide all subjects by sex to show demographic variables. Chi-square tests were used to compare categorical variables.
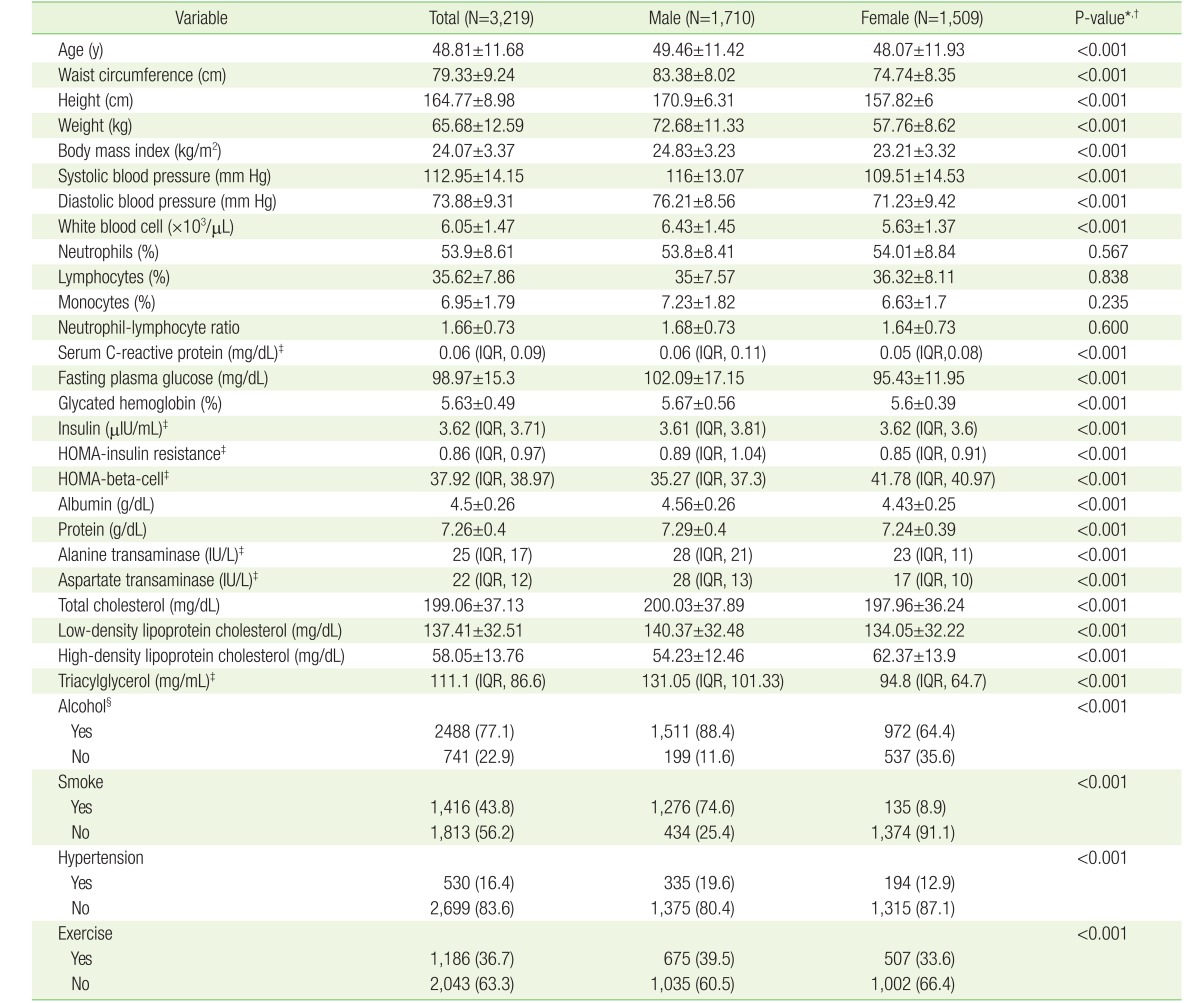
Demographic and laboratory data classified according to sex
Kruskal-Wallis test was used for skewed variables and one-way analysis of variance test was used for non-skewed variables to assess whether there were differences in the median or mean difference among normal subjects, IFG, and DM patients in each gender category (Table 2).
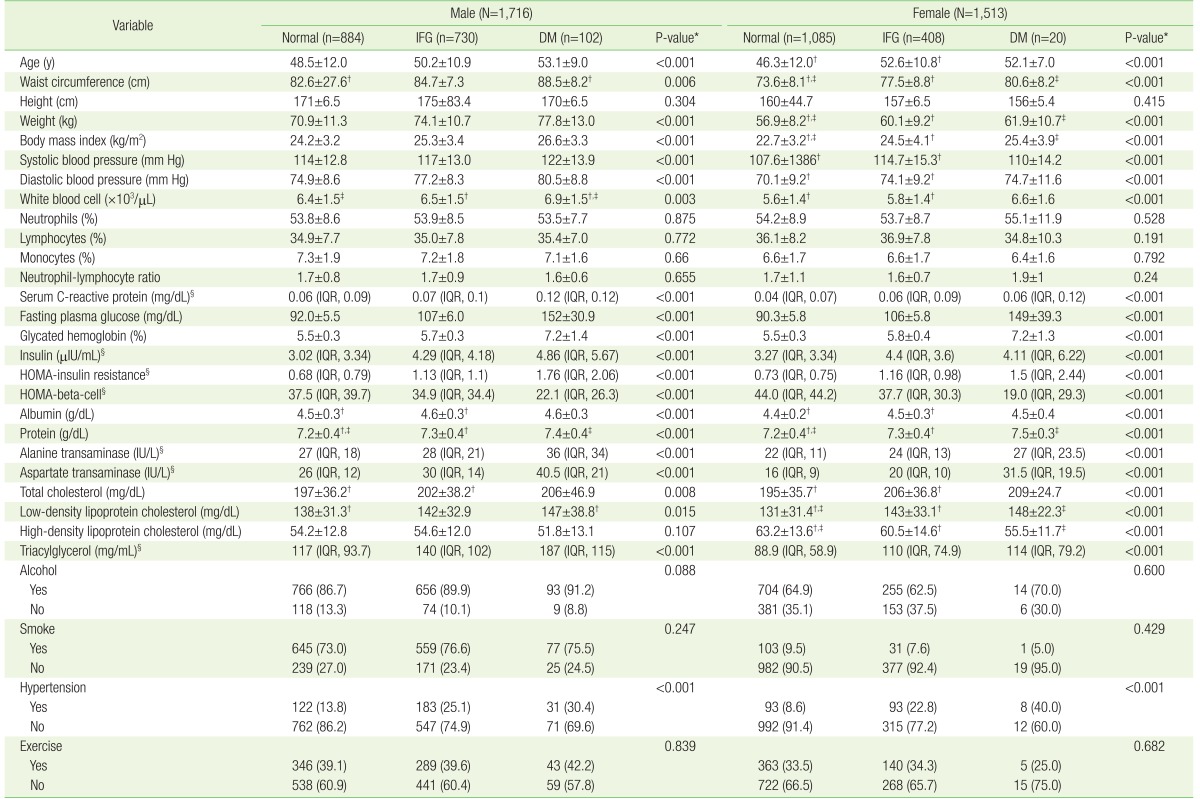
Demographic and laboratory data classified into three groups according to fasting plasma glucose levels (total N=3,229)
Spearman's correlation analysis was performed for skewed variables and Pearson's correlation analysis was done for non-skewed variables in Table 3. We merged IFG and DM patients into a patient group. Subgroup correlation analysis of normal and IFG/DM group was performed.
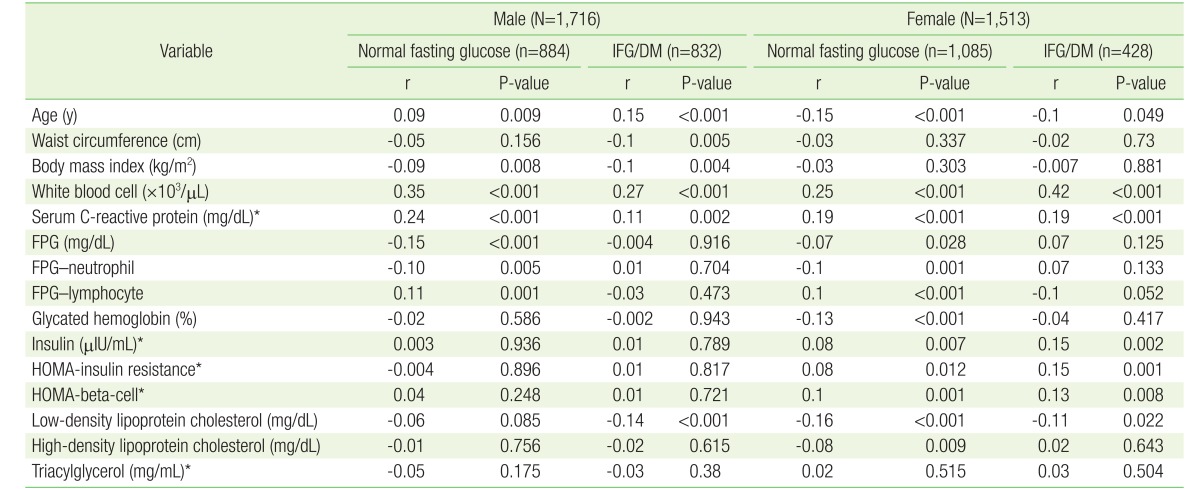
Correlation between neutrophil-lymphocyte ratio and other factors divided into normal fasting glucose and IFG/DM
Multiple linear regression analysis was performed to investigate the relationship between FPG and inflammatory markers, such as NLR, WBC, and Log(S-CRP) (Table 4). To compare NLR, WBC, and Log(S-CRP), we used these variables as independent parameters and FPG as the dependent variable. We analyzed these data stratified according to the independent variables. In order to avoid multicollinearity, we assessed variation inflation factor levels of independent variables to be lower than 10 in each model. In model 1, we analyzed the association between inflammatory markers and FPG using simple linear regression and expressed only significant independent variables among NLR, WBC, and Log(S-CRP). In models 2, 3, and 4, independent variables were added to the previous model to find out explanatory power of parameters. HOMA-IR and HOMA-Beta had significant independent relationship with FPG in each subgroup. We represented which HOMA variable was significant by writing nearby P-value, such as (-IR) or (-beta). Since the variables insulin, HOMA-IR and HOMA-Beta were multicollinear, they were not used as independent variables simultaneously. Although age, BMI, LDL-C, HDL-C, and Log(TG) were also used as independent variables in each model, we omitted these data for simplicity.
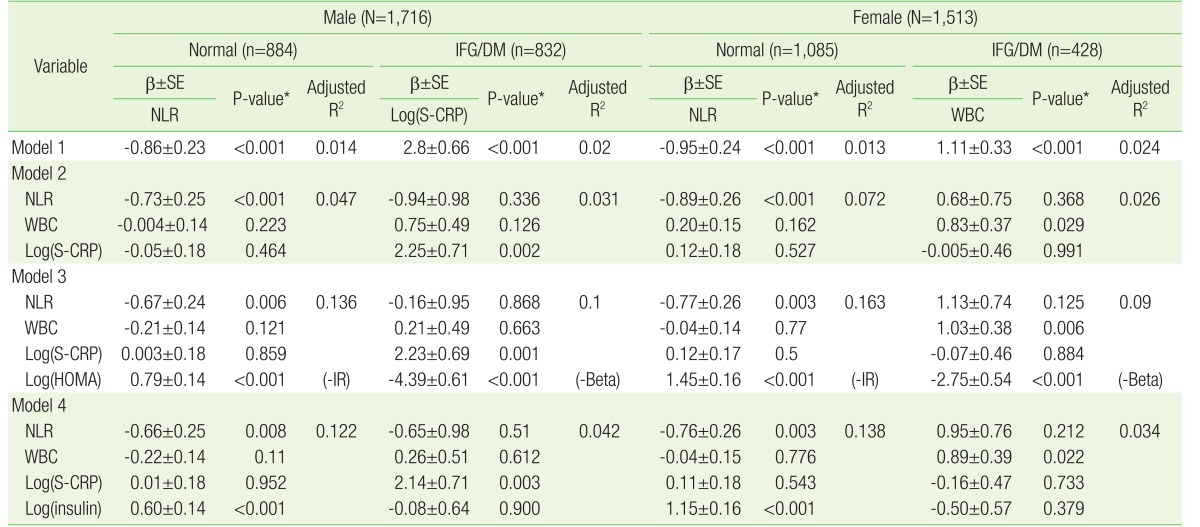
Multiple linear regression analysis of factors independently associated with fasting plasma glucose
All analyses were performed using the R statistical package ver. 3.3.1 (http://www.r-project.org) with R Studio ver. 0.99 (Cygnus Inc., Redwood City, CA, USA), which are open source software that follow the Lesser General Public License ver. 2.1 (http://www.gnu.org/licenses/lgpl.html). P-values <0.05 were considered statistically significant.
RESULTS
1. Baseline Characteristics of the Demographic and Laboratory Data
The baseline characteristics of the participants are listed in Table 1. The mean±SD of age among males was 49.5±11.4 years, and 48.1±11.9 years for females. Most parameters significantly differed in median or mean between males and females. The means of neutrophil, lymphocyte, monocyte, and NLR were not significantly different between both sexes. Most variables that affect glucose metabolism or represent chronic inflammation were worse in males than females (higher: BMI, SBP, DBP, WBC, S-CRP, FPG, HbA1c, LDL-C, and TG; lower: HOMA-beta and HDL-C). Lifestyle variables (alcohol consumption, smoking, hypertension, and exercise rate) were also higher in males than females.
Table 2 presents, based on FPG levels, the examinees classified into three groups for each sex, respectively (male subjects: normal [n=884], IFG [n=730], and DM [n=102]; female subjects: normal [n=1,085], IFG [n=408], and DM [n=20]). NLR was not significantly different among the three groups (normal, IFG, and DM) for both sexes. There were also no significant differences in neutrophil and lymphocyte, themselves, among the three groups for both sexes. Inflammatory markers (S-CRP and WBC), glucose metabolism parameters (HbA1c, insulin, and HOMA-IR) and demographic parameters (age, BMI, SBP, DBP, and waist circumference) were higher in the IFG and DM groups than in the normal groups for both sexes. These parameters worsened with increasing FPG. All lipid profile variables among females were higher in the IFG and DM groups. Among the lifestyle parameters, only hypertension prevalence was significantly higher in IFG and DM group for both sexes.
2. Correlation between Neutrophil-Lymphocyte Ratio and Other Factors with Subgroup Analysis for Both Sexes
Table 3 shows the correlation between the NLR and other parameters by Spearman's or Pearson's correlation analysis. WBC and S-CRP were significantly positively correlated with NLR in all subgroups for both sexes. In the normal subgroup, FPG was significantly negatively correlated with NLR while the IFG/DM subgroup did not demonstrate any such correlation for both sexes. Neutrophils and lymphocytes, themselves, were significantly correlated with FPG with correspondence to negative correlation between NLR with FPG. In the IFG/DM patients group, there was no significant correlation between FPG and NLR, and neutrophils and lymphocyte for both sexes. We found significant correlation between NLR and HOMA, insulin, and LDL-C in female subjects for the normal and patient subgroups.
3. Multiple Linear Regression Analysis of Fasting Plasma Glucose Associated with Neutrophil-Lymphocyte Ratio, White Blood Cell, and Log(Serum C-Reactive Protein)
Both men and women were divided into two groups according to the fasting glucose level such as normal fasting glucose subjects group (FPG <100 mg/dL) and IFG/DM patients group (FPG ≥100 mg/dL). We performed simple or multiple linear regressions in each subgroup, as described in Table 4. In model 1 of the simple linear regression results, FPG levels were significantly negatively associated with NLR in the normal subjects group for both sexes (male: β±standard error [SE], −0.86±0.23; P<0.001; female: β±SE, −0.95±0.24; P<0.001). WBC and Log(S-CRP) were not significantly associated with FPG in the normal subjects group. Log(S-CRP) was significantly positively associated with FPG in the male IFG/DM patients group (β±SE, 2.8±0.66; P<0.001). WBC was positively significantly associated with FPG in the female IFG/DM patients group (β±SE, 1.11±0.33; P<0.001).
In model 2, we compared the three inflammatory markers NLR, WBC, and Log(S-CRP) using multiple linear regression analysis after adjusting for age and BMI. In model 3, HOMA variables and lipid profile variables were adjusted additionally. In model 4, to figure out the effect of insulin on normal subjects, we substituted the variable HOMA with Log(insulin). In all models, both men and women who had normal FPG levels had significantly negative association between FPG and NLR. Log(S-CRP) was significantly positively associated with FPG only in the male IFG/DM group. WBC was significantly positively associated with FPG only in the female IFG/DM group. In model 3, particularly, Log(HOMA-IR) was significantly positively associated with FPG in the normal group for both sexes, while Log(HOMA-beta) was significantly negatively associated with FPG in the IFG/DM group for both sexes. Log(insulin) level was significantly positively associated with FPG level only in the normal fasting glucose group for both sexes in model 4.
DISCUSSION
The results of this study suggested that there were significant differences in inflammatory markers among subgroups divided by sex and FPG state. NLR was not a reliable inflammatory marker in IFG/DM patients and was significantly negatively associated with FPG level only in the normal fasting glucose group for both sexes. We suggest that lymphocyte proliferation plays a key role in the effect of NLR on insulin secretion in normal subjects.
1. Lymphocyte Proliferation with Increase in Glucose Level in Normal Subjects
Otton et al.15) argued that insulin level had a significantly positive relationship with lymphocyte proliferation in normal and diabetic rats. Insulin promoted a remarkable increase in lymphocyte proliferation (7.5-fold) in the normal rat group and this response was much lower (2.6-fold) in lymphocytes from diabetic rats. Our study suggested that subjects who had normal fasting glucose might preserve their insulin secretion function well. In normal subjects, elevated glucose level induced enough insulin secretion, and this affected the proliferation of lymphocytes more than subjects with lower glucose levels in the normal fasting glucose group. This suggestion was consistent with the result of this study, that is, the increase in lymphocytes when FPG and insulin increased in the normal fasting glucose group (Table 3 and model 4 of Table 4). On the other hand, another study reported that mitogen-induced lymphocyte proliferation was 19%–32% lower in obese (mean BMI, 33.2±6.5 kg/m2) than non-obese subjects (mean BMI, 21.2±1.9 kg/m2), when adjusted for T and B lymphocyte count.16) Insulin is a well-known mitogenic hormone.17) Insulin seemed to have an effect on lymphocyte proliferation, regardless of mitogenicity. Further investigation will be needed in this regard.
2. Neutrophil Count Fluctuation
An experimental study of mice fed a high-fat diet showed that neutrophil secretion of elastase resulted in insulin resistance.18) Hyperglycemia inhibits the apoptosis of neutrophils and prolongs inflammation in diabetic mice. Decreased apoptosis of neutrophils is associated with impaired clearance of neutrophils by macrophages in diabetic mice.19) Our study suggests that normal subjects seemed to have an intact ability of macrophages to clear neutrophils and stabilize their counts. This relationship in our study (Table 3), which was between neutrophils and FPG in the normal fasting glucose group was suggested due to the relative increase in lymphocyte count in response to an increased neutrophil count (r=−0.10, P=0.005 in males; r=−0.1, P=0.001 in females).
3. NLR as an Inflammatory Marker
NLR was not a more significant inflammatory marker than WBC and S-CRP in IFG/DM patients group in our research. NLR had no statistically significant relationship with FPG in IFG/DM patients. FPG level is a criterion in diagnosing metabolic syndrome. Bahadir et al.20) showed NLR was not significantly different according to severity of metabolic syndrome. The leukocyte, neutrophil, and lymphocyte counts significantly increased with increasing degree of obesity and BMI without classification of normal or pre-diabetes/DM. In a Turkish study, there were no significant differences in NLR among subjects with euglycemia, IFG, and impaired glucose tolerance (IGT).21) On the other hand, some studies revealed that high levels of lymphocyte apoptosis were triggered by the development of DM and hyperglycemia.2223) Shiny et al.24) reported higher NLR and neutrophil levels, and lower lymphocyte counts in patients with DM and IGT compared to normal subjects who were mostly Indian. Another study showed that the higher the NLR, the higher the HbA1c level.25)
In the IFG/DM group of our study, NLR was not a reasonable biomarker and was not associated with FPG which represented severity of IFG/DM. NLR, neutrophil and lymphocyte levels were not significantly associated with FPG in IFG/DM patients of both sexes, respectively. The results of the linear regression of neutrophil and lymphocyte counts with FPG were omitted in Table 4. In the IFG/DM group, most of the other studies which showed that NLR had a positive association with FPG was only for individuals with metabolic syndrome or type 2 DM patients.2425) Few studies have evaluated the association between NLR and FPG in normal subjects. Other studies showed a significantly positive association between NLR and FPG in the patients group, while our results did not show such an association in the IFG/DM group. Thus, we guess there could be a possible difference in underlying pathophysiology between the participants of this study and those of other studies. Ohn et al.26) reported that in Korean or Oriental subjects, the impairment of beta-cell function has a more significant effect on the onset of DM than insufficient insulin sensitivity does. In a research of 3,059 Japanese subjects who regularly visited for medical check-ups, insufficient beta-cell function had a greater effect on the aggravation of diabetes than insulin resistance.27) We suggest that the positively significant association between NLR and glucose level in other studies was due to genetic differences between Oriental and Western subjects. In the Western study mentioned previously, insulin resistance, obesity, and high BMI had a tendency to affect the onset of DM, while insufficient insulin secretion function tended to affect the pathophysiology of DM in Oriental or Korean subjects. Impairment of insulin secretion function was more predictive of incident DM than insulin sensitivity in Koreans.26) Five genes (UBE2E2, ST6GAL1, GCK, KCNJ11, and C2CD4A) are known to be associated with pre-diabetes and DM according to the Beta Cell Gene Atlas.28) Glucokinase plays a key role in insulin secretion because it senses the glucose concentration in pancreatic beta cells. A pathological mutation in the GCK gene induces monogenic diabetes of the young type 2. This genetic variation has been associated with the impairment of glucose tolerance.29) In addition, a combined meta-analysis for type 2 DM revealed two new loci, CCDC63 and C12orf51 in the 12q24 region. These variants were significantly associated with FPG and HOMA-beta in Korean males with high-specificity.30) In short, Oriental or Korean subjects had genetic features of fragility in insulin secretion function while insulin resistance in Western subjects was a more important feature in the onset of pre-diabetes or DM.
4. Serum C-Reactive Protein and White Blood Cell in Impaired Fasting Glucose/Diabetes Mellitus Patients
Bahadir et al.20) revealed that WBC and CRP levels were higher in the more severe metabolic syndrome patients than normal non-diabetic subjects. Our study also showed that Log(S-CRP) was elevated with the increase in severity of IFG/DM in male patients and WBC was also increased in female IFG/DM patients. There were no differences in inflammatory markers according to gender.
5. Limitations
Several potential limitations should be considered. First, IFG and DM were diagnosed only by fasting glucose levels for clinical convenience in the general health examination center. To evaluate which inflammatory markers are effective in detail, further research is necessary regarding the association between NLR and HbA1c levels or glucose tolerance in Koreans. More specialized subgroup classification would also be needed. Second, the cross-sectional retrospective design prevented the identification of causality. Third, we investigated individuals without severe symptoms who were able to visit the health examination center of his/her own accord; this potential selection bias may have affected the results of this study.
6. Conclusion
The present study provides evidence that NLR has an independently and significantly negative relationship with FPG in normal subjects. As an inflammatory marker, NLR is not a reasonable biomarker in both normal and IFG/DM patient subgroups. S-CRP had an independently and significantly positive relationship with FPG in male IFG/DM patients. WBC had an independently and significantly positive relationship with FPG in male IFG/DM patients. S-CRP and WBC had no significant relationship with FPG in normal subjects. Research related to sexual differences in inflammatory markers could hardly be found. Further research would be needed. The finding of our study demonstrates that NLR is clinically significant as an inverse parameter of FPG level in normal subjects. S-CRP and WBC are clinically significant only in Korean IFG/DM patients.
Notes
CONFLICT OF INTEREST: No potential conflict of interest relevant to this article was reported.