The Prevalence of Osteoarthritis and Risk Factors in the Korean Population: The Sixth Korea National Health and Nutrition Examination Survey (VI-1, 2013)
Article information

Abstract
Background
Knee osteoarthritis is highly prevalent, especially among the elderly. However, its risk factors have not been well identified, especially in the Korean population. This study aimed to assess the epidemiologic characteristics and risk factors of knee osteoarthritis in the Korean population.
Methods
Data of 2,280 (1,295 women) participants of the 2013 Korea National Health and Nutrition Examination Survey aged ≥50 years who underwent knee radiography were analyzed. According to the American College of Rheumatology clinical/radiographic classification criteria, knee osteoarthritis was defined as knee pain and radiographic knee osteoarthritis. The association between risk factors and knee osteoarthritis was analyzed using the chi-square test and binominal logistic regression.
Results
The participants had an average age of 62.6 years; 56.8% of them were women. The average body mass index was 24.2 kg/m2, and 296 (13%) participants were diagnosed with knee osteoarthritis. After adjustment for multiple risk factors, age of ≥65 years (adjusted odds ratio [OR], 2.552; 95% confidence interval [CI], 1.868–3.486), female sex (OR, 2.050; 95% CI, 1.275–3.295), obesity (body mass index, ≥25.0 kg/m2 ; OR, 1.563; 95% CI, 1.191–2.051), hypertension (OR, 1.394; 95% CI, 1.052–1.846), low educational level (lower than or equal to elementary school: OR, 4.761; 95% CI, 2.131–10.635; middle school: OR, 3.184; 95% CI, 1.375–7.369), and low strength exercise frequency (<2 times/wk; OR, 1.829; 95% CI, 1.202–2.784) increased the risk of knee osteoarthritis.
Conclusion
Old age, sex, obesity, hypertension, low educational level, and low strength exercise frequency were found to be risk factors for knee osteoarthritis.
INTRODUCTION
Knee osteoarthritis (OA) is a widely prevalent disorder causing knee pain and limitation in the performance of activities due to gradual deterioration and inflammation of the articular cartilage. The knee joint is a frequent site of OA-related pain [1,2], especially in older age groups in which self-reported knee pain is commonly attributed to symptomatic and radiographic knee OA. Nearly 27 million American adults were reported to have clinical knee OA in 2008 (an increase from 21 million in 1995) [3]. Knee OA seems to increase the risk of several negative outcomes and is associated with higher rates of hospitalization [4] and institutionalization [5] and a higher risk of earlier death [6]. Therefore, it is important to identify individuals who have risk factors for knee OA at an early time point.
Previous studies have shown that older age, female sex, obesity, muscle weakness, hypertension, low educational level, and low household income were the risk factors for knee OA mainly in Caucasians [7-9]. While there are several risk factor studies on Caucasians, only a few population-based cohort studies have examined the risk factors for knee OA in the Asian population. Previously, there was a similar study on the Korean population; however, the risk factors were limited to age, sex, obesity, and quality of life [10]. In addition, one study reported race and severity of joint stiffness as risk factors for early radiographic changes [11]; research on other risk factors is lacking.
Therefore, the purpose of this study was to estimate the risk factors of knee OA in the Korean population. To evaluate the risk factors associated with knee OA, we studied a population-based group of Korean individuals aged ≥50 years from the 2013 Korea National Health and Nutrition Examination Survey (KNHANES). We examined the risk factors for knee OA as well as knee pain. Radiologic information was evaluated using the Kellgren-Lawrence (K-L) grade [12].
METHODS
1. Study Population
This cross-sectional study used data from the 2013 KNHANES managed and released by the Korea Centers for Disease Control and Prevention. These data were collected by the Korean government as basic data for examination and estimation of the general health state, health care perception and usage, food consumption, and nutritional status of the South Korean population at the national and regional (city and province) levels and for incorporation to public health care policy and policy evaluation. All participants provided written informed consent and were given the right to refuse to participate according to the National Health Enhancement Act. Because all KNHANES data are publicly available, this study did not require institutional review board approval.
Of 10,113 potential respondents, 8,018 (79.3%) participated in the examination and survey. In this study, we excluded 5,006 participants under the age of 50 years and 239 participants over the age of 50 years who did not undergo knee radiography. An additional 493 participants who did not respond to the survey were excluded. Thus, the subjects of this study were limited to 2,280 participants aged ≥50 years who received knee radiography and completed health survey sections on knee OA.
2. Identification of Knee Osteoarthritis
According to the American College of Rheumatology clinical/radiographic classification criteria, knee OA was defined as the presence of knee pain and at least one of the following three items along with osteophyte formation on knee radiographic images: age of >50 years, <30 minutes of morning stiffness, and crepitus upon knee motion [13]. Since all participants in our study were aged over 50 years, the presence of knee pain and radiographic knee OA were enough for the diagnosis. The presence of knee pain was identified using responses to a questionnaire. The K-L grade was adopted for the diagnosis of radiographic knee OA using knee radiography. The K-L grade [12], a 5-level index ranging from 0 to 4 (0=none, 1=doubtful, 2=definite, 3=moderate, and 4=severe radiographic knee OA), is a standard radiographic measurement of joint deterioration used in diagnosing and staging radiographic knee OA. Patients were considered to have radiographic knee OA when they had a K-L grade of ≥2 on knee radiography in the 2013 KNHANES [12,14].
3. Covariates
The following baseline patient characteristics were assessed: age (≥65 years or <65 years), sex, body mass index (BMI; <25.0 kg/m2 or ≥25.0 kg/m2), hypertension, diabetes, dyslipidemia, household income (<$650, $650 to<$1,300, $1,300 to<$2,100, or ≥$2,100), educational level (lower than or equal to elementary school, middle school, high school, or higher than or equal to university), frequency of strength exercise (≥2 times/wk or <2 times/wk), aerobic exercise (≥150 minutes of moderate-intensity activity/wk or <150 minutes of moderate-intensity activity/wk), smoking status (non-smoker, ex-smoker, or current smoker), and alcohol consumption (no consumption, ≤1 time/wk, or >1 time/wk). For the assessment of the patient-reported knee pain status, the numerical rating scale score (from 0 to 10) was used through self-reported questionnaires. BMI was calculated as weight in kilograms divided by height in meters squared. The World Health Organization (WHO) Asia Pacific BMI cutoff point of <25.0 kg/m2 or ≥25.0 kg/m2 was used to define obesity [15].
Hypertension and diabetes were identified as risk factors in the selfreported questionnaire based on the diagnosis provided by doctors. Dyslipidemia was defined by the levels of total cholesterol (≥240 mg/dL), high-density lipoprotein cholesterol (<40 mg/dL), triglycerides (≥200 mg/dL), and low-density lipoprotein cholesterol (≥160 mg/dL) according to the National Cholesterol Education Program-Adult Treatment Panel III guidelines [16] and based on whether the participants indicated that they were taking medications to lower their cholesterol levels in the self-reported questionnaire.
Strength exercises included arm-pushing, sit-ups, and use of dumbbells, weights, and barbells; the subjects were divided into two groups according to the frequency of performance of these exercises: ≥2 times/wk or <2 times/wk. For aerobic exercises, the subjects were divided into two groups according to whether the weekly moderate-intensity aerobic physical activity duration was >150 minutes.
According to the smoking status, the subjects were classified into three groups: non-smoker, ex-smoker, or current smoker. Participants smoking daily or occasionally were defined as current smokers. Those who answered that they smoked in the past but do not currently smoke were defined as ex-smokers, while the remaining participants were defined as non-smokers. According to the frequency of alcohol consumption, the subjects were divided into three groups: no consumption, ≤1 time/wk, or >1 time/wk.
4. Statistical Analysis
For the baseline characteristics analysis, data were expressed as numbers and percentages. The chi-square test was used to compare the frequency in each group with knee OA and to identify the risk factors associated with knee OA (Table 1). The chi-square test and binominal logistic regression were used for the univariate and multivariate analyses, respectively, and to evaluate the odds ratio (OR) for measuring the association between the risk factors and knee OA (Table 2). Binominal logistic regression analyses were conducted, adjusting for age, sex, BMI, hypertension, diabetes, dyslipidemia, household income, educational level, and lifestyle habits, including smoking, alcohol consumption, frequency of strength exercise, and aerobic exercise. For the subjects in the 2013 KNHANES to represent the entire Korean population, we applied sampling weights to take the complex sampling method into account. All tests were two-tailed, and a P-value of <0.05 was interpreted as significant. The data collected were collated and analyzed using the IBM SPSS ver. 20.0 for Windows (IBM Corp., Armonk, NY, USA).

Baseline characteristics of the study population according to the presence of knee osteoarthritis
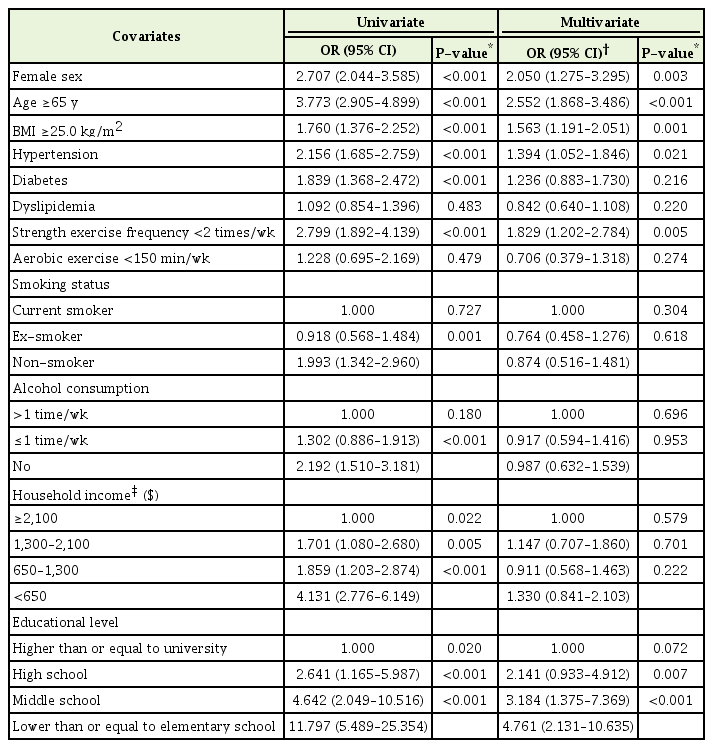
Relationship between risk factors and knee osteoarthritis
RESULTS
1. Baseline Characteristics
The mean age of the 2,280 subjects in this study was 62.6 years, and 1,295 participants (56.8%) were women. Of the 2,280 participants, 296 (13%) had knee OA, and 1,984 (87%) had no knee OA (Table 1). Old age (≥65 years), female sex, obesity (BMI ≥25.0 kg/m2), hypertension, diabetes, and low frequency of strength exercise were more common in the participants who were diagnosed with knee OA than in those who were not (P<0.001). Smokers and drinkers were further divided into three subgroups. In each subgroup, the proportion of participants in each group of non-smokers and non-drinkers was higher in the group with knee OA than in the group without (P<0.001). The proportion of participants who were diagnosed with knee OA gradually increased as the household income decreased and educational level became low (P<0.001). However, aerobic exercise (P=0.479) and dyslipidemia (P=0.483) did not show a significant correlation with knee OA. Therefore, all the factors, except for dyslipidemia and aerobic exercise, were associated with knee OA (Table 1).
2. Identification of Risk Factors
The association between each risk factor and development of knee OA is presented in Table 2. Old age (>65 years; adjusted OR, 2.552; 95%; confidence interval [CI], 1.868–3.486) and low educational level (lower than or equal to elementary: OR, 4.761; 95% CI, 2.131–10.635; middle school: OR, 3.184; 95% CI, 1.375–7.369) were strongly associated with an increased risk of knee OA. The participants with female sex (OR, 2.050; 95% CI, 1.275–3.295), low frequency of strength exercise (<2 times/wk; OR, 1.829; 95% CI, 1.202–2.784), obesity (BMI ≥25.0 kg/m2; OR, 1.563; 95% CI, 1.191–2.051), and hypertension (OR, 1.394; 95% CI, 1.052–1.846) displayed a significantly higher prevalence of knee OA (P<0.05). Those with diabetes and low household income (less than or equal to middle low), non-smokers, and non-drinkers displayed a higher prevalence of knee OA in the univariate analysis. However, diabetes, low household income, non smokers, non drinker was removed in the logistic regression analysis using the backward elimination method because the P-value was >0.10 (Table 2).
DISCUSSION
We compared the prevalence of knee OA among groups after setting subgroups based on the risk factors for knee OA known from previous studies in men and women aged over 50 years who participated in the 2013 KNHANES. This study suggests that the following risk factors increase the risk of knee OA: old age (≥65 years), female sex, obesity (BMI ≥25.0 kg/m2), hypertension, low frequency of strength exercise (<2 times/wk), and low educational level (lower than or equal to middle school). This study confirmed that the risk factors revealed in previous studies were the same as those revealed in our study on the Korean population [7,10,17-22].
Although, household income has been identified as a risk factor in previous studies [22] and is associated with weight gain [23], it was not found to be a risk factor for knee OA in this study. Therefore, further research in this aspect is needed. Both the diabetic and non-diabetic groups did not show any difference in the prevalence of knee OA. Although dyslipidemia is associated with overweight and obesity, it was not a risk factor for knee OA [16,21]. Smokers had a lower risk than did non-smokers, which may also be related to the effect of non-smoking on weight gain [18,23]. Less physical activity was associated with weight gain [23]. However, less aerobic exercise was not associated with knee OA in this study. Alcohol consumption was associated with hand OA [24]. Although hand OA is a risk factor for knee OA [20], there is still a lack of research on the relationship between knee OA and alcohol consumption.
This study has some limitations. First, since this study was a crosssectional study, it was difficult to elucidate a causal relationship between knee OA and the risk factors. Second, although there remains a controversy regarding the knee OA classification system, specialists have agreed that knee OA diagnosis should be based on radiologic features, and the WHO has adopted the K-L grade as a standard criterion [12,25]. Third, patients with vitamin D deficiency and low quality of life are known to be at an increased risk of knee OA [10,26]. However, such patients were not included in this study, and comparisons could not be made with previous studies.
Some strengths of this study include the fact that it employed radiologic imaging in the analysis of a large patient data sample representing the Korean population; further, the health survey, examination, and radiographic readings were performed systematically by trained experts. Conversely, several previous studies are limited in that they used hospital data in limited patient pools, which may have increased their susceptibility to selection bias.
In conclusion, the analysis of the associations between knee OA and risk factors in Koreans aged ≥50 years using nationally representative data of the 2013 KNHANES revealed that old age (≥65 years), female sex, obesity (BMI ≥25.0 kg/m2), hypertension, low frequency of strength exercise (<2 times/wk), and low educational level (lower than or equal to middle school) were the risk factors for knee OA.
Notes
No potential conflict of interest relevant to this article was reported.