Association between Cigarette Smoking and Sarcopenia according to Obesity in the Middle-Aged and Elderly Korean Population: The Korea National Health and Nutrition Examination Survey (2008–2011)
Article information

Abstract
Background
The definition of sarcopenia focuses on muscle mass and function. Sarcopenic obesity is the relative excess of fat tissue with decreased muscle mass. We examined the association between cigarette smoking and sarcopenia according to obesity in middle-aged and elderly Koreans.
Methods
We conducted a cross-sectional study of 9,385 subjects (age ≥50 years) based on data from the fourth and fifth Korea National Health and Nutrition Examination Surveys (2008–2011). Smoking groups were categorized by smoking status and the number of cigarettes smoked daily. Sarcopenia was defined as weight-adjusted appendicular skeletal muscle mass of 2 standard deviations below the sex-specific mean for young adults. Obesity was defined as fat mass ≥30% for men and ≥40% for women. Subjects were categorized into three groups: sarcopenic obese (SO), sarcopenic non-obese (SNO), and normal. Multiple logistic regression analysis was performed to assess the association between smoking and SNO and SO.
Results
Among men, current smokers were more associated with SNO than never-smokers (adjusted odds ratio [OR], 3.34; 95% confidence interval [CI], 1.09–10.26). However, there was no significant association between smoking status and SNO in women or SO in either sex. Among current smokers, moderate smokers (11–20 cigarettes/d) were more likely to be SNO (adjusted OR, 5.81; 95% CI, 1.12–30.31) and heavy smokers (>20 cigarettes/d) were more likely to be SO (adjusted OR, 9.53; 95% CI, 1.65–55.01) than light smokers (<11 cigarettes/d).
Conclusion
In men, smoking was positively associated with SNO, and heavy smokers were more likely to be SO than light smokers.
INTRODUCTION
With the rapid growth of an aging population, increased attention is being paid to age-related public health issues. Aging involves major changes in body composition, such as an increase in visceral fat and progressive loss of skeletal muscle mass. Rosenberg [1] first proposed the term ‘sarcopenia’ to refer to the decline in muscle mass and function associated with aging. Sarcopenia increases the risk of falls and fractures, loss of independence, mobility disorders, and mortality [2]. Furthermore, previous studies have suggested that sarcopenia induces insulin resistance, resulting in chronic morbidity, such as diabetes and metabolic syndrome [3]. Therefore, sarcopenia is an emerging critical health issue in the aging population. Recently, the new concept of sarcopenic obesity, defined as the combination of sarcopenia and obesity, was identified. As with sarcopenia, obesity can increase the risk of developing insulin resistance [4]. functional impairment and physical disability in older persons [5,6]. Adipocytes induce muscle catabolism by releasing leptin and proinflammatory cytokines. These factors activate a vicious cycle, with worsening sarcopenia and continuous fat accumulation, resulting in physical disability [7-10]. Previous studies reported that subjects with sarcopenic obesity had a higher risk of insulin resistance and metabolic syndrome than those with obesity or sarcopenia alone [11]. A number of studies involving elderly Koreans have reported that the subjects with sarcopenic obesity had increased cardiovascular risk profiles, including hyperglycemia, hypertension, dyslipidemia, and insulin resistance [11]. Therefore, it is important to consider the combination of obesity and sarcopenia in the aging population. In view of recent trends in population aging, it is crucial, from a public health perspective, to develop strategies to prevent sarcopenic obesity. The progression of sarcopenia is a result of age-related systemic changes in the body, including hormonal changes, increased inflammatory activities, and oxidative stress [12,13]. As lifestyle factors are more reversible than age-related systemic changes, it is important to raise public awareness of their impact on the development of sarcopenia.
Studies have examined the association between cigarette smoking, which is a lifestyle factor, and sarcopenia. The Rancho Bernardo cohort study, which included 1,700 men and women between 55 and 98 years of age, identified current smoking as a reversible risk factor for sarcopenia [14]. However, based on the results of an earlier meta-analysis [15], cigarette smoking has a relatively limited impact on the development of sarcopenia. Overall, the association between smoking and sarcopenia remains controversial. Likewise, the association between cigarette smoking and obesity is complex and not completely understood. Although a previous cross-sectional study found that heavy smoking is associated with higher body weight and unfavorable metabolic changes [16], the results of earlier published studies are in conflict. There are no reports on the association between smoking and sarcopenic obesity. We divided subjects with sarcopenia into obese and non-obese groups to evaluate the association with cigarette smoking. A cross-sectional study was conducted using data from the Korea National Health and Nutrition Examination Surveys (KNHANES). We investigated the association between cigarette smoking and sarcopenic obesity in sarcopenic non-obese (SNO) and sarcopenic obese (SO) subjects.
METHODS
1. Study Subjects
This study was a cross-sectional survey using data from the fourth and fifth (2008–2011) KNHANES. The KNHANES analysis is a representative epidemiological survey of the non-institutionalized civilian population in Korea conducted by the Korean Ministry of Health and Welfare and the Korea Centers for Disease Control and Prevention. The KNHANES is conducted periodically to evaluate the health and nutritional status of the Korean population and consists of three main surveys conducted by trained interviewers: a health interview, a health examination, and a nutritional survey. The data collected in the health interview included sociodemographic characteristics, age, sex, physical activity measurements, smoking habits, alcohol consumption, and medical history. The health examination included anthropometric measurements (including height and weight). Daily energy and nutrient intake were assessed in the nutritional survey using the 24-hour recall method. We assessed the following variables: educational level (elementary school or less, middle school or more); body mass index (BMI) calculated as weight (kg)/height (m)2 ; chronic diseases diagnosed by a physician (hypertension, hyperlipidemia, stroke, myocardial infarction, angina pectoris, arthritis, pulmonary tuberculosis, asthma, chronic obstructive pulmonary diseases, diabetes mellitus, cancer, depressive disorder, thyroid disease, liver cirrhosis, and renal failure); alcohol consumption (≤1 drink/d, >1 drink/d); physical activity (≥150 min/wk of moderate-intensity and/or ≥75 min/wk of vigorous-intensity aerobic physical activity (≥150 min/wk of moderate-intensity and/or ≥75 min/wk of vigorous-intensity aerobic physical activity, <150 min/wk of moderate-intensity or <75 min/wk of vigorousintensity aerobic physical activity) [17]. The following dietary intake components were assessed: total energy (kcal/d), protein (g/d), fat (g/ d), and carbohydrate (g/d) intake. Of the subjects who participated in all three surveys, 9,385 participants (4,019 men and 5,366 women) aged 50 years or older were included after excluding 9,473 subjects (4,053 men and 5,420 women) owing to incomplete or missing data. The KNHANES was reviewed and approved by the Institutional Review Board of the Korea Center for Disease Control and Prevention (2008-04EXP-01-C, 2009-01CON-03-2C, 2010-02CON-21-C, 2011-02CON-06-C).
2. Smoking Behavior
The information regarding smoking behavior was collected using a standardized self-report health examination questionnaire. The data indicated smoking status as current, former, or never-smokers and included the number of cigarettes smoked by current smokers, expressed as number of cigarettes per day. Current smokers were divided into heavy smokers (>20 cigarettes/d), moderate smokers (11–20 cigarettes/d), and light smokers (<11 cigarettes/d).
3. Definition of Sarcopenic Obesity
Dual-energy X-ray absorptiometry (Discovery-W; Hologic Inc., Waltham, MA, USA) was used to measure body composition. Appendicular skeletal muscle mass (ASM) was calculated as the sum of skeletal muscle mass for the arms and legs, based on the assumption that all fat-free and bone-free tissue is skeletal muscle, as described by Heymsfield et al. [18] Sarcopenia has been described in the literature according to the following parameters: (1) ASM divided by height squared (kg/m2), as proposed by Baumgartner et al. [19], and (2) ASM divided by body weight (%), as proposed by Janssen et al. [20]. Sarcopenia has been defined as muscle mass levels over 2 standard deviations below the sex-specific mean for a young reference group (healthy men and women aged 20–39 years) [19]. The reference group was selected among participants aged 20–39 years, excluding those who had a history of diabetes, stroke, coronary artery disease, thyroid disease, arthritis, tuberculosis, asthma, renal disease, liver cirrhosis, or cancer (any type). In this study, we used the body weight-adjusted ASM method proposed by Janssen et al. [20] to define sarcopenia. We defined obesity as fat mass >30% in male subjects and >40% in female subjects, according to Dufour et al. [21]. All subjects were categorized into one of three groups according to these definitions: SO, SNO, or normal group.
4. Statistical Analysis
Data acquired from the fourth and fifth (2008–2011) KNHANES were merged into a single data set and analyzed. The results were weighted to represent the Korean population, using weights calculated to account for the complex samples design, non-response rate, and poststratification. The general characteristics of the never-smokers, former smokers, and current smokers were compared using one-way analysis of variance for continuous variables or the χ2 test for categorical variables. All categorical data are presented as percentage (standard error) and continuous data are presented as mean±standard error. Multiple logistic regression analysis adjusted for potential confounders, including age, sex, educational level, recommended level of exercise, BMI, alcohol consumption, chronic diseases, daily total energy intake, hormone use (only in women), and oral contraceptive use (only in women), was performed to assess data. In view of the multicollinearity among total energy intake (kcal/d), protein intake (g/d), fat intake (g/ d), and carbohydrate intake (g/d), in the multiple regression analysis, we considered only the daily total energy intake among all the components of dietary intake. We calculated the odds ratio (OR) and 95% confidence interval (CI) of SO and SNO groups, respectively, according to smoking status and amount. All statistical analyses were conducted using IBM SPSS Statistics ver. 23.0 (IBM Corp., Armonk, NY, USA) and P-values <0.05 were considered statistically significant.
RESULTS
1. General Characteristics
The prevalence of SO individuals among male and female participants was 3.88% and 5.96%, respectively, and the prevalence of SNO individuals was 2.02% and 1.21%, respectively. General characteristics of the 9,385 subjects according to smoking status are shown in Table 1. The frequencies of never-smokers, former smokers, and current smokers were 16.6%, 50.1%, and 33.3% in men, and 91.6%, 4.0%, and 4.4% in women. The mean ASM of never-smokers, former smokers, and current smokers was, respectively, 21,401, 20,976, and 20,823 g among men, and 13,988, 13,519, and 13,564 g among women. The mean age of never-smokers, former smokers, and current smokers was, respectively, 61.0, 62.8, and 59.2 years among men, and 62.7, 68.8, and 64.2 years among women. The participants were classified into groups based on sarcopenia and obese status as follows: normal (3,533 men and 4,450 women), SO (156 men and 320 women), and SNO (81 men and 65 women). Statistically significant differences were observed between smoking status and ASM, age, BMI, alcohol consumption, and daily total energy intake in men and between smoking status and ASM, age, BMI, education, number of chronic disease, alcohol consumption, recommended level of exercise, daily total energy intake, daily protein intake, and daily carbohydrate intake in women.
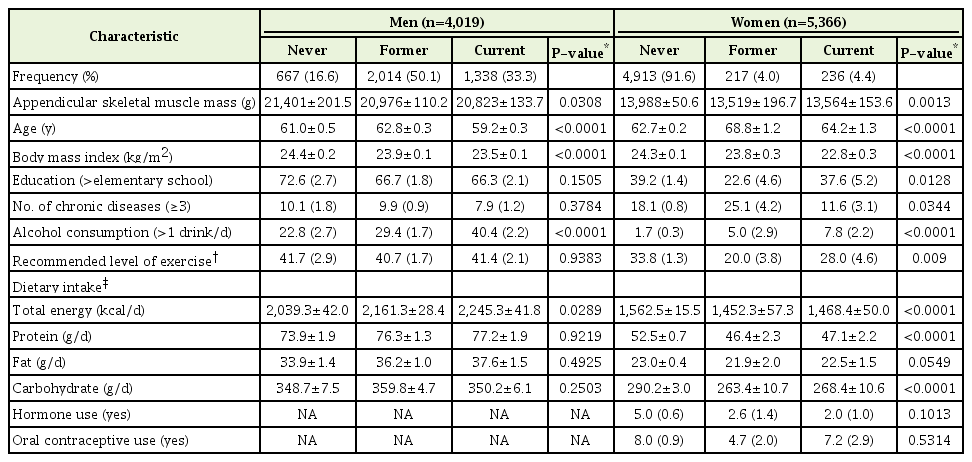
General characteristics of subjects according to smoking status
2. Smoking Status
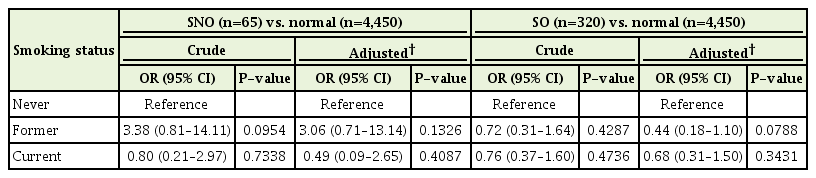
The risk of being SNO and SO according to smoking status, compared with never-smokers in men and women, is presented in Tables 2 and 3, respectively. In men, multiple logistic regression analysis revealed that current smokers were significantly more likely to be SNO than neversmokers (OR, 3.34; 95% CI, 1.09–10.26) after adjusting for age, BMI, education, number of chronic diseases, alcohol consumption, recommended level of exercise, and daily total energy intake. However, no significant association was found between smoking status and SNO in women or SO in either sex.

3. Smoking Amount
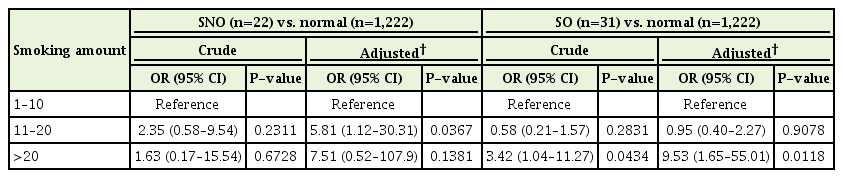
The risk of being SNO and SO according to daily smoking amount in current smokers (men), with 1–10 cigarettes/d as the reference, is presented in Table 4. After adjusting for confounding factors (age, BMI, education, number of chronic diseases, alcohol consumption, recommended level of exercise, and daily total energy intake), moderate smokers (11–20 cigarettes/d) were statistically significantly more likely to be SNO (OR, 5.81; 95% CI, 1.12–30.31) than light smokers (<11 cigarettes/d). In addition, heavy smokers (>20 cigarettes/d) were more likely to be SO than light smokers in both the crude (OR, 3.42; 95% CI, 1.04–11.27) and adjusted model (OR, 9.53; 95% CI, 1.65–55.01). These results were statistically significant. It was not possible to perform multiple logistic regression analysis among women owing to the limited number of female current smokers and because, among these, there were few SNO or SO women.
DISCUSSION
Based on the KNHANES data, we aimed to examine the association between cigarette smoking and sarcopenia in non-obese and obese middle-aged and elderly Koreans. Among male subjects, a positive correlation between current smoking and sarcopenia in obese subjects was identified after adjusting for the confounders. These results suggest that smoking significantly increases the risk of sarcopenia in non-obese men. However, no significant association between smoking status and sarcopenia was found in non-obese women. It can be assumed that smoking has a lesser impact on muscle mass in women than in men. It is also possible that confounding variables were not adequately adjusted for in the female subjects. The mechanisms leading to sex-related differences in muscle mass reduction with aging are not known, although hormonal factors have been thought to play a role until recently. Previous studies examined the influence of sex on skeletal muscle mass and strength. Gallagher et al. [22] measured ASM using dual-energy X-ray absorptiometry in 148 women and 136 men aged 20–90 years, and after adjusting for height, body weight, and age, found that men presented larger age-related decreases in ASM than women (14.8% versus 10.8%). In addition, several sex-related differences in muscle quality with aging have been suggested in a number of cross-sectional studies. In a recent study, Frontera et al. [23] examined whole muscle strength and muscle cross-sectional area of the knee extensors, which were significantly higher in older men than in older women. Moreover, type I and IIA fibers from older men were stronger than those from older women, even after adjusting for size. In our study, sarcopenia was measured only using skeletal muscle mass, and muscle function was not assessed. In view of the greater reduction in skeletal muscle mass in men and the reduction in muscle function in women with aging, sex differences in our study may have occurred. Additionally, the present study shows that the accuracy of female smoking rates as reported by self-report was very low [24]. This discrepancy can be attributed to social desirability bias and the social condemnation of female smoking. Therefore, the relationship between smoking and sarcopenia in women may not be clearly explained owing to the presence of hidden female smokers.
Cigarette smoking is a well-established independent risk factor for cardiovascular disease [25] and is also associated with an increased risk of insulin resistance and the metabolic syndrome [26], which are known to be associated with increased abdominal fat deposition [12,19]. Several studies have identified cigarette smoking as a risk factor for sarcopenia [14,27]. However, in our study, no significant association with sarcopenic obesity according to smoking status was found in either sex. It can be postulated that various internal and external factors, as well as smoking, have an impact on the development of obesity.
In current smokers, we can estimate a causal association between smoking amount and sarcopenia. In men, the ORs for being SNO tended to increase with the number of daily cigarettes smoked, albeit this was statistically insignificant in heavy smokers. Moreover, moderate smokers were more likely to be SNO and heavy smokers were more likely to be SO than light smokers. Therefore, we can estimate a positive association between smoking amount and being SNO and SO, respectively, which may suggest a causal association in male current smokers.
This study has several limitations. First, muscle function could not be assessed. The definition of sarcopenia suggested by European Working Group on Sarcopenia in Older People considers both muscle mass and function [2]. However, we did not use this definition because data regarding muscle function were not available. Further evaluation of muscle function will be required in future studies. Second, the information on smoking status and smoking amount was obtained from participant recall, and recall bias is a possibility. Third, owing to the cross-sectional study design, no cause-effect association could be identified. Fourth, selection bias may exist as participant data may have differed from the data of subjects excluded for missing or incomplete data. Fifth, despite attempts to adjust for confounding factors, the impact of other potential confounders such as stress, sleep, mood, and passive smoking cannot be completely excluded [28,29].
The primary strengths of our study include the use of the large KNHANES dataset, which is representative of the entire Korean population. The KNHANES collected extensive data regarding potential confounders and involved a large sample size, allowing increased accuracy. Furthermore, the KNHANES included community-dwelling individuals, and cachexia was excluded as a potential factor for muscle loss by excluding patients with critical comorbidities or those who were bedridden most of the day. Furthermore, direct standardization was performed to calculate the prevalence of SO and SNO individuals in the elderly population. Owing to the large proportion of young persons, subjects with a history of disease potentially affecting muscle mass could be excluded for calculating cutoff values.
In conclusion, this study found that current smokers are more likely to be SNO than never-smokers in men. Additionally, moderate smokers are more likely to be SNO and heavy smokers are more likely to be SO than light smokers. A cause-and-effect relationship between smoking and sarcopenia could not be definitively identified owing to the cross-sectional design of the study. However, compared with the results of earlier studies in which a negative correlation between smoking and sarcopenia was identified, and still remain questionable, this study can support that a positive correlation between cigarette smoking and sarcopenia. Understanding the risk factors, including cigarette smoking, and developing strategies for prevention of sarcopenia in non-obese and obese individuals is crucial. Further research on the association between smoking and sarcopenic obesity is required.
Notes
No potential conflict of interest relevant to this article was reported.