Association between Alcohol Consumption and Metabolic Syndrome Determined by Facial Flushing in Korean Women
Article information

Abstract
Background
This study aimed to examine the relationship between alcohol consumption and metabolic syndrome in Korean women as determined by facial flushing.
Methods
Of the female patients aged <65 years who visited the health promotion center at Chungnam National University Hospital from January 2016 to March 2017, 1,344 women were included. After adjusting for confounding factors such as age, body mass index, smoking, exercise, and menopausal status, multiple logistic regression analysis was performed to assess the association between alcohol consumption and the risk of metabolic syndrome in the facial flushing and non-facial flushing groups compared with the non-drinkers.
Results
Even after adjusting for confounding factors, the risk of metabolic syndrome was significantly high in all drinking subgroups (≤2 standard drinks: odds ratio [OR], 1.68; 95% confidence interval [CI], 1.10–2.68; 2<, ≤4 standard drinks: OR, 2.48; 95% CI, 1.29–4.74; and >4 standard drinks: OR, 4.16; 95% CI, 2.03–8.30) of the facial flushing group. The risk of metabolic syndrome was significantly high only in the subgroup of weekly alcohol consumption >4 standard drinks (OR, 2.20; 95% CI, 1.07–4.52) in the non-facial flushing group.
Conclusion
This study suggests that Korean women experiencing facial flushing when drinking have a higher risk of developing metabolic syndrome even with a low weekly drinking amount than those who do not experience face flushing.
INTRODUCTION
Drinking-related facial flushing occurs when blood flow to the face increases temporarily after alcohol consumption, with the expansion of facial blood vessels [1]. In Korean gatherings offering alcoholic drinks, facial flushing in alcohol consumers is caused mainly by the accumulation of acetaldehyde and is related to alcohol metabolism in the body [2]. Some Asians, including Koreans, have the genetic variant of the ALDH2 gene that produces inactive aldehyde dehydrogenase (ALDH) 2, which is related to reduced alcohol metabolism; these Asians experience a higher incidence of facial flushing than those who do not have this genetic variation [3]. The differences in the metabolism of aldehyde result in differences in alcohol metabolism in individuals during alcohol consumption [4].
Metabolic syndrome is characterized by insulin resistance, high blood pressure, abdominal obesity, and dyslipidemia [5], and is it an important risk factor in cardiovascular disorders and type 2 diabetes [6]. The relationship between metabolic syndrome and alcohol consumption indicates that light and moderate levels of alcohol consumption increase the serum level of high-density lipoprotein cholesterol (HDLC) and restrict blood clotting and grouping of platelets, resulting in protective effects from cardiovascular diseases and reducing the risk of metabolic syndrome [7]. However, heavy drinking increases blood pressure and neutral fat, which are components of metabolic syndrome, and ultimately increases the risk of metabolic syndrome [8].
Despite the same levels of alcohol intake, the levels of blood alcohol concentration in women are higher than those in men. This is because women have higher body fat percentage, lower water ratio, and lower alcohol dehydrogenase (ADH) activity within the stomach than do men, ultimately resulting in lower alcohol metabolism [9]. Previous studies have reported that moderate drinkers have a lower likelihood of developing metabolic syndrome than heavy drinkers; however, when compared to non-drinkers, the risk of metabolic syndrome in moderate drinkers is diverse [10]. In one study, it was found that Korean men with facial flushing during drinking had a high risk of developing metabolic syndrome [11]. According to one study in Japan, a significantly low odds ratio (OR) for metabolic syndrome was reported for light female drinkers [12]. Therefore, it can be concluded that the risk of metabolic syndrome among women with and those without facial flushing would differ despite the same level of alcohol consumption.
There is a rising trend of alcohol consumption among women in Korea. According to the 2015 Korea National Health and Nutrition Examination Survey conducted by the Ministry of Health and Welfare, the monthly rate of alcohol consumption was 46.5%, with 5.8% engaging in high-risk alcohol consumption; the monthly rate of excessive drinking, where subjects had more than 5 drinks in one sitting at least once a month in the last year, was 23.2%, increasing consistently over the last decade [13].
While studies are being published consistently on metabolic syndrome and relevant factors such as lifestyle habits, including exercise and diet, there is a lack of research on alcohol consumption levels and metabolic syndrome in Korean women who drink and experience facial flushing. Therefore, this study aims to examine the risk of metabolic syndrome according to levels of alcohol consumption in Korean women with and without facial flushing.
METHODS
1. Study Subjects
This study recruited 1,546 women aged less than 65 years who underwent a general health checkup at Chungnam National University Hospital between January 2016 and March 2017; women with missing medical records or surveys on history of illness (high blood pressure, diabetes, and dyslipidemia), drinking, smoking, exercise, or menopause were excluded. Of the 1,546 women, 202 who were diagnosed with high blood pressure, diabetes, and dyslipidemia or those undergoing drug treatment were excluded (Figure 1); finally, 1,344 healthy adult women were included in the study. This study was performed in compliance with the Declaration of Helsinki and was approved waiver of informed consent by the Ethics Committee of Chungnam National University Hospital (IRB approval no., 2017-11-003).
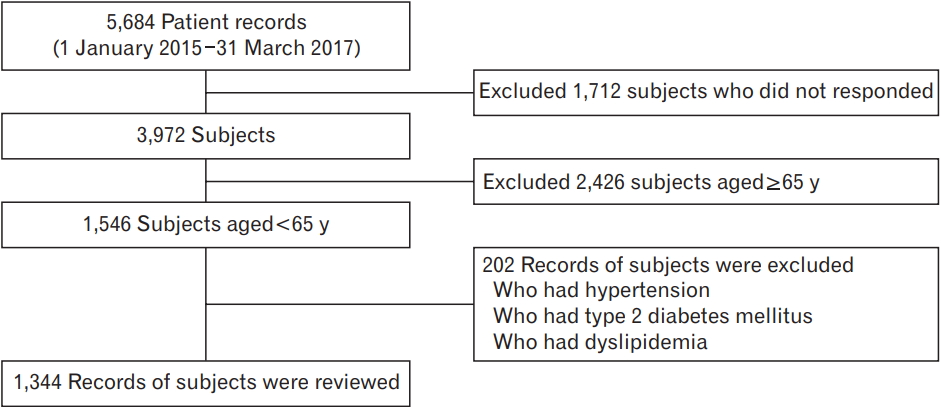
Flow chart of inclusion of subjects.
2. Data Collection
This study utilized a pre-diagnosis questionnaire and interview records with doctors to determine the amount of alcohol intake, presence of facial flushing while drinking, smoking habits, exercise frequency, and history of illness.
The amount of alcohol intake was based on the standards of the National Institute on Alcohol Abuse and Alcoholism (NIAAA), where one standard drink unit was 14 g of pure alcohol; this standard drink unit was calculated to be 1/4th bottle of soju at 20% (90 mL), a small bottle of beer (355 mL), one bowl of makgeolli (300 mL), and one glass of wine (150 mL) or hard liquor (45 mL) [14]. The weekly volume of alcohol intake was calculated by multiplying the number of drinking occasions by the number of drinks on each occasion. The NIAAA states that the appropriate level of drinking for women is 7 or fewer drinks per week. The 2015 Korean guidelines for moderate drinking recommends 4 or fewer drinks per week for non-flushers and 2 or fewer drinks for flushers [15]. This study referenced the Korean guidelines and classified the drinkers into 3 groups: 2 or fewer standard drinks per week, 2<, ≤4 drinks, and over 4 drinks.
The response to facial flushing could be “yes” or “no.” Those reporting “yes” were classified as flushers, and those reporting “no,” as nonflushers [16].
Smokers were classified as non-smokers, ex-smokers, and currentsmokers. Ex-smokers had smoked in the past but did not smoke at the time of the interview for least one month. Ex- and current smokers were asked to indicate the number of cigarettes (in terms of packs) and the period of smoking (years).
On the basis of exercise frequency, participants were categorized into the non-exercise group, regular exercise group (moderate-intensity exercise 3 times or more a week for 30 minutes or longer per session), and irregular exercise group (did not meet the criteria for regular exercise).
Weight was measured on a 0.01 kg scale with the participants wearing only the diagnosis coat, and height was measured on a 0.1 cm scale using an automatic extensometer. Body mass index (BMI) was calculated by dividing the weight (kg) by height (m) squared, i.e., kg/m2. Waist circumference was measured on a 0.1-cm scale by maintaining the measuring instrument parallel to the floor from the iliac crest in the resting end-tidal position. Blood pressure was measured using an automatic blood pressure machine after maintaining more than 10 minutes of rest and was measured with the participants sitting down with the upper arms placed at the level of the heart.
For blood examination, samples of venous blood were collected after 12 hours of fasting. Through detailed tests, serum levels of indicators such as triglyceride (TG), total cholesterol (TC), HDLC, low-density cholesterol (LDLC), fasting plasma glucose (FPG), alanine aminotransferase (AST), aspartate aminotransferase (ALT), and gamma glutamyl transferase (GGT) were measured.
The classification of metabolic syndrome was based on the National Cholesterol Education Program–Adult Treatment Panel III [17] and utilized the diagnostic standards of the American Heart Association/National Heart, Lung, and Blood Institute [18] of 2005. The cut-off point for waist circumference was based on the Korean standards set by the Korean Society for the Study of Obesity in 2014 [19]. In light of the above guidelines, metabolic syndrome was confirmed when three or more of the following five conditions were met by the women—(1) waist circumference ≥85 cm; (2) TG ≥150 mg/dL; (3) HDLC <50 mg/dL; (4) FPG ≥100 mg/dL; and (5) systolic blood pressure ≥130 mm Hg or diastolic blood pressure ≥85 mm Hg.
3. Data Analysis
The participants were divided into three groups: non-drinkers, flushers, and non-flushers. The characteristics of each group were analyzed using t-tests and chi-square tests. T-tests were used for continuous variables such as age, BMI, waist circumference, blood pressure, and blood chemistry profile. Chi-square tests were used for categorical variables such as metabolic syndrome, exercise, smoking, occupation, and menopausal status. The alcohol consumption characteristics of the flushers and non-flushers were compared using t-tests.
Next, the subjects were divided into four subgroups: non-drinking and three drinking subgroups (2 or fewer standard drinks, 2<, ≤4 drinks, and over 4 drinks per week). Logistic regression analysis was used to evaluate the risk of metabolic syndrome for non-drinkers, flushers, and non-flushers by adjusting for confounding variables of age, BMI, smoking, exercise, and menopause. Chi-square tests were also used to analyze P-value for trends (Figure 2). Statistical analyses were carried out using IBM SPSS ver. 24.0 (IBM Corp., Armonk, NY, USA) and statistical significance was set at a P-value of 0.05.
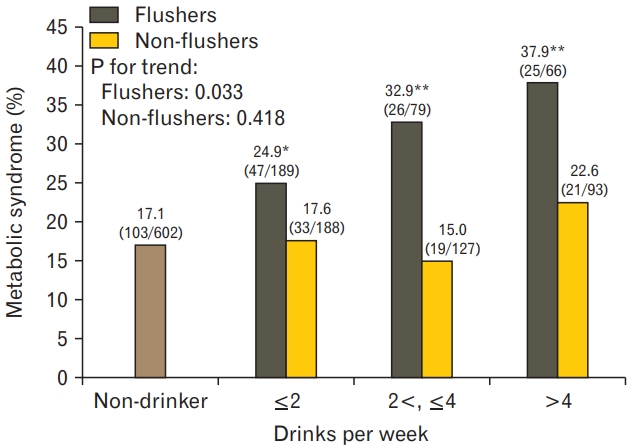
Prevalence of metabolic syndrome according to weekly drinking amount in flushers and non-flushers. *P<0.05, **P<0.01, and ***P<0.001 (by using chisquare test as compared with non-drinkers).
RESULTS
1. General and Alcohol Consumption-Related Characteristics of the Study Subjects
Among the 1,344 participants, 602 were non-drinkers (44.8%), 334 were flushers (24.9%), and 408 were non-flushers (30.3%).
On comparing the general characteristics of the flushers and non-flushers with those of the non-drinkers, the mean±standard deviation age of both the flushers (47.46±9.3 years, P<0.001) and non-flushers (46.52±10.2 years, P<0.001) was significantly lower than that of the non-drinkers (50.87±9.7 years). The BMI (P=0.007), waist circumference (P=0.004), and diastolic blood pressure (P=0.001) of the flushers were significantly higher than those of the non-drinkers. There was no significant difference in systolic blood pressure between the three groups.
Among the blood indicators, HDLC and GGT levels were significantly higher in both the flushers and non-flushers than in non-drinkers. TG (P<0.001) and FPG (P<0.001 were significantly higher only in the flushers than in the non-drinkers. There were no significant differences in TC, LDLC, AST, and ALT levels between the non-drinkers, flushers, and non-flushers.
Regarding the drinking habits of the flushers and non-flushers, the number of drinks on one occasion was significantly (P=0.008) lower for the flushers (2.43±1.7) than for the non-flushers (2.73±1.8). The maximum number of drinks on one occasion was significantly (P<0.001) higher for the non-flushers (5.12±3.4) than for flushers (4.08±3.0). However, there was no significant difference (P=0.642) between the flushers (1.47±0.9) and non-flushers (1.51±0.9) in the average number of drinks per week and the weekly frequency of drinking (P=0.508; 4.14±5.5 and 4.48±5.4, respectively) (Table 1).
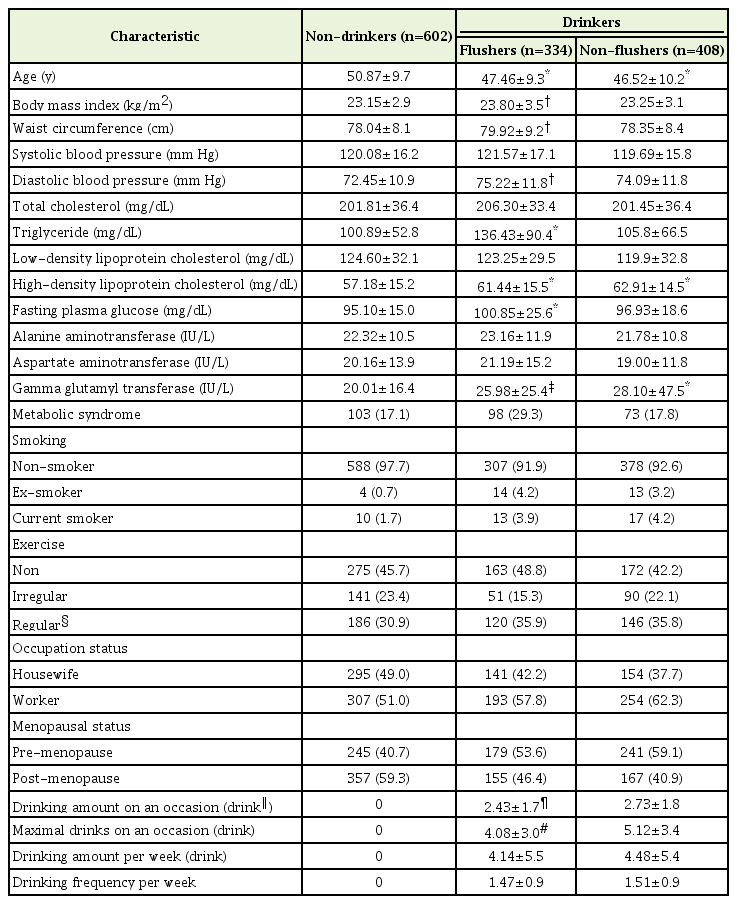
Characteristics of participants
2. Weekly Drinking Amount and Metabolic Syndrome according to the Presence of Facial Flushing
The prevalence of metabolic syndrome in the non-drinker group was 17.1% (103/602). In the flusher group, it was 24.9% (P=0.018) for the ≤2 drinks per week, 32.9% (P=0.001) for 2<, ≤4 drinks group, and 37.9% (P<0.001) for >4 drinks subgroup, with a higher prevalence of metabolic syndrome for all subgroups than for non-drinkers; higher volume of alcohol consumption was related to higher prevalence of metabolic syndrome (P for trend=0.033). On the other hand, the prevalence of metabolic syndrome between the non-flushers and nondrinkers was not significantly different (Figure 2).
3. Weekly Drinking Amount and Risk of Metabolic Syndrome Depending on the Presence of Facial Flushing
Regardless of their flushing response, the OR was 2.86 (95% CI, 1.67–4.87; P<0.001) for the over 4 drinks subgroup after adjusting for the confounding variables of age, BMI, smoking, exercise, and menopause.
In the non-flusher group, the OR after adjustment was 2.20 (95% CI, 1.07–4.52; P=0.031) for the >4 drinks subgroups. In the flusher group, the OR after adjustment was 1.68 (95% CI, 1.10–2.68; P=0.026) for the ≤2 drinks subgroup, 2.48 (95% CI, 1.29–4.74; P=0.006) for the 2<, ≤4 drinks subgroup, and 4.11 (95% CI, 2.03–8.30; P<0.001) for the >4 drinks subgroup (Table 2).
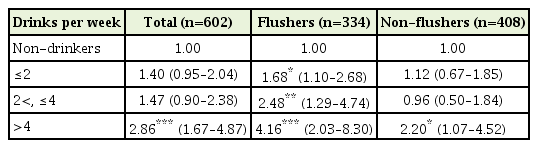
Odds ratio of metabolic syndrome by alcohol consumption in non-flushers and flushers by multivariate analysis
4. Logistic Regression Analysis between Weekly Alcohol Consumption according to the Presence of Facial Flushing and Components of Metabolic Syndrome
The risk of abdominal obesity increased significantly only for the flusher groups who had over 2 drinks (2<, ≤4 drinks: OR, 2.84; >4 drinks: OR, 3.34) compared to the non-drinkers. The risk of hypertriglyceridemia increased significantly for the flusher groups who had 2 or more drinks (≤2 drinks: OR, 2.89, 2<, ≤4 drinks: OR, 2.42; >4 drinks: OR, 4.79) compared to the non-drinkers; the OR for hypertriglyceridemia significantly increased for the non-flushers who consumed 2 or fewer drinks compared to non-drinkers (OR, 1.64).
The relationship between drinking and low HDLC levels showed an OR of 0.48 in the flusher group having 2<, ≤4 drinks, which was significantly lower than that for the non-drinkers. On the other hand, the OR of low-HDL cholesterolemia for the non-flusher group was significantly lower at all drinking levels (≤2 drinks: OR, 0.50; 2<, ≤4 drinks: OR, 0.41; >4 drinks: OR, 0.32) than for the non-drinkers.
The risk of higher fasting blood glucose was higher for the flusher groups who had over 2 drinks (2<, ≤4 drinks: OR, 2.51; >4 drinks: OR, 3.07) than for the non-drinkers, and tended to increase with alcohol consumption. In the non-flusher group, the OR for the group with over 4 drinks was 2.25, which was significantly higher than that for nondrinkers.
The risk of high blood pressure was analyzed using systolic and diastolic blood pressure; the risk of high diastolic blood pressure was significantly higher with ORs of 2.36 and 4.54 for the flusher subgroups of ≤2 drinks and >4 drinks, respectively, than that for the non-drinker group. In the non-flusher group, the risk of higher diastolic blood pressure was higher for the over 2 drinks subgroups (2<, ≤4 drinks: OR, 3.40; >4 drinks: OR, 3.45) than for the non-drinkers. There was no significant relationship between alcohol consumption and the risk of high systolic blood pressure (Table 3).
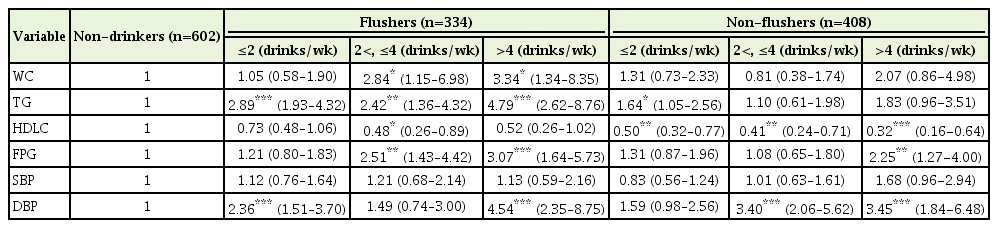
Odds ratios for metabolic syndrome components according to alcohol consumption
DISCUSSION
This study investigated the relationship between facial flushing, weekly alcohol consumption, and metabolic syndrome in women aged below 65 years.
In this study, the drinking amount per occasion and maximum alcohol consumption per occasion was lower among the flushers than the non-flushers. Once consumed, alcohol is broken down to acetaldehyde by ADH and is metabolized into acetate through ALDH. ALDH2, which is an ALDH isoenzyme, when present in the inactive form is unable to metabolize acetaldehyde in the alcohol metabolism process [20,21]. This leads to the bodily accumulation of acetaldehyde, leading to symptoms such as facial flushing, nausea, and headache [22,23]. These effects lead to fewer drinking occasions and lesser volumes of alcohol consumed among flushers than non-flushers [24].
In this study, regardless of the flushing response, there was no significant difference in the risk of metabolic syndrome between the subgroups drinking 4 or fewer drinks and the non-drinkers; the risk of metabolic syndrome increased significantly in the subgroup of over 4 drinks. According to previous studies, excessive drinkers tended to have higher risk of metabolic syndrome than non-drinkers or moderate drinkers. One study indicated that there was no significant difference in the risk of metabolic syndrome between non-drinkers and drinkers, both adult men and women, consuming 30 g or less alcohol per day; the risk of metabolic syndrome tended to increase with the increasing number of drinks and increased significantly in the excessive drinking group consuming over 30 g of alcohol per day [25]. Lee et al. [8] reported no difference in the risk of metabolic syndrome between non-drinkers and groups drinking less than 40 g per day; however, they found that the risk of metabolic syndrome increased for excessive drinkers. Another study involving Japanese adult men and women indicated that the group consuming less than 22 g per day had the lowest risk of metabolic syndrome, and there was a significant increase only in men when they consumed 44 g or more per day compared to the non-drinkers [12].
In this study, the relationship between facial flushing according to weekly drinking amount and metabolic syndrome indicated that the flushers, in all subgroups, faced a significant risk of metabolic syndrome compared to non-drinkers. A study on the Korean population, based on the 1998 Korea National Health and Nutrition Examination Survey, indicated that the group drinking less than 15 g per day had a lower risk of metabolic syndrome than the non-drinkers, and the risk of metabolic syndrome increased with increasing alcohol consumption, but showed no clear rising trend [26]. A recent study on Korean men showed the risk of metabolic syndrome increased with alcohol consumption of more than 16 drinks per week in non-flushers. However, in the flushers, the risk of metabolic syndrome was significantly high with over four drinks per week [27].
In the non-flusher group, consumption of over four drinks led to a significant increase in the risk of metabolic syndrome. However, the flushers had a higher risk of metabolic syndrome even if they engaged in moderate drinking, and the risk increased with increasing weekly alcohol consumption.
Additional studies are needed to determine the appropriate level of drinking for women with facial flushing. Moreover, there were differences in the level of weekly alcohol consumption with a higher risk of metabolic syndrome in the flushers than in the non-flushers. These results are in line with those of previous studies that reported differences in appropriate levels of alcohol consumption for flushers and non-flushers [28]. Moreover, they are also in line with the 2015 Korean guidelines for moderate drinking [18], which recommend 4 or fewer drinks per week for non-flushers and 2 or fewer drinks for flushers.
The limitations of this study are as follows: First, this study is a crosssectional study, making it difficult to deduce the causal relationship between facial flushing and the prevalence of metabolic syndrome. Second, this study focused on women visiting the general checkup center of one university hospital over a predefined period of time, which limits the generalization of the results to the entire Korean female population. Third, the sample size was small, limiting the generalization of the results. Fourth, very few participants consumed more than 7 drinks per week, which made it impossible to evaluate the previous NIAAA standard of over 7 drinks.
Despite these limitations, this study appears to be meaningful as it indicates that the correlation between the amount of alcohol consumption and risk of metabolic syndrome differs depending on the presence of facial flushing in Korean adult women. According to the results above, women aged less than 65 years who engage in drinking may face increased risk of metabolic syndrome if they exceed 4 drinks per week, regardless of facial flushing. However, flushers have a higher risk of metabolic syndrome than non-flushers even if their weekly alcohol consumption is low, and the risk increases with alcohol consumption levels. Therefore, it is important to focus on the presence of facial flushing along with alcohol consumption levels when treating female drinkers.
Notes
CONFLICT OF INTEREST
No potential conflict of interest relevant to this article was reported.