Impact of Visceral Obesity on the Risk of Incident Metabolic Syndrome in Metabolically Healthy Normal Weight and Overweight Groups: A Longitudinal Cohort Study in Korea
Article information

Abstract
Background
Although both obesity, measured by body mass index, and visceral obesity are known to be major risk factors of metabolic syndrome and its components, there have been debates on the relative contribution of general obesity and visceral obesity to the development of metabolic syndrome.
Methods
We performed a large longitudinal cohort study of 3,093 subjects (age range, 18–65 years) who were metabolically healthy and had a normal weight who received health screenings over a 3-year follow-up period. Cox proportional hazards models were used to estimate the adjusted hazard ratios (HRs) and 95% confidence intervals (CI) for incident metabolic syndrome and its components per sex-specific 1-standard deviation (SD) increase in visceral adipose tissue (VAT) and body mass index.
Results
Both obesity and visceral obesity increased the risk of incident metabolic syndrome, but when HR was compared per sex-specific 1-SD, visceral obesity appeared to confer more risk than simple obesity. The HR for 1-SD of body mass index was 1.19 (95% CI, 1.07–1.32; P=0.001) in men and 1.29 (95% CI, 1.10–1.52; P=0.002) in women, while the HR for 1-SD of VAT was 1.29 (95% CI, 1.15–1.44; P<0.001) in men and 1.50 (95% CI, 1.28–1.75; P<0.001) in women.
Conclusion
Visceral obesity and obesity were longitudinally associated with an increased risk of incident metabolic syndrome among metabolically healthy adults, and visceral fat accumulation appears to be better predictor of metabolic syndrome.
INTRODUCTION
Metabolic syndrome (MS) is defined by a constellation of interconnected physiological, biochemical, clinical, and metabolic factors that directly increase the risk of cardiovascular disease, type 2 diabetes mellitus, and all-cause mortality [1,2]. Obesity is the central and causal component of this syndrome; however, the mechanistic role of obesity has not yet been fully elucidated [3]. In particular, abdominal obesity is associated with insulin resistance, which in turn leads to hyperglycemia, hypertension, dyslipidemia, and other metabolic abnormalities [4,5]. Considering the importance of visceral fat, an accurate assessment of visceral fat mass is very important, and computed tomography (CT) at the level of the lumbar spine is a useful method for assessment.
Obese individuals may not be at high risk for metabolic complications as a result of their obesity; this phenotype can be defined as metabolically healthy obesity (MHO) [6]. Despite having excessive body fat, people who are metabolically healthy but obese have favorable metabolic profiles, characterized by remarkably high insulin sensitivity, no signs of hypertension, and normal lipids, inflammation, and hormonal profiles (low triglyceride [TG] and C-reactive protein concentrations and high high-density lipoprotein [HDL] cholesterol and adiponectin concentrations) [7].
Although MHO was initially regarded as a stable condition, it has become clear that MHO status is transient. Indeed, several follow-up studies of healthy adults showed that the MHO state is unstable and may lead to metabolic problems over time. However, the factors associated with the subsequent conversion from MHO to metabolic unhealthy obesity (MUO) remain largely unknown [8]. Previous studies have shown that higher body mass index (BMI), waist circumference (WC), and insulin resistance measured by the Homeostatic Model Assessment–Insulin Resistance were associated with the conversion. Despite this, only a few studies have investigated the impact of visceral obesity (VO), which is one of the key players in metabolic derangement, on the conversion of MHO to MUO.
Several studies have been conducted to assess the relationship between visceral adipose tissue (VAT) and MS. In a 10-year longitudinal study of Japanese Americans by Hwang et al., [8] metabolic disease occurred in two-thirds of the MHO group and was associated with fasting insulin and low HDL levels. Sandeep et al. [9] reported that VAT was associated with MS. Furthermore, Pickhardt et al. [10] concluded that VAT was the best predictor of MS in women, while visceral fat area (VFA) was a poorer predictor in men among the American population. Among these studies, only a few have specifically targeted Korean individuals [11,12]. The study by Park et al. [13] was conducted to investigate the relationship of VAT, as assessed by abdominal fat CT, with MS, especially in asymptomatic Korean individuals; the findings of this study demonstrated that VAT accumulation was positively associated with MS and cardiovascular risk factors.
Regarding individual components of MS, VAT was positively associated with new-onset hypertension only, and showed no association with the incidence of diabetes, low HDL, or hypertriglyceridemia in the Framingham Offspring Study [14]. In the present study, both systolic blood pressure (SBP) and diastolic blood pressure (DBP) were slightly positively associated with weight compared to VO. In contrast, VO was associated with high fasting blood sugar levels, high TG, and low HDL in other studies [15]. A Korean follow-up study also showed that a higher visceral associated index in the MHO group was associated with conversion to the obese group with metabolic disease [16].
There has been no long-term longitudinal study on the effect of VO measured by CT on the conversion of MHO to MUO. In this study, we aimed to investigate the effect of VAT on the conversion from MHO to MUO by comparing the incidence of MS according to various status of VO and general obesity.
METHODS
1. Study Subjects
The study participants were a part of an ongoing cohort study that has been described in detail elsewhere [17]. Briefly, the initial cohort for this study consisted of 11,931 subjects, ranging in age from 18 to 65 years, who had completed a comprehensive health check-up, including abdominal fat CT and laboratory exams, from March 2005 to December 2010 at Seoul National University Hospital Healthcare System Gangnam Center. For this analysis, we excluded participants with any MS components, history of malignancy or cardiovascular disease, thyroid disease, fasting blood glucose ≥100 mg/dL, currently using blood glucose-lowering agents, blood pressure (BP) ≥130/85 mm Hg, currently using BP-lowering agents, elevated TG levels ≥150 mg/dL, low HDL cholesterol <40 mg/dL in men or <50 mg/dL in women, and those with current use of anti-hyperlipidemics. We further excluded subjects with missing baseline data. Since some individuals met more than one criterion for exclusion, the total number of eligible subjects for the study was 3,780 at baseline. Of these 3,780 eligible participants, we enrolled subjects who had a gap of more than 1,000 days between the first and last visits. Ultimately, 3,093 subjects were enrolled in this study (Figure 1).

Flowchart of study population. HDL-C, high-density lipoprotein cholesterol; TG, triglyceride.
This study protocol conformed to the ethical guidelines of the 1975 Declaration of Helsinki (IRB no., 1707-151-872). As the researchers only accessed de-identified databases for analytical purposes, the Institutional Review Board waived the need for informed consent.
2. Data Collection
Baseline and follow-up examinations were conducted at the Seoul National University Hospital Healthcare System Gangnam Center. The study subjects were examined annually or biennially between January 2005 and December 2010.
All participants provided information on sociodemographic characteristics, previous medical diseases, medications, and lifestyle factors (e.g., cigarette smoking, alcohol drinking, and physical activity) using a standard questionnaire at baseline. Height and body weight were measured using an Inbody 720 instrument (InBody, Seoul, Korea), and BMI was calculated as weight in kilograms divided by height in meters squared. BP was measured twice in a sitting position after at least a 10-minute rest. Current smokers were defined as those who had smoked at least one cigarette per day in the past year. Ex-smokers were defined as subjects who used to smoke cigarettes regularly [18]. Regardless of the type of alcohol, current drinkers were defined as those who consumed alcohol more than once per week regularly during the past 6 months. Irrespective of the type of exercise, participants who exercised regularly during the past 6 months were categorized as performing exercise. Blood samples were obtained from an antecubital vein after more than 12 hours of fasting. The serum levels of fasting glucose, total cholesterol, TG, and HDL cholesterol were measured. All laboratory tests were conducted using standard methods. The follow-up evaluations utilized the same procedures, protocols, and laboratories.
Detailed descriptions of the methods used to measure the abdominal adipose tissue area have been published previously [19]. Briefly, a 5-mm thick umbilical level section from a 16-detector row CT scanner (Somatom Sensation 16; Siemens Medical Solutions, Forchheim, Germany) was obtained. The cross-sectional area (cm2) of abdominal fat was calculated using Rapidia 2.8 CT software (INFINITT, Seoul, Korea) by setting the attenuation values for a region of interest within a range of -250 to -50 Hounsfield units. The VAT area was defined as intraabdominal fat bound by the parietal peritoneum or transversalis fascia, and the subcutaneous adipose tissue area was calculated by subtracting the VAT area from the total adipose tissue area.
3. Definitions
We used modified definitions outlined in the National Cholesterol Education Program Adult Treatment Panel III (NCEP-ATP III) guidelines to define a metabolically healthy state [20]. The WC criterion was not used because of its collinearity with BMI and VO. Specifically, individuals who had no evidence of the following four criteria were considered metabolically healthy: (1) fasting TG ≥150 mg/dL or drug treatment for elevated TG; (2) HDL cholesterol <40 mg/dL in men and less than 50 mg/dL in women, or drug treatment for low HDL cholesterol; (3) BP ≥130/85 mm Hg or taking antihypertensive medication; and (4) fasting glucose ≥100 mg/dL or taking antidiabetic medication.
We defined the overweight/obesity phenotype as a BMI ≥23 kg/m2 and normal weight as a BMI <23 kg/m2, according to the Asia‐specific BMI criteria determined by the World Health Organization Western Pacific Region [21]. We defined VO as a VAT equal or higher than 100 cm2 in men and 70 cm2 according to the recommendation of the Korean Society for Studies on Obesity [22].
Accordingly, metabolically healthy subjects were categorized into four groups: metabolically healthy normal weight (MHNW)-normal visceral fat (NVF): BMI <23 kg/m2 and VAT <100 cm2 (men) or <70 cm2 (women); MHNW-VO: BMI <23 kg/m2 and VAT ≥100 cm2 (men) or ≥70 cm2 (women); metabolically healthy overweight (MHOW)-NVF: BMI ≥23 kg/m2 and VAT <100 cm2 (men) or <70 cm2 (women); MHOW-VO: BMI ≥23 kg/m2 and VAT ≥100 cm2 (men) or ≥70 cm2 (women).
4. Statistical Analysis
The outcome of this study was the incidence of MS as defined as the development of two or more components of the NCEP-ATP III criteria during follow-up. The baseline characteristics of the participants according to BMI and VO status were compared using analysis of variance and Pearson’s chi-square tests. Continuous variables were presented as means±standard deviations (SD) of normally distributed variables. All categorical variables were presented as numbers and proportions.
Cox proportional hazards models were used to analyze the adjusted hazard ratios (HRs) and 95% confidence intervals (CI) for incident MS, the individual components of MS per sex-specific 1-SD increase in the VAT and BMI, and for each group according to BMI and VO with the MHNW-NVF group as the reference. Multivariate models were adjusted for age, sex, smoking status, exercise status, alcohol intake, SBP, TG, and fasting blood glucose.
Statistical analyses were conducted using STATA ver. 13.0 (STATA Corp., College Station, TX, USA) software. Statistical significance was defined by two-tailed P-values <0.05.
RESULTS
1. General Characteristics of the Study Population
The baseline characteristics of the participants according to their BMI and VO status are shown in Table 1. Overall, the mean age±SD was 47.14±7.58 years, the MHNW group included 60.85% of the participants (n=1,882), while the MHOW group included 39.15% (n=1,211). Among the metabolically healthy participants, 15.16% (n=469) developed incident MS during the follow-up.
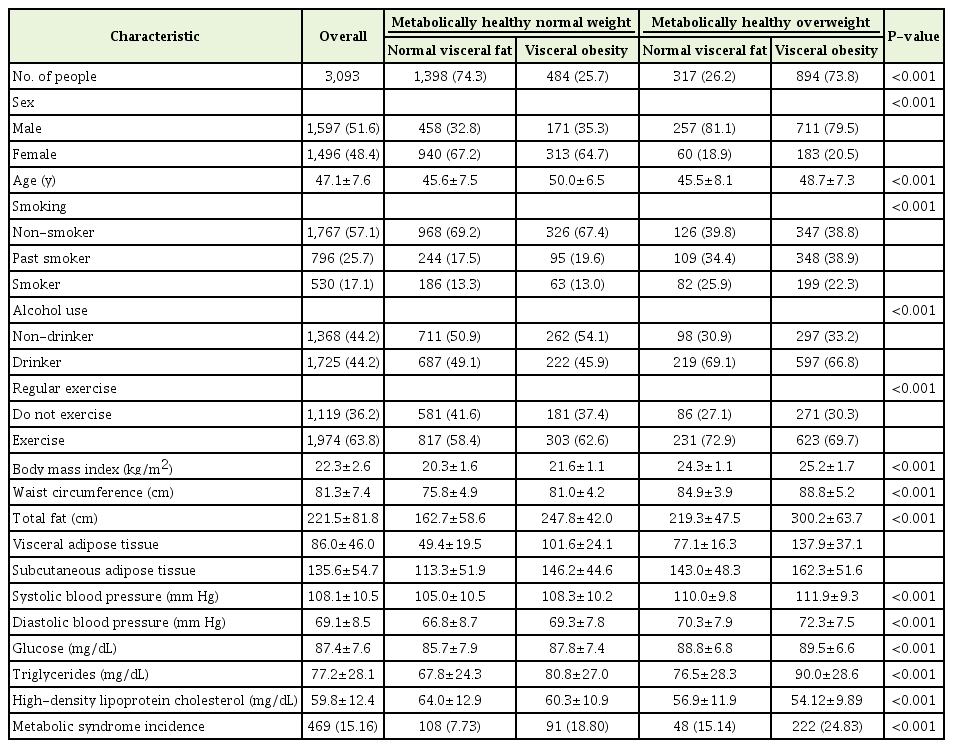
Descriptive characteristics of metabolically healthy overweight participants (follow-up days ≥1,000)
Comparisons of baseline characteristics revealed that most of the clinical variables, including male, smoking, alcohol intake, and exercise were associated with the MHOW group. The means of the BMI, VAT, BP, TG, and the fasting glucose were significantly higher in the MHOW group than in the MHNW group, with the exception of HDL cholesterol. In both the MHNW and MHOW groups, subjects with VO had a higher BMI, BP, TG, and FBG fasting glucose, and lower HDL cholesterol than those with NVF.
2. Visceral Obesity Status and Incident Metabolic Syndrome
Table 2 shows the HRs (95% CIs) for incidence of MS according to baseline BMI and VO status. As shown in Table 2, the HR of VO was positive and statistically significant; therefore, there is a positive association between VO and the incidence of MS. In the age and sex-adjusted model (model 1), the HRs were 2.44 (95% CI, 1.83–3.24; P<0.05) for the VO in the MHNW group, and 1.69 (95% CI, 1.18–2.42; P<0.05) and 2.79 (95% CI, 2.16–3.59; P<0.05) for the NVF and VO in the MHOW group, respectively.
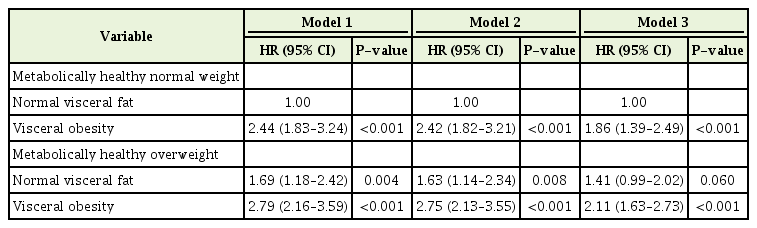
HRs (95% CIs) of incident metabolic syndrome according to body mass index and visceral obesity status
The results remained significant after adjusting for lifestyle (smoking, exercise, and alcohol consumption: model 2). The HRs were 2.42 (95% CI, 1.82–3.21; P<0.05) for VO in the MHNW group, and 1.63 (95% CI, 1.14–2.34; P<0.05) and 2.75 (95% CI, 2.13–3.55; P<0.05) for NVF and VO in the MHOW group, respectively. These associations were similar after adjusting for SBP, total cholesterol, and fasting glucose level. The HRs were 1.86 (95% CI, 1.39–2.49; P<0.05) for the VO in the MHOW group, and 1.41 (95% CI, 0.99–2.02; P=0.06) and 2.11 (95% CI, 1.63–2.73; P<0.05) for the NVF and VO in the MHOW group, respectively. Kaplan-Meier curves of the risk of MS according to BMI and VO status are shown in Figure 2.

Kaplan-Meier curve of MS incidence (model 3: adjusted for age, exercise, smoking, alcohol consumption, systolic blood pressure, total cholesterol, and fasting glucose). MS, metabolic syndrome; MHNW, metabolically healthy normal weight; MHOW, metabolically healthy overweight; NVF, normal visceral fat; VO, visceral obesity.
3. Visceral Obesity and the Individual Components of Metabolic Syndrome
The adjusted HRs for MS components according to BMI and VO in all participants for the models adjusted for age, sex, and lifestyle (model 2), and in addition to other factors (model 3) are shown in Table 3 (Appendix 1, model 2).

HRs (95% CIs) of the metabolic syndrome component in model 3
The adjusted HRs (model 2) of the MHOW group with VO for MS components were significantly higher than those of the MHNW with NVF group. The HRs for high BP were 1.53 (95% CI, 1.16–2.01; P<0.05) for VO in the MHNW group, and 1.68 (95% CI, 1.24–2.28; P<0.05) and 2.11 (95% CI, 1.69–2.66; P<0.05) for NVF and VO in the MHOW group, respectively. The HRs for high fasting glucose were 1.51 (95% CI, 1.20–1.89; P<0.05) for VO in the MHNW group, and 1.39 (95% CI, 1.08–1.80; P<0.05) and 1.67 (95% CI, 1.38–2.02; P<0.05) for NVF and VO in the MHOW group, respectively. The HRs for high TG were 2.65 (95% CI, 2.02–3.48; P<0.05) for VO in the MHNW group, and 1.25 (95% CI, 0.85–1.83; P=0.246) and 2.27 (95% CI, 1.75–2.94; P<0.05) for NVF and VO in the MHOW group, respectively. The HRs for low HDL cholesterol were 1.95 (95% CI, 1.43–2.67; P<0.05) for VO in the MHNW group, and 1.35 (95% CI, 0.81–2.25; P=0.255) and 2.31 (95% CI, 1.69–3.17; P<0.05) for NVF and VO in the MHOW group, respectively.
Compared to the MHNW-NVF group, the MHOW-VO group had a significantly elevated risk for each component of MS in model 3 (Table 3). The HRs in the MHOW-VO group were 1.54 (95% CI, 1.22–1.94) for high BP, 1.43 (95% CI, 1.18–1.74) for high fasting glucose, 1.77 (95% CI, 1.36–2.30) for high TG, and 2.56 (95% CI, 1.85–3.55) for low HDL cholesterol.
4. Incident of Metabolic Syndrome per Sex-Specific 1 Standard Deviation of Boby Mass Index and Visceral Adipose Tissue
Table 4 shows the HRs of incident MS per 1 sex-specific SD of BMI and VAT, adjusted for age, exercise, smoking, alcohol consumption, SBP, total cholesterol, and fasting glucose. In the age-adjusted model, the HRs for incident MS per 1-SD of VAT area were 1.40 (95% CI, 1.26–1.55; P<0.001) in men and 1.69 (95% CI, 1.45–2.00; P<0.001) in women, while those for BMI were 1.29 (95% CI, 1.17–1.42; P<0.001) in men and 1.50 (95% CI, 1.28–1.76; P<0.001) in women. After adjusting for age and other factors (models 2 and 3), the results were similar to those of model 1. In model 2, the HRs for incident MS were 1.28 (95% CI, 1.15–1.42; P<0.001) for men and 1.49 (95% CI, 1.27–1.75; P<0.001) for women for BMI, and 1.39 (95% CI, 1.25–1.54; P<0.001) for men and 1.68 (95% CI, 1.45–1.96; P<0.001) for women for VAT. This association persisted after adjusting for multiple risk factors, including laboratory values (BMI: HR per 1-SD, 1.19; 95% CI, 1.07–1.32; P=0.001 in men and HR per 1-SD, 1.29; 95% CI, 1.10–1.52; P=0.002 in women; VAT: HR per 1-SD, 1.29; 95% CI, 1.15–1.44; P<0.001 in men and HR per 1-SD, 1.50; 95% CI, 1.28–1.75; P<0.001 in women).

HRs (95% CIs) for metabolic syndrome per sex-specific 1-SD of BMI and VAT
DISCUSSION
In this large prospective study, VO was positively correlated with a higher incidence of MS in MHOW individuals over time compared to MHNW subjects. This observation was independent of sex, age, exercise, smoking, alcohol consumption, SBP, total cholesterol, and FBS.
Many cross-sectional and longitudinal studies have demonstrated that VAT is a risk factor for MS [14,23-25]. Previous cross-sectional studies have confirmed that individuals with excess VAT have several features of MS such as dyslipidemia, insulin resistance, high BP, and low-grade inflammation [26]. In longitudinal studies, such as the Framingham Offspring Study and MERLOT (Multimedia Educational Resources for Learning and Online Teaching) study, VAT was significantly associated with incident MS. Similarly, in the M-CHAT (Modified Checklist for Autism in Toddlers) study, longitudinal change in VAT was directly associated with MS risk independent of changes in VAT. Finally, in the MESA (Multi-Ethnic Study of Atherosclerosis) study, across BMI, a single measure of and longitudinal change in VAT predicted MS, even after accounting for weight changes. In accordance with these prospective studies, our study revealed that VO was more strongly associated with incident MS than weight. In addition, from analyzing between per sex-specific 1-SD of BMI and VAT, visceral fat is more positively correlated with a higher incidence of MS in both sexes than weight. Previously, obesity-associated MS was considered to be related to the accumulation of visceral fat, rather than subcutaneous fat or total body fat. Visceral fat and its resident macrophages produce pro-inflammatory cytokines (e.g., necrosis factor-alpha, leptin, and interleukin-6) that are implicated in chronic low-grade inflammation which can subsequently lead to MS in the obese [25,27,28].
Our study observed that VO and overweight were factors that were positively associated with the incidence of each component of MS. In the present study, both SBP and DBP were slightly positively associated with weight compared to VO. In contrast, VO was associated with high fasting blood sugar level, high TG, and low HDL in other studies [15]. However, Miazgowski et al.[29] investigated Caucasian women with an average BMI of 22.2 kg/m2, and reported that VFA was significantly correlated with HDL cholesterol and blood glucose levels, but that TG and BP were not. In addition, Nomura et al. [30] reported that dyslipidemia and high blood glucose level were associated with higher VFA, but that high BP was not. Therefore, more studies are needed to determine the association between VFA and MS components.
The strengths of this longitudinal study are the use of CT-measured abdominal adiposity, the high-quality anthropometric data that followed a systemic protocol, the inclusion of numerous metabolic variables, and the large metabolically heathy population size.
Several limitations of our study need to be considered. First, we were unable to include dietary information, which could confound the association between BMI, visceral fat, and MS. Second, our study was conducted in asymptomatic Korean men and women who completed a comprehensive health check-up; thus, our findings may not apply to other populations. Third, we were unable to consider the change in BMI and VAT.
In conclusion, our cohort study revealed that VO and overweight are longitudinally associated with an increased risk of incident MS among metabolically healthy adults, and VAT plays a key role in the development of MS. Therefore, physicians should pay more attention to VO in the context of MS, even among metabolically healthy adults.
Notes
No potential conflict of interest relevant to this article was reported.
