Analysis of the Relationship between Sleep Duration and Body Mass Index among Korean Adolescents Using Data from the 2013-2015 Korea National Health and Nutrition Examination Survey
Article information

Abstract
Background
Obesity in adolescence can continue up to adulthood and lead to various complications. There has been a continuous increase in the obesity incidence among adolescents, which is an emerging social issue. Studies have reported that decreased sleep duration in adolescents can have negative effects on health, leading to obesity. Therefore, in the present study, we aimed to investigate the relationship between sleep duration and body mass index among South Korean middle and high school students aged 12–18 years.
Methods
The participants of the Sixth National Health and Nutrition Survey conducted during 2013–2015 were screened. We selected 1,177 adolescents aged between 12 and 18 years who were enrolled in middle and high school or on leave of absence and had available data for sleep duration and body mass index (BMI) in the survey. Analyses of variance and covariance were performed after adjusting for confounding variables, including age, gender, waist circumference, and drinking experience, that showed significant correlations in univariate logistic regression.
Results
The analysis of covariance revealed that an increase in sleep duration led to a corresponding decrease in the mean BMI among all students and middle school students.
Conclusion
Significant negative correlations were confirmed between sleep duration and BMI in all students and middle school students.
INTRODUCTION
Obesity is the overaccumulation of adipose tissue in the human body. It can lead to the risk of not only major diseases such as hypertension, diabetes, cardiovascular diseases, respiratory symptoms, infertility, and degenerative arthritis but also negative mental and social health significantly, caused by feelings of inferiority, depression, and decreased quality of life [1,2].
Adolescent obesity has a higher probability of continuing into adulthood. The Korea Centers for Disease Control and Prevention (KCDC) reported that the prevalence of adolescence obesity has been increasing, at 9.1% in 2001, 10.1% in 2005, and 11.4% in 2012 [3]. Moreover, different from adult obesity, wherein only the size of adipose cells increases, adolescent obesity is characterized by an increase in both the size and the number of adipose cells; therefore, prevention and early management of adolescent obesity is more crucial.
Existing studies have reported that the major causes of adolescent obesity are westernized eating habits including excess calorie intake and intake of high-calorie instant food and meat; urbanization; living in a nuclear family; sedentary lifestyle; use of transportation to commute; lack of physical activity with regard to watching TV or playing video games for long hours; and other genetic, environmental, and socioeconomic causes [4-6].
Research on these risk factors with a focus on decreasing the risk of obesity is required. Particularly, there are several studies on sleep duration as a risk factor of obesity. There has been an increasing incidence of obesity among adolescents along with a decrease in the average sleep duration [7,8]. The hormonal changes resulting from sleep deprivation elevate the risk of obesity by interfering with appetite and energy metabolism [9].
Some studies have reported an inverse relationship between shorter sleep duration and increasing body mass index (BMI) [10,11]. Other studies have reported a U-shaped relationship, wherein the BMI increases when the sleep duration is either too long or too short compared with that during appropriate sleep duration [12,13].
Although several studies on sleep duration and BMI have been conducted overseas, no studies have analyzed this relationship in a Korean adolescent population.
Therefore, this study aimed to analyze the relationship between sleep duration and BMI, especially among adolescents aged 12–18 years regardless of whether they were enrolled in school or not. The adolescents were divided as middle school students, high school students, and total students. The difference in the average sleep duration between middle school students and high school students served as a basis for further dividing them into two groups.
METHODS
1. Study Participants
This study was conducted on adolescents aged 12–18 years who were either enrolled in middle or high school or were currently on leave of absence. We used data of the first period (2013), second period (2014), and third period (2015) of the sixth Korea National Health and Nutrition Examination Survey (KNHANES). The KNHANES was conducted among a nationwide sample of 22,948 individuals living in 9,491 households (in 576 districts). Data on BMI and sleep duration were collected from these participants. Our study included 1,177 adolescents (637 middle school students and 540 high school students) whose data on BMI and sleep duration were available.
The study protocol for the first and second periods of the sixth KNHANES was approved by the KCDC Institutional Review Board (first period: 2013-07CON-03-4C; second period: 2013-12EXP-03-5C). For the third period, the study was conducted without IRB approval as per the Bioethics and Safety Act article 2-1 and Enforcement Rule of Bioethics and Safety Act article 2, clause 2-1, because this study was regarded as a study conducted directly by the Korean government for the wellbeing of the people.
2. Measured Variables
1) Sleep duration
In KNHANES, the question regarding the length of sleep duration was “In average, how many hours of sleep do you get each night?” and the answers were used as the data for sleep duration. The answers on sleep duration were divided and classified into the following categories: <7 hours, 7–8 hours, 8–<9 hours, and ≥9 hours. The answers were categorized by reference to the appropriate sleep duration of 7–8 hours reported in the 1965 Alameda County study [14].
2) Sociodemographic and health-related behavioral variables
For sociodemographic and health-related behavioral variables, the students’ school year (if enrolled), gender, economic status, residence, smoking, drinking experience, depressive feelings lasting over 2 weeks, suicidal ideation from the past year, waist circumference, sitting hour, energy level, and intake of carbohydrates, proteins, and lipids were evaluated. The students were classified as middle school and high school students depending on their school year, and based on their economic status, they were classified as four categories according to the household income level: upper class, upper middle class, lower middle class, and lower class. Smoking, drinking experience, depressive feelings lasting over 2 weeks, suicidal ideation from the past year (yes, no, not applicable, or no answer) and hours spent sitting were self-reported. The residence of each individual was classified as urban or rural according to the address on the file (demarcated as dong, eup, or myun). Measurements of waist circumference were conducted by investigators who completed the training course and were monitored in the same way. The day prior to the questionnaire survey, the intake of calories (kcal), carbohydrates (g), proteins (g), and lipids (g) was calculated using a dietary record, which was obtained by the 24-hour recall method.
3) Obesity status
Referring to the average growth chart of Korea children/adolescents (2007) [15], the weight and height of adolescent individuals were given a percentile value according to the gender, age, and BMI (kg/m2). Individuals on the 85th–95th percentiles or with a BMI >23 and <25 were classified as overweight, whereas those >95th percentiles or with a BMI >25 were classified as obese.
4) Physical examination: body measurements
The variables that fall under the body measurement category were determined using data from physical examinations. Physical examinations were conducted by researchers who had completed the necessary training for these examinations. The examinee had to take their clothes off and wear a gown for physical examination. The examination was conducted using internationally recognized physical examination equipment.
3. Analysis Methods
Statistical analysis was conducted using IBM SPSS ver. 21.0 (IBM Corp., Armonk, NY, USA); the significance level was set at P<0.05. To define the common characteristics of the study participants, descriptive statistics were used to compute the average of continuous variable, frequency, and percentage value of categorical variables according to the categories. To elucidate the relationship between sleep duration and BMI z-score, a univariate logistic regression analysis was conducted to determine the relationship between each variable and the obesity status. After setting the variables showing a significant relationship in the univariate logistic regression as control variables, analysis of variance (ANOVA) and analysis of covariance (ANCOVA) were conducted.
RESULTS
1. General Characteristics of Study Participants
Table 1 shows the characteristics of the included adolescents aged 12–18 years either enrolled in middle or high school or not enrolled in any school. There were a total of 1,177 study participants, including 637 middle school students and 540 high school students, with an average age of 13.62±0.96 and 16.52±0.93 years, respectively. The gender ratio was 349 boys (54.8%) and 288 girls (45.2%) among the middle school students, and 263 boys (48.7%) and 277 girls (51.3%) among the high school students.
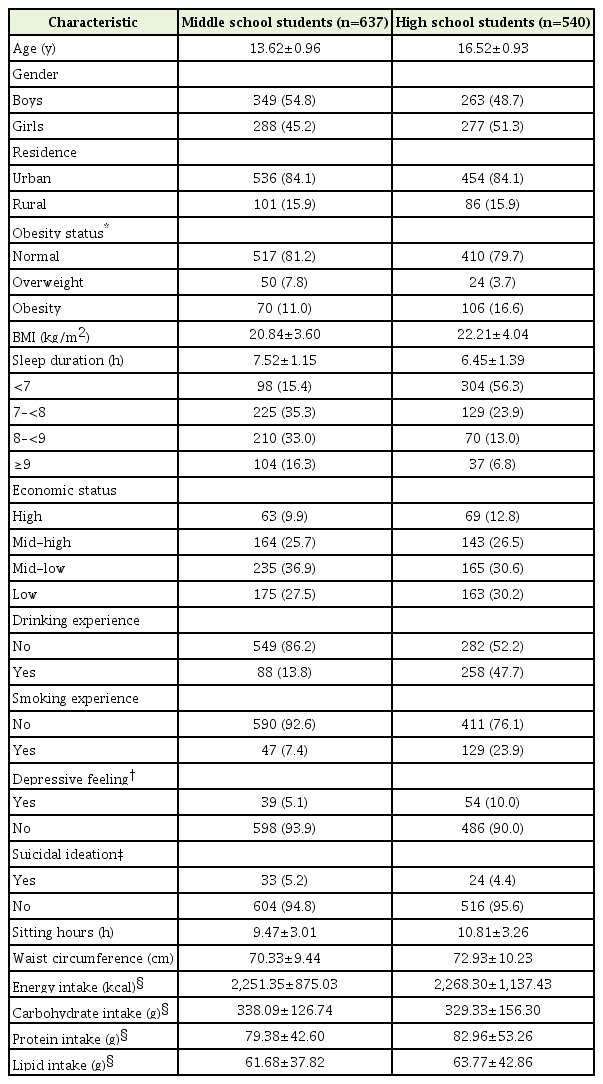
Baseline characteristics of the included subjects
With regard to obesity status, there were 70 obese (11.0%), 50 overweight (7.8%), and 517 normal (81.2%) students in the middle school age group and 106 obese (16.6%), 24 overweight (3.7%), and 410 normal (79.7%) students in the high school age group.
The average sleep duration per day was 7.52±1.15 hours in the middle school age group and 6.45±1.39 hours in the high school age group, and the waist circumference was 70.33±9.44 cm and 72.93±10.23 cm, respectively. On the day before the questionnaire survey, the total energy intake (kcal) was 2,251.35±875.03 kcal and 2,268.30±1,137.43 kcal, the carbohydrate intake (g) was 338.09±126.74 g and 329.33±156.30 g, the protein intake (g) was 79.38±42.60 g and 82.96±53.26 g, and the lipid intake (g) was 61.68±37.82 g and 63.77±42.86 g for the middle school age group and the high school age group, respectively.
2. Relationship between Sleep Duration and Obesity
1) Univariate logistic regression analysis
The factors that could influence the obesity status of an individual were analyzed using univariate logistic regression analysis, and the results are indicated in Table 2. The odds ratio (OR) according to age was 1.453 for all students and 2.356 for middle school students, indicating that the risk for obesity increased with age, which was significant (P<0.05). With regard to gender, female students had a lower risk of being obese than male students (OR, 0.332), which was significant. With regard to residence, only high school students who lived in rural areas showed less risk for obesity (OR, 0.232), which was also significant. Students with drinking experience showed an OR of 2.989 for all students, 5.271 for middle school students, and 1.227 for high school students compared with those without drinking experience, and the results were significant only in all students and middle school students. Students with smoking experience showed an OR of 3.683 for all students, 2.611 for middle school students, and 3.759 for high school students compared with those without smoking experience, and the result was significant only for all students. With regard to waist circumference, the ORs were 1.360 for all students, 1.342 for middle school students, and 1.495 for high school students, showing that the risk of obesity significantly increased with an increase in the waist circumference. With regard to energy intake values, the OR was 1.001 in all students and high school students, indicating a higher risk of obesity with increased energy intake. Similarly, the ORs were 1.005 with regard to carbohydrate intake values in the high school student group; 1.013 with regard to protein intake values for all students, 1.011 for middle school students, and 1.024 for high school students; and 1.011 with regard to lipid intake values for all students and 1.025 for high school students. This indicated that increased intakes of carbohydrates, proteins, and lipids correlated with higher risk for obesity. Other variables showed P>0.05, and thus, they did not show any significant difference.
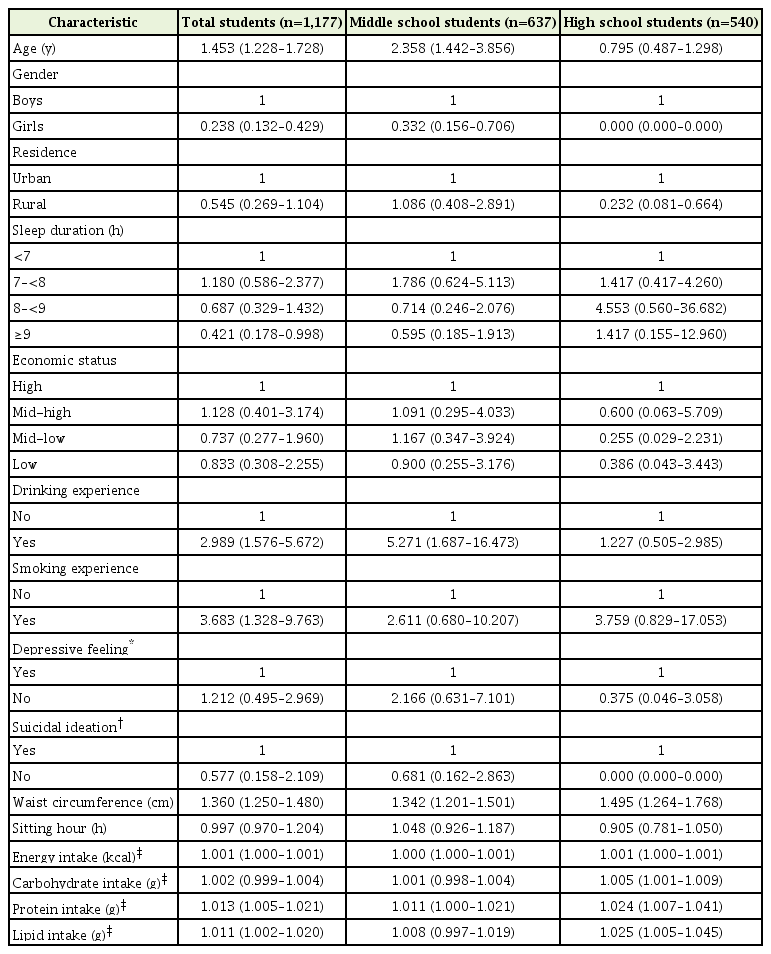
Association between obesity status and the variables among the middle and high school students
2) Analysis of variance and analysis of covariance
Table 3 shows the results of the two analyses conducted to determine the BMI z-score according to sleep duration. In Table 3, “unadjusted” indicates the results of the ANOVA, and “adjusted” indicates the results of the ANCOVA after adjusting for the variables that showed a significant correlation with obesity status in at least two age groups in the univariate logistic regression analysis. The variables included age, gender, drinking experience, waist circumference, and energy intake. Among total students, both ANOVA and ANCOVA showed that an increase in sleep duration resulted in a decrease in the BMI z-score, whereas among middle school students, an increase in sleep duration resulted in a significant decrease in the BMI z-score in ANCOVA after adjustment for the variables. In contrast, no significant differences were observed in the high school group in both ANOVA and ANCOVA.

BMI z-score estimates according to sleep duration
DISCUSSION
In this study, significant negative correlations were confirmed between sleep duration and BMI in all subjects and the middle school student group.
The World Health Organization has defined obesity as a disease, rather than a mere manifestation of a symptom, that requires treatment and proactive management [16]. Several previous studies have presented sufficient sleeping as a factor indicating good health in healthy individuals; particularly, the Alameda county study, in 1965, reported that an appropriate sleep duration of 7–8 hours is an important factor for good health [14]. This study aimed to reveal the relationship between sleep duration and obesity by analyzing the relationship between sleep duration and BMI. This relationship was assessed among 12- to 18-year-old middle/high school students or adolescents who were not enrolled in school, using the KNHANES data from 2013 to 2015.
The results of existing studies on sleep duration and BMI showed either an inverse relationship between sleep duration and BMI (i.e., the shorter the sleep duration, the greater the BMI) [11,17] or a U-shaped relationship, where the BMI increases when the sleep duration is either too long or too short [10,12]. This study also showed that BMI decreased with an increase in the sleep duration.
There are various reasons for these varying results. First, the activity of hormones and nervous system components is related to sleep duration. Decreased sleep duration increases the secretion of ghrelin, a hormone that induces increased appetite and inhibits the secretion of leptin, a hormone that inhibits appetite [9]. Further, a decrease in sleep duration leads to the activation of the sympathetic nervous system, an increased cortisol level, and decreased growth hormone secretion that breaks down lipids, thus causing an increase in BMI [18]. Second, daytime fatigue occurs because of sleep deprivation and decreased physical activity secondary to fatigue. A study conducted on children has reported that a shorter sleep duration is related to increased sitting behavior such as watching TV and decreased participation in sports [19,20]. Third, the decrease in sleep duration may cause obesity in children and adolescence at a higher rate than that in other age groups. A largescale meta-analysis conducted on 630,000 people worldwide reported that the decrease in sleep duration in children and adolescents has a greater influence on obesity than that in adults [21]. This study also compared the BMI z-score according to the range of sleep duration after dividing the participants into middle school and high school age groups. A significant decrease in z-score was observed in all students and the middle school age group; however, this significant decrease was not observed in the high school student age group, which may be attributed to the fact that the students were older.
As for the other factors, existing studies have reported that socioeconomic factors such as education level, occupation, and income levels are related to the prevalence of obesity in children and adolescents [22], but these factors were not significant. The reason for such a difference would be attributed to the fact that this study was limited to adolescents, consequently, it may have been difficult to differentiate these factors in this age group.
The strengths of this study were as follows: first, this study used data from the sixth KNHANES (2013–2015), which is well representative of the population; second, the sample size of 1,177 was relatively greater than that used in other similar studies; third, the peer group in the study was further divided into two different groups, namely, the middle school and high school age groups, by dividing the population of 12- to 18-year-old adolescents based on whether they were either enrolled in middle or high school or not enrolled in schools; and fourth, existing studies have used self-reporting methods in terms of body measurement; however, in this study, these measurements were performed by appropriately trained researchers, thus improving the accuracy of the data.
The limitations of this study were as follows: first, as a cross-sectional study, no causal relationship can be deduced, while a correlation can be shown; second, the sleep duration data from KNHANES were obtained by self-reporting methods relying on each individual’s memory; third, due to the limitations of the KNHANES questionnaire, no evaluations on sleep quality factors such as sleep onset, the number of wake-ups during sleep, daytime clarity, and sleep satisfaction were conducted.
Individual and societal economic burden caused by continued decrease in sleep duration and increased prevalence of obesity during childhood and adolescence will continue to increase. Therefore, studies based on the analysis of various relevant factors should continue to identify effective countermeasures. Additional epidemiological studies on this subject should be conducted by complimenting and improving the limitations mentioned above. We hope that the present study contributes to future studies on the prevention of childhood and adolescent obesity.
Notes
CONFLICT OF INTEREST
No potential conflict of interest relevant to this article was reported.