Prediction of Food Allergens Sensitization Based on History Taking Technique in Young Children
Article information

Abstract
Background
The diagnosis of food allergies needs to be confirmed through an oral food challenge (OFC). However, specific immunoglobulin E (sIgE) concentrations analyzed by serological tests are also helpful in determining OFC items and predicting the presence of allergic reactions. Unfortunately, there is a limit to the number of antigens that can be simultaneously evaluated at one time. The purpose of this study was to analyze the possibility of detecting sIgE antibodies against food using clues in self-reported food allergy symptoms.
Methods
Medical records of 377 patients aged 3 years or younger were collected for egg white-, cow’s milk-, walnut- and soybean-sIgE sensitization, and related clinical history. Each clinical history was classified into class 1: direct-isolated intake resulting in anaphylaxis or hives with consistent clincical history; class 2a: class 1 with inconsistency; class 2b: indirect-mixed intake resulting in anaphylaxis or hives regardless of consistency; class 2c: direct/indirect-isolated/mixed intake resulting in itching without hives, vomiting, or diarrhea with consistent clincical history; or class 3: class 2c with inconsistency or asymptomatic to direct, isolated exposure.
Results
The area under the curve (AUC) of class 1 for cow’s milk was 0.790, and the accuracy was 78.0%. The AUC of class 1 and 2 for egg white was better than that of class 1 (0.750), and the accuracy rate was 77.6%. The AUCs of class 1 for walnut and soybean were 0.775 and 0.662, respectively.
Conclusion
In conclusion, sIgE sensitization to foods could be predicted by the combination of exposure and selfreported symptoms in children under 3 years of age.
INTRODUCTION
Allergic disease diagnosis begins with a clinical history and physical examination to identify allergic symptoms associated with a relevant allergen [1]. Immunoglobulin E (IgE) antibody sensitization is then confirmed through in vivo skin tests or in vitro blood tests. If there is a mismatch between the clinical history and these primary sensitization diagnostic tests, a provocation test may be required. During oral food challenge (OFC), test administrators must be specially trained in acute allergic reaction management and OFCs should only be performed with immediate access to intensive care units [2]. Therefore, evaluating specific IgE (sIgE) sensitization is often used to help predict the outcome of the OFC before referring the patient to a well-equipped tertiary hospital.
Skin prick tests are not the preferred diagnostic tool if physicians are not well-trained allergists, and in many countries, the number of antigens that can be evaluated at one time using serologic tests is limited. Due to these limitations, physicians prefer multiple-antigen simultaneous tests for food allergy (FA) diagnosis, the results of which are semi-quantitative and often limited in predicting OFC outcomes [3]. The purpose of this study was to analyze the possibility of sIgE antibody detection using troops from self-reported food allergic symptoms.
METHODS
From May 2011 to December 2013, medical records of 377 patients (3 years old or younger) who visited the Department of Pediatrics at Ajou University Hospital were collected for the following sIgE sensitizations: egg white, cow’s milk, walnuts, and soybean (sIgE ≥0.35 kU/L, Uni- CAP; Thermo Fisher Scientific Inc., Waltham, MA, USA). Five elements of patients’ clinical history were evaluated: (1) way of exposure: direct (ingestion) or indirect (skin, inhalation); (2) type of exposure (isolated or mixed); (3) onset time (≤2 hours or >2 hours); (4) symptom characteristics (anaphylaxis, urticaria, itchiness, vomiting, or diarrhea; and (5) consistency: negative past history or positive past history with consistency or inconsistency. Each clinical history was classified into class 1: direct-isolated intake resulting in anaphylaxis or hives with consistent clinical history; class 2a: class 1 with inconsistency; class 2b: indirect-mixed intake, resulting in anaphylaxis or hives regardless of consistency; class 2c: direct/indirect-isolated/mixed intake resulting in itching without hives, vomiting, or diarrhea with consistent clincical history; or class 3: class 2c with inconsistency or being asymptomatic to direct, isolated exposure. All class 1 cases that were not isolated ingestion cases were considered vague and were reclassified as class 2. An exception was anaphylaxis due to skin contact, which was still regarded as class 1. If the symptom onset time was recorded as “next day”, these classes were also reclassified up one level, for example, class 1 history with symptom development one day after exposure was reclassified as class 2 (Figure 1). Receiver operating characteristic curves were analyzed using IBM SPSS ver. 22.0 (IBM Corp., Armonk, NY, USA). The study was approved by the Institutional Review Board of the Ajou University Medical Center (MED-KSP-12-381).
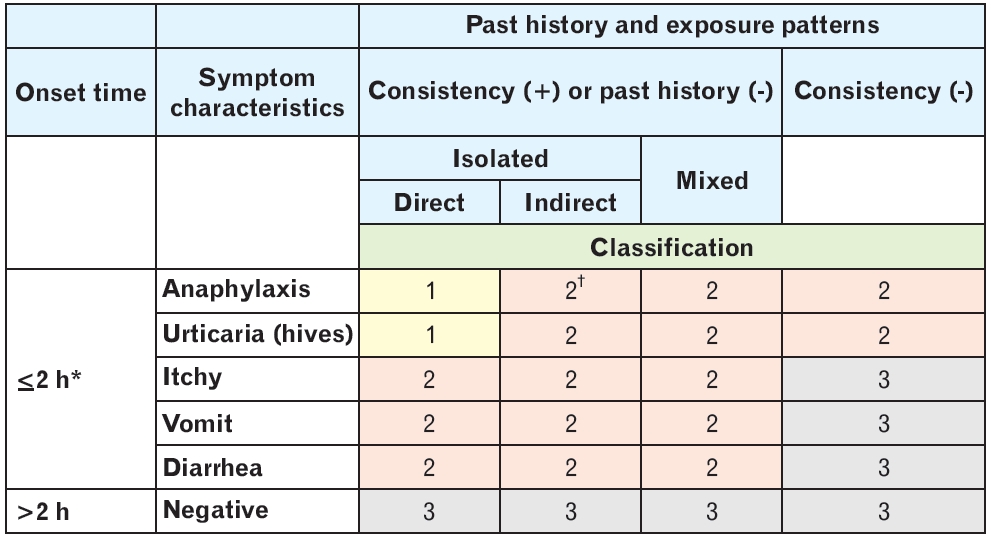
Classification according to patients’ clinical history. *Class 1 cases where symptom onset time was recorded as “next day”, were reclassified as class 2. †All cases where intake was not directly isolated were considered vague. In such cases, class 1 was reclassified as class 2, except where anaphylaxis occurred due to skin exposure.
RESULTS
A total of 116 sensitizations to egg white, 182 to cow’s milk, 17 to walnut, and 22 sensitizations to soybean were collected. In class 1 cases, the sensitization rate (i.e., sIgE-positive) was the highest for walnuts (9 of 10 [90.0%]), followed by hen’s egg white (49 of 55 [89.1%]) and cow’s milk (71 of 81 [87.7%]). However, soybean-sIgE sensitization was only found in five of the eight cases (Table 1). Meanwhile, in class 2 cases, sIgE positivity was found in only two of eight cases for soybean (25%) and 10 of 33 cases for cow’s milk (30.3%). Additionally, sIgE positivity was also high for egg whites (17 of 22 cases [77.3%]) and walnuts (2 of 3 cases [66.7%]). Egg white-sIgE demonstrated an area under the curve (AUC) of 0.717 and a positive predictive value of 89.1% in class 1 cases. When class 2 cases were included with class 1 cases in this analysis, the AUC of egg white-sIgE positivity increased to 0.750, the negative predictive value increased to 68.6% (compared with 47.5% for class 1 cases only), and the accuracy increased from 67.2% for class 1 cases to 77.6% for class 1 and 2 cases. However, for cow’s milk and walnut sIgE sensitization rates, class 1 cases were the most predictable (AUC of 0.790 and 0.775, respectively), with an accuracy rate of 78.0% and 76.5%, respectively. The soybean-sIgE sensitization rate had a lower AUC of 0.662 in class 1 cases than the other allergens (Table 2).
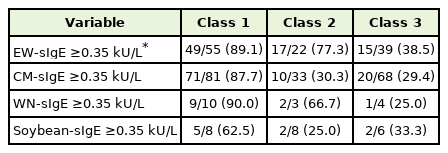
Classification-based clinical history and IgE sensitization rate of food allergens in young children
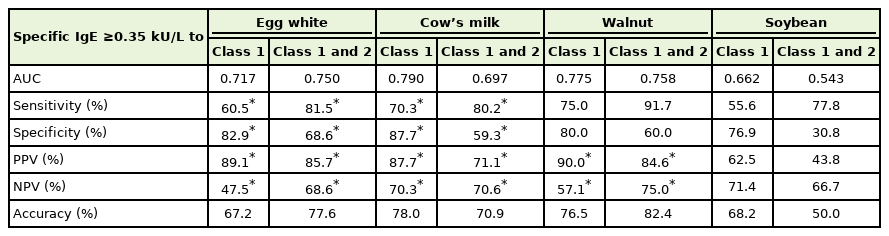
Association between classification-based clinical history and predicted IgE sensitization of food allergens in young children
DISCUSSION
FA can be highly anticipated if anaphylaxis or objective symptoms are observed more than once within a few hours after ingestion of a specific antigen [4]. Accordingly, class 1 cases were limited to patients who experienced an immediate onset of objective symptoms (anaphylaxis or hives) after isolated ingestion. This study included patients aged 3 years or below, and who often refused to perform an OFC using unfamiliar foods. Hence, the results of this study are limited to young children who do not readly undergo OFC. Therefore, the medical history technique described in this study cannot be deemed a definitive method for confirming FA. In fact, the cases in class 3 (including asymptomatic or subjective manifestations of allergens), had an sIgE positivity rate of 20%–40% (egg white, 38.5%; milk, 29.4%; walnut, 25.0%; and soybean, 33.3%) and were highly likely to tolerate specific foods. Although it appears that many patients must confirm FA through OFC, even if there is sIgE sensitization, this study provides information for primary physicians who may have limitations for the implementation of OFC. Although the clinical environment differs in each country, patients, including young children, are first evaluated by a primary physician via taking down history to see if additional evaluation for FA is necessary. Performing tests based on thorough medical history taking by primary physicians will help confirm the diagnosis of FA more accurately, helping patients with FA avoid unnecessary evaluations and dietary restrictions. The rate of sIgE sensitization in class 1 cases was high (87.7%–90.0% depending on antigen), supporting the detailed collection of important elements of a patient’s history pertaining to allergens. This study suggests that a clinical history of allergen exposure and characteristics of reactions can help determine sIgE sensitization and the necessity of further OFC testing.
Egg white, cow’s milk, and tree nuts are highly likely to be OFC positive, especially if patients have a history of adverse reactions within 5 minutes of direct exposure [5]. In infants and young children who are allergic to foods, it is rare that they would experience respiratory or gastrointestinal symptoms alone, and this study continues to support this outcome. When collecting medical history from patients for a suggested FA, physicians must record all symptoms that occur sequentially, including the type of intake, symptom development and characteristics, and previous allergic symptoms after ingestion.
This study demonstrated that the correlation between clinical symptom profile and sIgE sensitization rate is different for each food antigen, and therefore, applying appropriate history-taking techniques suggested in this study will provide additional valuation in predicting sIgE sensitization in each food. For instance, the accuracy of egg whitesIgE sensitization testing increased when interpreting both, class 1 and class 2 cases based on patient history, as it included objective cases of symptoms caused by both, direct and indirect exposures. However, the accuracy decreased in the milk-sIgE sensitization testing of class 2 cases. This may be due to subjective symptoms in young patients, such as gastrointestinal symptoms alone. As walnuts were frequently consumed in a mixed form rather than an isolated one, there was a possibility of an increase in accuracy for the walnut sIgE testing of both, class 1 and class 2 cases.
Prior to FA diagnosis, a detailed medical history could screen for potential allergens that should be investigated during IgE sensitization; however, it does depend on the type of allergen. The sIgE sensitization to egg white, cow’s milk, and walnuts can be easily predicted by history alone, but methods for increasing the predictability of each allergen are slightly different.
Notes
CONFLICT OF INTEREST
No potential conflict of interest relevant to this article was reported.