INTRODUCTION
Testosterone deficiency can reduce the quality of life due to decreased libido, impotency, infertility, fatigue, depressed mood, decreased concentration and memory, and sleep disorders in males [1]. Among patients with chronic diseases, including diabetes mellitus, hypertension, dyslipidemia, and chronic obstructive pulmonary disease, 30% also have testosterone deficiency. Moreover, unhealthy habits, such as obesity, stress, alcohol abuse, smoking, excess caffeine intake, and a lack of exercise are associated with low levels of testosterone [2]. Among these factors, it has been demonstrated that alcohol could reduce the levels of testosterone by affecting the testis and hypothalamus-pituitary-testicular axis according to in vitro and in vivo studies [3-5]. However, in human studies, alcohol abuse has various effects on reducing the testosterone level, and these effects depend on the amount and duration of alcohol intake. Chronic excessive alcohol consumption reduces testosterone levels [4-8], but some studies claim that increased alcohol intake is independent of testosterone level [9,10]. Furthermore, others indicate that alcohol intake is positively correlated with testosterone level [11,12].
Facial flushing during alcohol intake is more often observed in East-Asians, including Koreans, than among the Western populations [13]. The East-Asian population frequently possesses a variant of the aldehyde dehydrogenase 2 (ALDH2) gene, which decomposes acetaldehyde generated from alcohol during intake [14]. Inactive ALDH2 induces the accumulation of acetaldehyde in the body, which expands facial blood vessels and causes facial flushing. This inability to metabolize alcohol increases the risk of hypertension [15], metabolic syndrome [16,17], and diabetes mellitus [18,19] in Koreans.
Most previous studies have assessed the effect of alcohol on testosterone levels based on the amount of alcohol consumed; however, few studies have considered personal differences in alcohol metabolism. Koreans have personal variations in alcohol metabolism based on genetic characteristics; therefore, it is necessary to consider both the amount of alcohol consumed and metabolic efficiency when assessing the effect of alcohol on testosterone levels. In this study, to evaluate the effect of drinking alcohol on testosterone deficiency according to an individual’s alcohol metabolism, the study participants were divided into facial flushes and non-flushes, and the relationship between alcohol consumption and testosterone deficiency was analyzed.
METHODS
1. Study Participants
This study included 325 male adults whose serum total testosterone levels were measured during regular health examinations between June 2016 and December 2020 at Chungnam National University Hospital in Daejeon. Among the 325 males, some were excluded because of cancer, liver cirrhosis, chronic renal disease, thyroid diseases, and testosterone or steroid therapy. Other participants were excluded because of missing records on alcohol intake, smoking, and exercise. In total, 314 male adults were included in this study. The research protocol was approved by the institutional review board (IRB) of Chungnam Natitonal University Hospital (IRB no., 2021-07-057). Informed consent was waived as data were obtained and analyzed without patient contact.
2. Data Collection
This study was conducted using electronic medical records in a retrospective manner, and information was gathered from a questionnaire on disease history, medication history, and personal habits, such as smoking, alcohol intake, and exercise. Height and weight were measured, and body mass index (BMI) was determined by dividing the weight in kilograms by the squared height in meters.
We considered 14 g of alcohol to be a standard drink according to the criteria of the US National Institute on Alcohol Abuse and Alcoholism. One standard drink was 90 mL of 20% soju (1/4 bottle), 12 oz of beer (1 can, 355 mL), 45 mL of liquor (1 liquor drink), 150 mL of wine (one wine glass), or 300 mL of 6% makgeolli (one traditional drink). After confirming that there was no change in the amount of alcohol consumed within 1 month from the contents of the questionnaire, the amount of alcohol consumed was evaluated. Weekly alcohol intake was determined from the single alcohol intake multiplied by the number of times the participant drank per week. This weekly alcohol intake was categorized as either eight or fewer drinks (moderate drinkers) or more than eight drinks (heavy drinkers) [20]. Among alcohol drinkers, the participants were asked: “Do you experience flushing of the face immediately after drinking: always, sometimes, never, or I do not know”? If the answer was “always” or “sometimes,” never or I do not know? If the answer was “never” or “I do not know,” the participant was categorized as a non-flusher [21,22]. According to these standards, the 314 participants were divided into 78 non-drinkers, 96 flushers, and 140 non-flushers.
Smoking status was divided into current smokers (smoked within a month) and nonsmokers. Exercise was categorized into regular exercisers who performed five medium-strong exercise sessions weekly for 30 minutes or three strong exercise sessions for 20 minutes, and the rest of the participant using the standards of the US American College of Sports Medicine.
All blood tests, including total testosterone, were performed between 7–10 AM.
3. Data Analysis
The general characteristics, body measurements, and blood test results of the flushers and non-flushers were compared with those of the non-drinkers. One-way analysis of variance was used to analyze continuous variables, such as age, BMI, waist circumference, blood pressure, and testosterone levels, and the Bonferroni method was used for the post-hoc test. Additionally, we applied the chi-square test for categorical variables, such as smoking history and exercise habits. To identify the alcohol intake and flushing factors that affected total testosterone levels, we performed a multiple regression analysis with age, waist circumference, hypertension, diabetes mellitus, dyslipidemia, weekly alcohol intake, smoking history, and exercise habits as covariates. We separated the participants into five groups as follows: 78 non-drinkers, 71 flushers with ≤8 weekly standard drinks, 79 non-flushers with ≤8 weekly standard drinks, 25 flushers with >8 weekly standard drinks, and 61 non-flushers with >8 weekly standard drinks. We then used the chi-square and Bonferroni post-hoc tests to compare the prevalence of testosterone deficiency among the five groups. We defined testosterone deficiency as levels <3.5 ng/mL. We analyzed the risk of testosterone deficiency in the drinking groups (flushers and non-flushers) compared with the non-drinking group using logistic regression analysis. Model 1 did not compensate for confounding variables, whereas model 2 compensated for age, waist circumference, hypertension, diabetes, dyslipidemia, smoking, and exercise habits. Statistical significance was set at P-value <0.05, and all data were analyzed using IBM SPSS ver. 28.0 software (IBM Corp., Armonk, NY, USA).
RESULTS
1. General Participants Characteristics
Among the 314 participants, there were 78 non-drinkers and 236 drinkers. Of the 236 drinkers, there were 96 flushers and 140 non-flushers. The average ages of the non-flushers (55.2±8.6 years, P<0.001) and flushers (56.4±10.3 years, P<0.05) were significantly lower than the average age of the non-drinkers (60.6±8.7 years). The total testosterone level was not significantly different across the groups of non-drinkers (5.1±1.7 ng/mL), flushers (4.9±1.5 ng/mL), and non-flushers (4.9±1.8 ng/mL). The amount of drinking was 6.5±9.7 and 12.2±13.5 drinks per week among flushers and non-flushers, respectively, and there was a significant difference (P<0.001). No significant differences in hypertension, diabetes mellitus, dyslipidemia, smoking, or exercise habits were observed between the groups (Table 1).
2. Associations between Total Testosterone Level and Related Factors according to Alcohol Consumption and Facial Flushing
Table 2 presents the multivariate linear regression with age, waist circumference, hypertension, diabetes mellitus, dyslipidemia, weekly alcohol intake, smoking, and exercise among the non-drinkers, drinkers, flushers, and non-flushers. Age was correlated with total testosterone levels among non-drinkers (β=0.243, P=0.029), drinkers (β=0.158, P=0.019), and flushers (β=0.209, P=0.048). Waist circumference was negatively correlated with total testosterone level, regardless of flushing observations (drinkers: β=-0.250, P<0.001; flushers: β=-0.276, P=0.008; non-flushers: β=-0.230, P=0.009). No significant difference in waist circumference was observed among the non-drinkers (β=-0.295, P=0.378). Weekly alcohol intake was negatively correlated with total testosterone levels among flushers (β=-0.283, P=0.004). Hypertension was positively correlated among non-drinkers (β=0.096, P=0.001), but negatively correlated among drinkers (β=-0.137, P=0.045) and flushers (β=-0.182, P=0.049). Dyslipidemia was negatively correlated among non-drinkers (β=-0.160, P=0.011), drinkers (β=-0.187, P=0.003), and non-flushers (β=-0.209, P=0.012).
3. Total Testosterone Levels and Prevalence of Testosterone Deficiency according to Alcohol Consumption among Flushers and Non-flushers
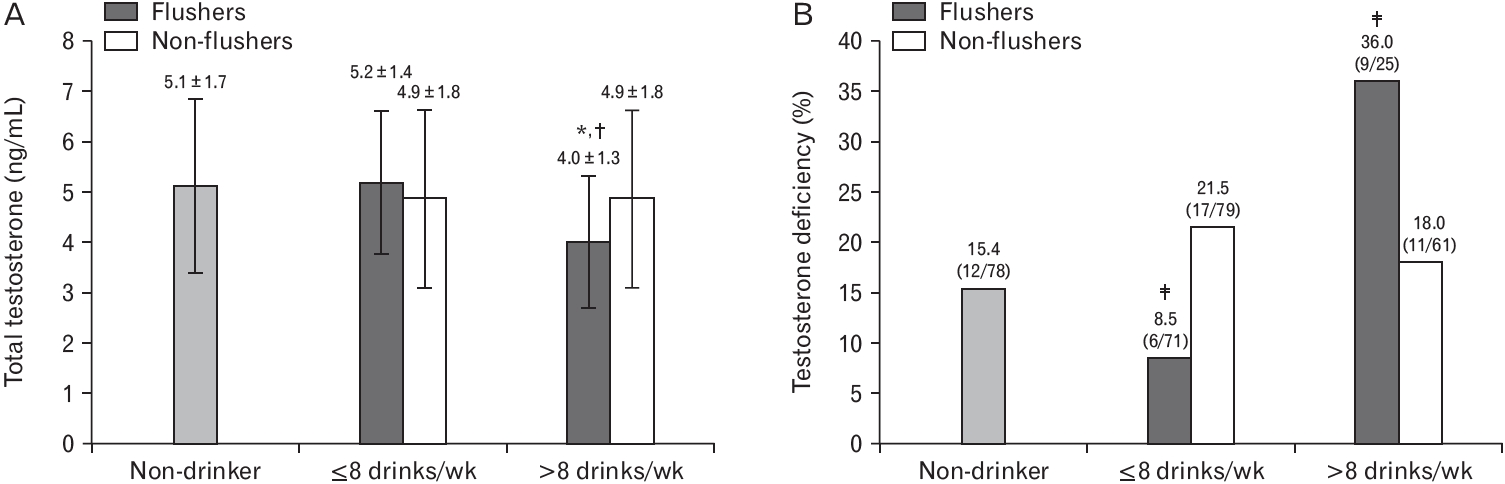
The average total testosterone level was analyzed in the groups after weekly alcohol intake was separated by eight weekly standard drinks. Figure 1A shows that the flusher group that consumed >8 drinks had significantly lower total testosterone level of 4.0 ng/mL compared to the non-drinkers (5.1 ng/mL, P=0.040) and flushers who consumed ≤8 drinks (5.2 ng/mL, P=0.023). Additionally, there was a significant difference when five groups with total testosterone <3.5 ng/mL were analyzed using chi-square test (P=0.026), and the differences between the five groups were analyzed using the Bonferroni post-hoc test. The testosterone deficiency in flushers that consumed >8 weekly (36.0%) and those that consumed ≤8 weekly drinks (8.5%) had significantly different proportions of testosterone deficiency compared to others (15.4%, 21.5%, and 18.0% in non-drinkers, non-flushers with ≤8 weekly drinks and non-flushers with >8 weekly drinks, respectively) at P-value <0.05 level (Figure 1B). In contrast, if there was no flush, no difference in the proportion of participants with testosterone deficiency was detected in non-flushers, regardless of the alcohol intake.
4. Odds Ratios of Testosterone Deficiency according to Alcohol Consumption in Flushers and Non-flushers
The odds ratios (ORs) of testosterone deficiency in the flusher group when weekly alcohol consumption was ≤8 drinks were 0.51 in model 1 (95% confidence interval [CI], 0.18–1.43; P=0.201); and 0.62 in model 2 (95% CI, 0.19–2.03; P=0.428). When weekly alcohol consumption was >8 drinks, the ORs became 3.10 in model 1 (95% CI, 1.11–8.60; P=0.030) and 4.37 in model 2 (95% CI, 1.20–15.88; P=0.025) (Table 3). When weekly alcohol consumption was ≤8 drinks, the non-flusher group had ORs of 1.51 in model 1 (95% CI, 0.67–3.41; P=0.322) and 1.85 in model 2 (95% CI, 0.71–4.80; P=0.206). When weekly alcohol consumption was >8 drinks, the ORs of the non-flusher group were 1.21 in model 1 (95% CI, 0.49–2.97; P=0.677) and 1.81 in model 2 (95% CI, 0.57–5.74; P=0.317) (Table 3).
DISCUSSION
This study investigated the effects of alcohol intake on testosterone deficiency based on facial flushing. However, there are contrasting reports on the relationship between alcohol intake and testosterone levels. In general, chronic excessive alcohol intake is known to decrease testosterone levels; however, moderate alcohol intake results in various effects on testosterone levels. Most previous studies only considered the amount of alcohol consumed, and did not consider individual alcohol metabolism. According to our study, there was a weak negative correlation between the total testosterone levels and alcohol consumption in flushers. The drinker groups that flushed and consumed >8 standard drinks per week (112 g of alcohol per week) had a 4.37 times higher risk of testosterone deficiency than the non-drinker group.
Testosterone is a hormone synthesized by the Leydig cells in the testis according to feedback from the hypothalamus-pituitary-testicular axis. The testosterone level is known to be reduced by alcohol, which affects the testis and central level [3]. Ethanol and its metabolic by-product, acetaldehyde, reduce the synthesis of testosterone directly in the Leydig cells or indirectly by generating active oxygen radicals. Moreover, ethanol and acetaldehyde limit the production and secretion of gonadotropins from the hypothalamus, decreasing testosterone levels [5-7,21]. Facial flushing is activated by the acetaldehyde that accumulates within the body, which is enabled by inactive ALDH2. Therefore, if facial flushing develops during drinking, the individual will endure the harmful effects of ethanol and acetaldehyde for a longer duration [22,23]. For this reason, it is possible that the average level of testosterone was low and the risk of testosterone deficiency increased only in the flusher group at the relatively low eight standard drinks (112 g of alcohol) per week in our study compared to other studies. Some studies have reported that Koreans who develop a drinking flush have a higher risk of hypertension [15], metabolic syndrome [16,17], diabetes mellitus [18,19], high rheumatoid factors [24], and high intraocular pressure [25] even if they do not drink much.
We did not detect a significant difference between the total testosterone levels of drinkers and nondrinkers (Table 1). Svartberg et al. [9] and Watts et al. [10] reported no relationship between alcohol intake and total testosterone levels, which aligns with our results. However, our results revealed a weak negative correlation between total testosterone level and alcohol consumption in flushers and an increased risk of testosterone deficiency among heavy drinkers (eight drinks per week) who flushed. This result also agrees with various reports claiming that consuming alcohol reduces testosterone level [4-8]. Van Thiel et al. [5] reported that a healthy adult male who consumed a pint of whiskey (473 mL) in a single day developed low total testosterone levels after 72 hours, and the level dropped to that of alcoholics. Muthusami and Chinnaswamy [7] observed that alcoholics (who consumed 180 mL/d of whiskey 5 days per week for more than 1 year) had lower total testosterone levels than non-drinkers. Most studies that have analyzed the inverse relationship between alcohol intake and testosterone levels have used cases of chronic alcoholism or acute excessive consumption of alcohol. Therefore, these studies showed that alcohol intake affects testosterone levels only during biologically risky alcohol consumption, which is not typical of alcohol consumption. In our study, total testosterone levels and the prevalence of testosterone deficiency were higher in the heavy drinking group (>8 drinks per week) with flushing, but the amount of alcohol consumed (17.7 drinks or 248 g per week) was lower than that in previous studies. This is thought to be due to the lower alcohol metabolism of Korean men than that of Westerners, as described above. In flushers with moderate drinking (≤8 drinks per week), testosterone deficiency was lower than that in other groups, but total testosterone levels were not significantly different from those in the other groups. Therefore, this is considered the result of an insufficient number of study participants, rather than the positive effect of moderate drinking.
This study has some limitations that should be discussed. First, this study was a retrospective analysis; therefore, causality between alcohol consumption and testosterone levels could not be established. Second, this study enrolled a lower proportion of heavy drinkers, which could have underestimated or overestimated the effects of alcohol on testosterone levels. Third, the participants were limited to a population that had undergone health examinations; therefore, the participants did not represent all Korean male adults.
Despite these limitations, this study is significant because it considered personal alcohol metabolism, as observed by facial flushing, to analyze the effect of alcohol consumption on total testosterone levels. In conclusion, heavy drinkers who flushed had an increased risk of testosterone deficiency after consuming >8 standard drinks per week (112 g/wk). Therefore, we recommend that drinkers who flush should limit their alcohol intake to eight or fewer standard drinks per week or not drink.