INTRODUCTION
Depression is believed to disturb daily life activities and lower the quality of life [1]. Although depression is not categorized as a non-communicable disease, the burden of psychological disorders in middle-or high-income countries cannot be ignored [2].
Poor diet and lack of physical activity are thought to be contributory to depressive moods [3]. Studies have found relationships between diet, depression, physical activity, and depression. In a recent randomized trial, long-term intake of a Mediterranean diet was beneficial for patients with depression and type 2 diabetes mellitus [4]. In addition, some cohort studies have reported that a healthy diet reduces the likelihood of depression [5]. Higher physical activity significantly decreased the risk of depressive mood in Korean adults with chronic diseases [6].
However, energy intake and expenditure are interrelated and cannot be altered in a dependent manner without compensatory changes. The components of the energy balance influence each other through several physiological controls involving hormonal signals and neural systems to maintain body mass [7,8]. Although the impact of diet and physical activity on depression are well established, little is known about the effect of energy intake-expenditure balance (EIEB) on mental health. Therefore, this study examined the association between EIEB and depression in Korean adults.
METHODS
1. Study Participants
We used data from the 2014, 2016, and 2018 Korea National Health and Nutritional Examination Survey (KNHANES). The KNHANES is based on the Korean population from a cross-sectional survey conducted by the Korea Disease Control and Prevention Agency using a complex, multistage, probability-sampling model [9]. In this study, data from all 3 years were included because the Patient Health Questionnaire-9 (PHQ-9) and Global Physical Activity Questionnaire (GPAQ) were surveyed in these 3 years.
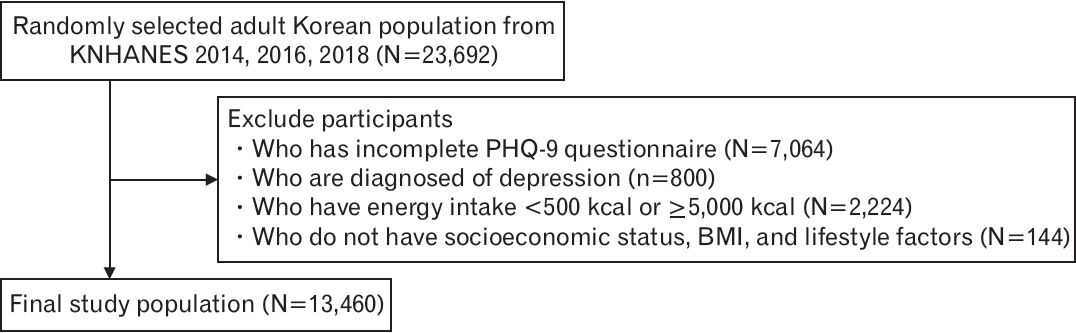
The Institutional Review Board (IRB) of Seoul National University Hospital approved this study (IRB approval no., 2208-108-1351) and written informed consent was waived for a secondary use of previously collected data.From a total of 23,692 participants, we excluded those with an incomplete PHQ-9 questionnaire (n=7,064), a diagnosis of depression (n=800), a daily energy intake of more than 5,000 kcal or less than 500 kcal (n=2,224), and no data about socioeconomic status (education, marital state, income, living state), body mass index (BMI) measurement (height, weight), or lifestyle factors (smoking, drinking). Consequently, the final study population comprised 13,460 participants aged ≥19 years (Figure 1).
2. Energy Intake Evaluation
Energy intake was obtained from the KNHANES dataset, which used a 24-hour recall method to calculate energy intake.
3. Energy Expenditure Evaluation
The KNHANES used the GPAQ to assess weekly frequency and daily hours of vigorous and moderate intensity physical activity to assess the participants’ daily energy expenditure. The GPAQ defines vigorous intensity physical activity as activities causing a high increase in breathing or heart rate for more than 10 minutes and moderate intensity as activities causing a small increase in breathing or heart rate for more than 10 minutes. It also uses a questionnaire about weekly frequency and daily hours of walking. We calculated physical activity calories using the metabolic equivalent of task (MET), transferring vigorous-intensity physical activity as 8.0 METs, moderate-intensity physical activity as 4.0 METs, and walking as 3.3 METs. Then, we used the formula: 1 kcal=3.5×MET×weight/200 [10,11].
We then calculated daily energy expenditure by adding physical activity to the calculated basal metabolic rate (BMR) using the HarrisBenedict equation. Finally, we calculated EIEB by subtracting energy expenditure from energy intake. The participants were categorized into four groups according to the EIEB (kcal) in both the male and female groups, separately: 1st quartile (Q1: E <-122), 2nd quartile (Q2: -122≤ E <396), 3rd quartile (Q3: 396≤ E <989), and 4th quartile (Q4: 989≤ E) in male and 1st quartile (Q1: E <-167), 2nd quartile (Q2: -167≤ E <211), 3rd quartile (Q3: 211≤ E <669), and 4th quartile (Q4: 669≤ E) in female.
4. Assessment of Depression
The KNHANES evaluates the participants’ degree of depression using the Korean version of the PHQ-9. The Korean version of the PHQ-9 consists of nine questions on loss of interest, depressive mood, sleep behavioral change, easy fatigability, appetite change, guilt or useless feelings, trouble in concentration, retardation or agitation, and ideation of suicide or self-harm. The Korean version of the PHQ-9 has significant sensitivity and specificity for diagnosing major depressive disorder and depressive episodes in bipolar disease [12]. We set the criterion for depression as a score of 5 using the Korean version of the PHQ-9 [13].
5. Confounding Variables
The confounding variables included socioeconomic status, BMI, lifestyle factors, and underlying diseases. Socioeconomic status included age, education level, marital status, income level, and living status. Educational level was categorized into three groups: lower than high school, high school graduate, and higher than high school. Marital status was categorized into two groups: married and unmarried. The income level was categorized into three groups: low (0%–25%), middle (25%–75%), and high (75%–100%). Living status was categorized into two groups: living alone and living with others.
Lifestyle factors including smoking and alcohol consumption were also assessed. Smoking status was categorized into three groups: never smokers, former smokers, and current smokers. Alcohol consumption was categorized into two groups: non-high-risk and high-risk. High-risk drinking was defined based on the World Health Organization (WHO) definition as consuming more than 60 g of pure alcohol per day for men and more than 40 g of pure alcohol for women [14]. According to this definition, high-risk drinking in Korean adults is defined as consuming more than seven cups of soju for men and five cups of soju for women, with frequency as drinking more than twice a week.
Underlying diseases included whether the participants were diagnosed with cardiovascular disease, cerebrovascular disease, or cancer and whether they were on medication for diabetes mellitus (DM), dyslipidemia (DL), and hypertension (HTN).
The diet quality was quantified using the mean adequacy ratio (MAR), which is the average nutrient adequacy ratio (NARs) of protein, vitamin A, thiamine, riboflavin, niacin, vitamin C, calcium, phosphorus, and iron. The NAR was calculated using the following equation: daily intake of the nutrient/recommended intake of the nutrient according to the 2020 Dietary Reference Intakes for Koreans.15,16)
6. Statistical Analysis
The characteristics of the study participants according to sex and PHQ-9 score are presented as the mean±standard error or the number (percentage). A t-test was conducted to compare the means of continuous variables and a chi-square test was performed to compare categorical variables.
Odds ratios (OR) for depression according to sex-specific quartile groups of EIEB were tested using logistic regression analysis, with the sex-specific 1st quartile group used as the reference group. Four models were designed after adjusting for confounding variables. Model 1 was tested using logistic regression analysis without any adjustment. Model 2 was tested using a multiple logistic regression analysis adjusted for age. Model 3 was tested after adjusting for BMI, educational level, marital status, income level, living status, smoking status, and alcohol consumption. Model 4 was tested with adjustments for cardiovascular disease, cerebrovascular disease, cancer diagnosis, and DM, DL, and HTN medication history, in addition to all the variables adjusted in model 3. Trend analyses are conducted on the models.
We also examined the association between energy intake and depressive moods. The participants were categorized into quartiles according to energy intake, and four models were used for statistical analysis similar to the analysis with EIEB, with the difference that physical activity was also considered a confounding factor in model 4. Multivariate logistic regression was used for analysis.
A subgroup analysis was performed to stratify the participants according to age, BMI, diet quality, physical activity, and occupational activity. The participants were divided into two groups according to each variable. For age, diet quality, and physical activity, the median values were used to classify the patients into two groups, and a BMI of 25 kg/m2 was used to divide the patients into obese and non-obese groups in accordance to the WHO and Asia-Pacific guidelines [17]. We categorized the participants’ occupations into sedentary and active groups. Sedentary occupations included homemakers, office workers, and simple laborers [18]. Quartiles of EIEB were used, and the ORs were calculated by adjusting for age, BMI, educational level, marital status, income level, living status, smoking and alcohol consumption, cardiovascular disease, cerebrovascular disease, cancer diagnosis, and DM, DL, and HTN medication history. Multivariate logistic regression was used for the subgroup analysis.
In all statistical analyses, two-sided P-values under 0.05 were considered statistically significant. Statistical analyses were performed using STATA ver. 16.0 software (Stata Corp., College Station, TX, USA).
RESULTS
1. Basal Characteristics of Study Participants
In our study, 13,460 participants aged ≥19 years (5,660 [42.0%] males and 7,800 [58.0%] females) were included. The prevalence of depression was 13.4% (n=761) in males and 21.5% (n=1,675) in females. The mean age was one year younger in the depression group than in the non-depression group for both sexes (Table 1). There was a significantly higher prevalence of depression in the participants with low education, unmarried status, low income, and living alone among both males and females compared to their counterparts. Current smokers and high-risk alcoholic drinkers had a higher prevalence of depression compared to the others.
The mean energy intake was approximately 40 kcal/d lower in the depressive group than in the non-depressive group for both males and females; the difference was not statistically significant in males. Carbohydrate intake and diet quality were significantly lower in the depressive group than in the non-depressive group in both the male and female participants. There was a significant difference in protein intake among the females. BMR, physical activity, and daily energy intake showed no significant differences between the depression and non-depression groups in either males or females. The EIEB was significantly lower in the women of the depressive group.
Women diagnosed with cardiovascular or cerebrovascular disease had a higher prevalence of depression, and men diagnosed with cancer had a higher prevalence of depression. The participants taking DM medications had a higher prevalence of depression in the males and the females; however, there were no differences with the DL or HTN medications.
2. Association between Energy Intake-Expenditure Balance and Depression
The associations between EIEB and depression in the male and female participants are shown in (Table 2). The ORs of depression in the male participants did not increase or decrease significantly according to the EIEB in any model. In model 4, the adjusted ORs of depression in Q2 (-122≤ EIEB <396), Q3 (396≤ EIEB <989), and Q4 (989≤ EIEB) were 1.20 (95% confidence interval [CI], 0.96–1.49), 1.01 (95% CI, 0.80–1.26), and 0.99 (95% CI, 0.79–1.24), respectively, with the 1st quartile as a reference group.
In contrast, the ORs of depression in the female participants was decreased in the groups with higher EIEB than in the reference group and was decreased in the 3rd quartile group in all four models. After adjustment, the decrease in OR in the 3rd quartile group remained significant. In model 4, the adjusted OR of depression in Q2 (167≤ EIEB <211), Q3 (211≤ EIEB <669), and Q4 (989≤ EIEB) were 0.87 (95% CI, 0.75–1.02), 0.79 (95% CI, 0.67–0.92), and 0.86 (0.74–1.01), respectively, with 1st quartile as a reference group. Additionally, there was a statistically significant decreasing trend in depressive mood according to the increase in EIEB quartiles in all four models.
The female participants in 3rd quartile had significantly lower odds of depression than those in the first quartile, with an OR of 0.79. However, there were no significant associations between the EIEB quartile groups and depression in the male participants.
We also examined the association between energy intake and depressive moods in the women and men. Similar to the EIEB results, energy intake was not significantly associated with depressive mood in men. However, higher energy intake was significantly associated with depressive mood in all 2nd, 3rd, and 4th quartile groups with an OR of 0.81 (95% CI, 0.69–0.94), 0.71 (95% CI, 0.61–0.83), and 0.85 (95% CI, 0.73–0.99), respectively. Trend analysis revealed a decreasing trend in the risk of depressive mood as energy intake increased (P=0.016) (Supplement 1).
3. Subgroup Analysis
After analyzing the association between EIEB and depression, we conducted several subgroup analyses according to age, BMI, diet quality, and occupational activity. All participants were divided into two subgroups: according to age (<53 years versus ≥53 in men, <51 years versus ≥51 in women), BMI (<25 kg/m2 versus ≥25 kg/m2), diet quality (<1.10 versus ≥1.10 in men, <0.97 versus ≥0.97 in women), physical activity (<164.5 kcal/d versus ≥164.5 kcal/d in men, <93.4 kcal/d versus ≥93.4 kcal/d in women), and occupational activeness (sedentary versus active), respectively. Subgroup analyses of the male and female participants are shown in Table 3.
For the male participants, there was no significant relationship between the EIEB quartile groups and depression. Only the 2nd quartile EIEB was associated with a marginally increased risk of depressive mood in obese patients with an OR of 1.38 (95% CI, 0.99–1.92).
For the female participants, the association between the quartile groups of EIEB and depression was significant in patients aged ≥51 years. The 3rd and 4th quartile groups in the EIEB had a significantly lower OR compared to the 1st quartile with an OR of 0.77 (95% CI, 0.62–0.96) and 0.75 (95% CI, 0.60–0.95). There was also a statistically significant trend for depressive mood in the older age group with a P-value of 0.014. Similar to the results in Table 2, the 3rd quartile EIEB had a significantly lower risk of depression than the 1st quartile in the non-obese/obese group, low diet quality group, high physical activity group, and sedentary/active occupation group. The ORs of depression in the obese group was generally lower than those in the non-obese group, with an OR of 0.78 (95% CI, 0.59–1.02) in the 2nd quartile, 0.73 (95% CI, 0.55–0.98) in the 3rd quartile, and 0.76 (95% CI, 0.57–1.02) in the 4th quartile. In the low diet quality group, the 3rd quartile group had a significantly lower OR compared to the 1st quartile with an OR of 0.76 (95% CI, 0.61–0.94). However, there was no significant difference in the risk for depression in the higher-quality group. Physically active participants had a lower OR than the physically inactive participants. The ORs in the 2nd and 3rd quartile groups in the physically active patients were 0.74 (95% CI, 0.59–0.92) and 0.69 (95% CI, 0.55–0.87), respectively. Lastly, both sedentary and active occupational groups showed a significant relationship between EIEB and depression in the 3rd quartile group, with an OR of 0.82 (95% CI, 0.69–0.97) and 0.58 (95% CI, 0.37–0.90).
DISCUSSION
In this study, the female participants showed a negative relationship between the EIEB quartile groups and depression, whereas the male participants showed no significant relationship. As EIEB is the result of subtracting energy expenditure from energy intake, a higher EIEB indicates excess energy intake compared with energy expenditure. In our study, the lowest likelihood of depression group was in the 3rd quartile group of the EIEB, with an OR of 0.79 for depression in women. In other words, the women with the score 211.3≤ EIEB <668.5 had the lowest risk of depression. On the other side, women participants with EIEB lower than -167.2 had the highest risk of depression. The results suggested that balanced energy intake and expenditure are important for mental health in females, and poor energy intake compared to energy expenditure adversely affects females’ mental health. In addition, the highest EIEB group had a slightly higher odds of depression than the third quartile group. This result implied that surplus energy reduces the risk of depression; however, the benefits of surplus energy can be reduced if it becomes too excessive.
Subgroup analysis showed consistent results with a significant association between EIEB and depressive mood in females and no association in males. We stratified the participants according to age, obesity, diet quality, physical activity, and occupational physical activity to determine the differences in the associations in specific patient groups. Among the female participants, older females, obese individuals, participants with lower diet quality, and physically active groups were more susceptible to the association between EIEB and depressive mood.
A negative relationship between the quartile groups of EIEB and depression was shown only in the female participants. This indicated that women are more mentally sensitive to EIEB than men. According to the Korean Ministry of Health and Welfare, men aged 50–64 years tend to have excess energy intake than energy requirement, and women aged 19–29 years and ≥70 years have less energy intake than energy requirement. In contrast, the Korean population tends to have a similar energy intake that is according to sex and age compared to energy requirement [19]. This could lead to sex differences in mental sensitivity to EIEB. Our study results partially coincided with those of a previous study by Begdache et al. [20], which showed that women are more mentally vulnerable to dietary intake than men. They suggested that dietary deficiency in men and dietary sufficiency in women had a more profound effect on mental health via the regulation of the limbic system [20].
Based on our results, we used energy intake instead of EIEB, and a higher energy intake was significantly associated with a lower risk of depressive mood. This result correlated with the finding that energy intake was lower in the depressive group, and physical activity did not differ between the depressive and non-depressive groups (Table 1). Since EIEB is calculated as the difference between energy intake and energy expenditure, we can infer that energy intake plays an essential role that is associated with depressive mood. In the subgroup analysis according to physical activity, the physically active and active occupation groups showed lower odds for depression in the 3rd quartile group of EIEB, which means adequate EIEB might be especially important in females with high energy expenditure. Although daily energy intake could be a key component in explaining energy balance and depression, EIEB at the individual level might explain this relationship better than energy intake by simply adjusting for the mean physical activity level of the study population. However, further studies are required to clarify this point.
In this study, the causal relationship between EIEB and depression was unclear owing to its cross-sectional design; however, leptin could be a possible explanation. Leptin is secreted by the adipose tissue and plays a primary role in controlling the homeostasis of energy intake and expenditure. When a human’s physiological status is in an energy deficit state, leptin levels decrease, whereas they increase with excess energy [21]. Moreover, studies have demonstrated that insufficient leptin levels affect depression and anxiety through structural and functional changes in neural plasticity in the hippocampus and prefrontal cortex, mediated by white adipose tissue [22,23]. Positive EIEB could be associated with sufficient leptin production and is less likely to lead to a depressive mood.
Our study had several strengths. The data for our study are from the KNHANES, which relies on a nationally representative survey and a large number of participants. Our study analyzed the effects of energy intake and expenditure balance on the risk of depression, which could reflect lifestyle factors related to mental health more comprehensively. To the best of our knowledge, this is the first cross-sectional study that investigated the association between EIEB and depression in the general population.
This study had some limitations. First, the cross-sectional design limited our ability to determine a causal relationship between EIEB and the likelihood of depression. Second, we calculated the estimated daily energy expenditure by adding physical activity and BMR. Daily energy expenditure consists of activity-related energy expenditure (physical activity), resting energy expenditure (BMR), and cold- or diet-induced thermogenesis [24]. However, the assessment of thermogenesis was not possible with our data; we replaced real EIEB with an incomplete form of estimated EIEB defined by adding physical activity and BMR. Third, we classified the participants as sedentary or active according to their occupation. However, even within the same occupational group, physical activity can vary according to occupation. Fourth, since the PHQ-9 is a useful screening tool for depression, the results could be different in clinically diagnosed patients with depression. Finally, dietary variables were estimated by a single 24-hour dietary recall, which might not reproduce the actual data at an individual level without considering the daily variation in diet.
In conclusion, positive energy intake and expenditure balance are negatively associated with depression in Korean women, but not in men. This study showed that monitoring individual daily energy balances is necessary, especially in women. Further prospective studies are needed to identify the causal relationship and underlying mechanisms between EIEB and depression for the management of mental health.