INTRODUCTION
Owing to the rapid industrialization of modern society, noise has become a problem. The effects of noise exposure on the auditory system are known as indicated by the laws regarding hearing loss due to workplace noise exposure. Furthermore, noise exposure is associated with several negative health effects, including high blood pressure, myocardial infarction, and cognitive impairment [1-4].
Observational and experimental studies in humans and animals have suggested that both acute and chronic noise exposure can be stressors that stimulate the sympathetic nervous system and increase stress hormones (including catecholamines and glucocorticoids), resulting in adverse health consequences [1,5-7]. Gan et al. [8] reported, based on objective indicators of personal chronic exposure to loud noise, that exposure to loud noise in the workplace is associated with chronic heart disease. Recently, exposure to residential traffic noise has been found to be related to an increased risk of type 2 diabetes (T2DM) in Danish population-based cohorts including more than 57,000 participants, suggesting the impact of noise on diabetes [9].
In addition, excessive stress hormones, such as corticosteroids, are associated with the development of T2DM in human participants and rodent models [10-13]. A study examined the effects of noise exposure on cortisol and glucose serum levels in adult male rats. It revealed significant differences in glucose and cortisol levels between groups exposed to noise (with or without diabetes) and controls [14].
A small study of 100 workers showed that chronic exposure to noise above 80 dB increased blood sugar and cortisol levels. In the present study, 80 adjusted decibels (dBA) was the maximum volume at which hormone homeostasis was maintained. The sympathetic nervous system becomes overactive at noise levels above 80 dBA [15].
Animal experimental studies have reported the effects of noise exposure on blood sugar, and many studies have shown that noise exposure is associated with sympathetic nervous system activation and stress hormone elevation; however, there are few studies on the direct association between occupational noise exposure and diabetes.
Therefore, this study aimed to examine the association between workplace noise exposure and glucose metabolism status.
METHODS
1. Study Population
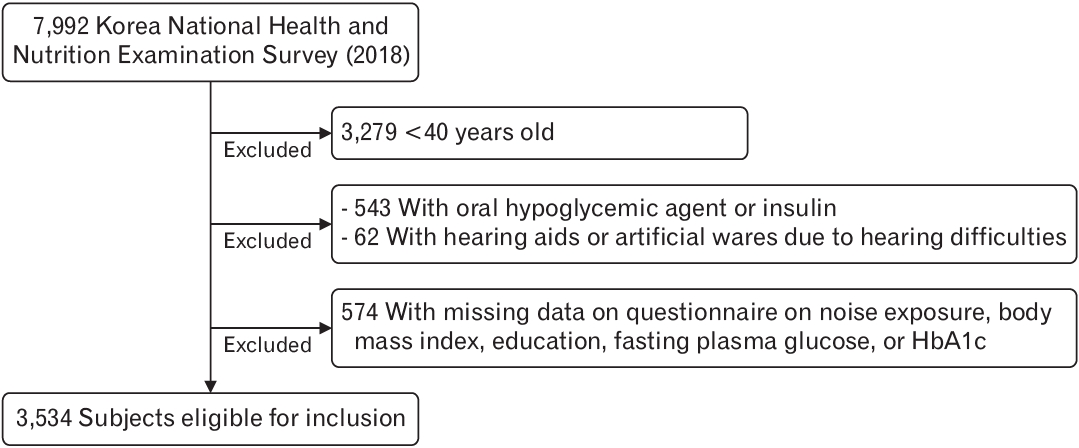
Data were obtained from the 2018 Korea National Health and Nutrition Examination Survey (KNHANES), a series of cross-sectional, nationally representative Korean surveys and laboratory examinations (N=7,992). Participants were excluded if they were <40 years old (n=3,279); were treated with an oral hypoglycemic agent or insulin (n=543); were using hearing aids or artificial wares due to hearing difficulties (n=62); or had missing data on noise exposure, body mass index (BMI), education, fasting plasma glucose, or HbA1c (n=574). After these exclusions, data of 3,534 participants were included in the analysis (Figure 1).
Participants who were being administered oral hypoglycemic agents or insulin were excluded because these medications have significant glucose-lowering effect, and we could not predict changes in blood glucose levels due to changes in medication.
2. Noise Exposure
The presence of workplace noise exposure was assessed using a questionnaire. This included the question “have you ever worked in a noisy place such as one with a machine or generator for more than 3 months?” The responses were yes, no, or no response. However, there was insufficient evidence for the three-month period. Therefore, using the same criteria for industrial accidents with noise-induced hearing loss [16], occupational noise exposure for less than 3 years was categorized as no noise exposure. The duration of noise exposure was assessed by asking the following question: “how many months have you worked?” In this study, we divided the noise exposure group into four groups based on the duration of workplace noise exposure (less than 3 years, more than 3 years but less than 10 years [17], more than 10 years but less than 20 years, and more than 20 years [18]). In addition, the use of hearing protection equipment was assessed by asking the following question: “do you wear equipment to protect your hearing in the workplace? The expected responses were yes or no.
3. Pre-diabetes and Diabetes Mellitus
Blood glucose levels were measured in two ways: fasting blood sugar (FBS) and HbA1c. The blood tests were conducted after fasting for more than 8 hours.
A person was said to have diabetes if they have a FBS >126 mg/dL, were diagnosed with diabetes by a doctor, or are being administered oral hypoglycemic agent or insulin. Normal was defined as FBS <100 mg/dL. A person with impaired fasting glucose was one who was not included in the normal or diabetes group, with FBS of between 100 mg/dL and 126 mg/dL.
4. Covariates
Age was considered a continuous variable. BMI was calculated using measured weight and height. Education was categorized as middle school graduate or lower, high school graduate, or college graduate or higher. Tobacco and alcohol use and physical activity were self-reported. Smoking status was classified as current, former, or never smoker. Alcohol consumption was classified as non-drinker, moderate drinker (<14 drinks/wk), and heavy drinker (≥14 drinks/wk). Physical activity was evaluated in terms of aerobic physical activity. The definition of aerobic physical activity was the practice of medium-intensity physical activity for more than 2 hours 30 minutes per week, or high-intensity physical activity for more than 1 hour 15 minutes per week, or practice of the time equivalent of each activity by mixing medium and high-intensity physical activities (1 minute of high-intensity activity equals 2 minutes of medium-intensity activity). Physical activity was categorized as yes or no.
5. Analysis
We conducted χ2 tests for categorical variables and analysis of variance for continuous variables. Multivariate logistic regression analysis was used to examine the association between the duration of noise exposure as the independent variable and glycemic status as the dependent variable. We fitted three nested regression models: adjusted for age (model 1); additionally adjusted for education, income, and sex (model 2); and additionally adjusted for physical activity, BMI, alcohol intake, and cigarette use (model 3). We conducted a subgroup analysis by age (40–64-year-old and 65 years or older age groups), physical activity, and hearing protection equipment use. Analyses were conducted using STATA ver. 16.1 (Stata Corp., College Station, TX, USA).
6. Ethics Statement
This study was approved by the Institutional Review Board of Seoul National University Hospital (IRB approval no., 2106-166-1230). The requirement for informed consent was waived because the participants’ consent had been obtained for the KNHANES. The dataset was in the public domain and did not include individually identifiable information.
RESULTS
Of the 3,534 participants, 190 (5.38%) had diabetes, 1,193 (33.76%) had impaired fasting glucose, and the remaining 2,151 (60.87%) were normal. Age (P=0.000), sex (P=0.000), income (P=0.085), education (P=0.000), alcohol intake (P=0.000), and smoking (P=0.000) varied with the duration of noise exposure in the workplace, but physical activity (P=0.138) and BMI (P=0.725) did not (Table 1).
1. Presence of Noise Exposure in Workplace
Exposure to noise in the workplace was not significantly associated with diabetes (odds ratio [OR], 1.11; 95% confidence interval [CI], 0.70–1.76 vs. no exposure P=0.648) or impaired fasting glucose (OR, 1.19; 95% CI, 0.96–1.48 vs. no exposure P=0.119). However, workplace noise exposure was associated with a significantly higher fasting blood glucose level than non-exposure (coefficient=2.20, P=0.027); nevertheless, the association was statistically insignificant after adjusting for confounding variables (coefficient=0.63, P=0.53) (Figure 2A, B). A positive association between noise exposure and HbA1c level was also observed (coefficient=0.08, P=0.014), and this was statistically significant after adjustment for confounding variables (coefficient=0.07, P=0.03) (Figure 2C, D).
2. Duration of Noise Exposure in the Workplace
We divided the duration of noise exposure in the workplace into four groups: <3 years, 3–10 years, 10–20 years, and ≥20 years. When we performed logistic regression analyses, we found statistically significant positive associations between occupational noise exposure and diabetes mellitus or pre-diabetes for exposures of greater than 20 years (Table 2). However, these associations were not statistically significant after adjustment for confounding variables.
Moreover, when we performed linear regression analyses, we found that a longer duration of noise exposure in the workplace tended to be associated with higher HbA1c levels. In particular, the group exposed to noise for more than 20 years showed a significantly higher HbA1c level than that of other groups after adjustment for confounding variables (Table 3).
3. Subgroup Analysis
1) Physical activity
A subgroup analysis was conducted based on aerobic physical activity status. As shown in Table 4, there was a clear tendency that the longer the noise exposure period, the higher the HbA1c level in the non-aerobic physical activity group. This tendency was higher in the non-aerobic than in the aerobic physical activity group. Furthermore, there was a significantly higher HbA1c level in the non-aerobic than in the aerobic physical activity group among those with noise exposure of greater than 20 years after adjusting for other confounding variables (Table 4).
2) Hearing protection equipment
Subgroup analysis was conducted based on whether hearing protection equipment was worn. When hearing protection equipment was not worn, a longer noise exposure period was associated with higher HbA1c levels. This tendency was relatively weak when hearing protection was used. In addition, it was confirmed that if hearing protection was not used, the HbA1c level was significantly higher among those with noise exposure for more than 20 years than if hearing protection was used (Table 5).
DISCUSSION
The association between noise exposure and the prevalence of diabetes or pre-diabetes was unclear after adjusting for confounding variables. However, we found a statistically significant relationship between elevated HbA1c levels and occupational noise exposure.
Previous studies have demonstrated a link between noise exposure and blood pressure, heart rate, cardiovascular disease, and cortisol imbalance, but the results have been inconsistent. This discrepancy may be related to differences in workplace noise levels, noise exposure duration, exposure evaluation methods, research designs, and sample sizes across studies [15].
However, there are few studies on the direct association between occupational noise exposure and diabetes. When we assessed the association between occupational noise exposure status and diabetes prevalence, no statistically significant associations were found. One meta-analysis had a similar context as that of our study. The meta-analysis synthesized the available evidence and showed an increased risk of diabetes associated with long-term exposure to transport noise, especially air traffic noise. However, the study found no significant increase in the risk of diabetes with occupational noise exposure [19].
However, in our study, through further analysis, we found that HbA1c levels were significantly higher when there was noise than when there was no noise exposure in the workplace. In addition, when we investigated the association between the duration of occupational noise exposure and glucose metabolism, we found a positive relationship between longer noise exposure and higher HbA1c levels. In particular, the group exposed to noise for >20 years showed significantly higher HbA1c levels than other groups.
In the meta-analysis mentioned above, the use of protective equipment, high physical activity, and healthy worker effects in those exposed to occupational noise could account for insignificant findings [19]. However, in our study, we performed sub-analysis by whether hearing protection devices were worn and each individual’s physical activity through surveys, which revealed the following results.
In this study, we performed a subgroup analysis based on physical activity status and hearing protection equipment use. In the sub-analysis based on physical activity status, among those with noise exposure for greater than 20 years, HbA1c was significantly higher among those that did not engage in aerobic physical activity than among those that did. Prolonged exposure to occupational noise and lack of physical activity can increase the risk of diabetes. Further research is required to validate these results.
In the sub-analysis based on hearing protection equipment use, we found that the longer the duration of noise exposure, the higher the HbA1c levels among those not wearing hearing protection. Particularly, among those exposed to noise for more than 20 years, the HbA1c level was higher among those not wearing hearing protection than among those wearing hearing protection. This suggests a protective effect of hearing protection devices on the risk of diabetes mellitus due to occupational noise exposure.
Our study had several limitations. First, it was a cross-sectional study. Therefore, the results may have been overestimated due to the unclear causal direction of the relationship between diabetes and noise exposure. Prospective studies are required to understand the relationship between the duration of occupational noise exposure and diabetes. Second, as mentioned above, participants treated with oral hypoglycemic agents or insulin were excluded. Consequently, it is possible that patients with relatively mild diabetes may have been selected as participants. Third, our study considered noise exposure duration as a primary exposure but not noise levels in each workplace. In the KNHANES survey, it was difficult to determine the noise level of each worker’s workplace; therefore, we only surveyed some occupational noise environments using machines or generators that are known to cause noise.
Despite these limitations, this study has several strengths. First, it was a population-based study with a large sample size and a relatively high response rate. Second, this is the first large cross-sectional study to investigate associations between the duration of occupational noise exposure and blood glucose parameters or the prevalence of diabetes mellitus in an Asian population. However, additional epidemiological and clinical randomized controlled trials are needed to clarify the role of occupational noise in diabetes mellitus.
In this study, we found that workers who experienced occupational noise exposure had significantly higher HbA1c levels than those who did not. Considering this result, occupational noise exposure may have contributed to the continued increase in the global prevalence of diabetes.
Meanwhile, we found that noise exposure duration of greater than 20 years was associated with a significantly higher HbA1c level, especially in the non-aerobic physical activity group. Similarly, in one study, the observed positive association between noise and pre-diabetes decreased among those with high levels of physical activity [20]. Therefore, aerobic physical activity should be recommended for workers who are exposed to noise in the workplace to prevent hearing loss and diabetes.
In conclusion, our study clearly suggests that there is a relationship between elevated HbA1c levels and workplace noise exposure, and a long duration of workplace noise exposure, no physical activity, and not wearing a hearing protection device could increase the risk of diabetes.