INTRODUCTION
Primary care physicians fulfill a comprehensive role by delivering continuous care, integrated services for diverse health needs, providing accessible healthcare, and establishing coherent connections with specialized care [1]. In South Korea, primary care is currently perceived as an underdeveloped domain, and its significance has not been highlighted in recent times [2]. Primary care may not demonstrate immediate effects, but it plays a crucial role in disease prevention and the long-term health of individuals [2]. Furthermore, within a specialist-oriented healthcare system, individuals receive fragmented treatment that lacks comprehensive medical services [2]. In South Korea, many specialists in primary care settings provide specialized on-site care, and the immediate access to specialized treatment may be perceived positively by patients. However, a drawback of this approach is the lack of comprehensive care. In South Korea, 97% of the population is covered by the national health insurance scheme, and medical aid is provided to ensure medical access for the poor [3]. Under a fee-for-service reimbursement system, providers are encouraged to increase the volume and intensity of patient care rather than improve health outcomes [2]. Many providers in South Korea practice as single operators [2].
Previous studies have indicated that an increased supply of primary care physicians is associated with reduced mortality rates, which is a significant health outcome [4-10]. To the best of our knowledge, this relationship has only been explored in a South Korean study [11]. The study employed data from multiple years for a single analysis, without considering potential year-to-year variability. Furthermore, the variables were categorized for analysis without rationale [11].
The Fifth Fact-Finding Surveys on Health and Medical Services presented data from 2016 to 2020 [12], showing the number of physicians with specialty information, including physicians in functional primary clinics (FPCs), defined based on functional primary care rather than a pre-existing concept [13]. This variable is based on the number of diagnosed diseases rather than quality, reflects quantity, and does not consider quality [13]. It has not been thoroughly validated, and this study analyzed whether the density of physicians in FPCs contributes to lowering mortality rates.
Conclusive evidence regarding the association between primary care physicians and mortality in South Korea is limited. It is crucial to clarify this relationship to understand whether expanding the supply of primary care physicians can generate measurable improvements in population health. Additionally, we assessed whether physicians in FPCs contribute to lowering mortality rates, thereby validating the novel definition of primary care. Furthermore, we compare the contributions of specialists in primary care settings with those of primary care physicians in terms of reducing mortality rates. Hence, this study aimed to investigate the association between population-level physician supply and mortality indicators in South Korea from 2016 to 2020.
METHODS
1. Data and Variables
The analysis unit was 229 si-gun-gu in South Korea. The South Korean administrative unit si-gun-gu is comparable to the county-level in the United States. All dependent and independent variables were assessed using the Si-Gun-Gu Scale.
Independent variables were the density of primary care physicians per 100,000 persons, physicians working in FPCs per 100,000 persons, specialists working in primary care facilities per 100,000 persons, and active physicians per 100,000 people [12]. Physicians with the specialty in internal medicine, family medicine, and pediatric services in primary care facilities were categorized as primary care physicians. National Health Insurance Service released the Fifth Fact-Finding Survey on Health and Medical Services [12], which covered the number of physicians by si-gun-gu. These data provide the first report on the number of physicians working in FPCs. Yun et al. [13] defined a FPC in South Korea based on the comprehensiveness of its practice. A FPC was defined as a primary care facility that has claimed 10 essential major diagnostic categories more than 12 times a year [13]. Ten essential major diagnostic categories for FPCs are as follows: nervous system; ear, nose, mouth, and throat; respiratory system; circulatory system; digestive system; musculoskeletal system and connective tissue; skin, subcutaneous tissue, and breasts; endocrine, nutritional, and metabolic system; kidney and urinary tract; and mental diseases and disorders [13]. Specialists other than the above three specialties were categorized as specialists. To calculate the density of physicians, we adopted the population size in January of each year from the Korean Statistical Information Service (KOSIS) data, because the data do not provide the density of physicians with specialty information. Regarding the number of physicians in primary care facilities, the data used are based on the number of physicians with a specialty; therefore, if a physician has more than one specialty, it can be calculated in duplicate. However, this could not be considered because no information was available and the number of physicians with multiple specialties might be small. In addition, in South Korea, physicians can practice without a specialist license, and they are commonly called “general physicians” or “GPs.” In the data used, the number of physicians who did not have a specialist license in primary care facilities was not provided at the si-gun-gu level; therefore, it was not considered. According to data from the KOSIS, there were approximately 6,000 physicians without specialties nationwide in 2020.
The dependent variables were age-adjusted all-cause mortality rates per 100,000 individuals and age-adjusted cause-specific mortality rates per 100,000 individuals between 2016 and 2020. Age-adjusted mortality per 100,000 individuals was obtained from KOSIS [14]. Seven categories of causes of death were considered: cancer, cardiovascular diseases, respiratory tract diseases, infectious diseases, traffic accidents, suicide, and falls.
We controlled for covariates that may have confounded the association between mortality and the supply of primary care physicians. Population size, number of beds per 1,000 people, percentage of the female population, percentage of the population aged 65 years or older, and aggregate income tax per person were considered.
The population size and percentage of the female population in January of each year were obtained from KOSIS [15]. The number of beds per 1,000 people was extracted from the Health Insurance Review & Assessment Service [16]. The data on the percentage of the population aged 65 years or older were obtained from the Ministry of Interior and Safety [17]. The aggregate income tax data were obtained from the National Tax Service and divided by the population size in January of each year [18]. The aggregate income tax data obtained were limited to the period between 2018 and 2020. For the other covariates, we used all the data from 2016 to 2020. Administrative boundary data for 229 si-gun-gu in 2020 were obtained from the Statistical Geographic Information Service (https://sgis.kostat.go.kr/view/index.jsp) and QGIS ver. 3.8 (https://qgis.org/en/site/) was utilized for to construct the spatial data frame.
2. Data Analysis
The data for our study were sourced from multiple origins and encompassed data from 5 years. Consequently, the data utilized in our study were classified as pooled cross-sectional data. We conducted a pooled cross-sectional data analysis and applied three approaches to investigate the association between primary care physician supply and mortality rates. Negative binomial regression was used as the primary analytical method. Because the outcome variables are countable quantities that are non-negative and have a skewed distribution, we considered Poisson regression for the analysis. To evaluate the suitability of the Poisson regression model compared to the negative binomial model, an overdispersion test was conducted. The variance was greater than the mean, indicating overdispersion. Therefore, the negative binomial model was more suitable than the Poisson model. Among the analyses for age-adjusted cause-specific mortality rates, we conducted a Poisson regression for the age-adjusted infectious disease mortality rate because of the under-dispersion problem. We conducted negative binomial regression for age-adjusted cause-specific mortality rates, except for infectious diseases. The effects of the model are presented by reporting the incidence rate ratio (IRR) and the corresponding 95% confidence intervals (CI). In the first model, time is represented as a dummy variable.
A negative binomial regression analysis with a pseudo-panel approach was used to consider the lagged effect of mortality. Deaton developed the pseudo-panel approach in 1985 [19]. The pseudo-panel approach allowed us to account for the constant characteristics of the si-gun-gu over time. The lagged dependent variable was included in a negative binomial regression analysis using a pseudo-panel approach. Finally, we utilized a geographically weighted regression (GWR) to estimate and account for spatial variations in their relationships. The GWR enables us to represent local regression coefficients that are independently quantified across different geographical locations. The dependent variable was log-transformed for the GWR analysis, as the mortality rate was non-negative and skewed. To analyze time conservatively, a GWR analysis was conducted for each year. The results summarize the coefficients for each explanatory variable and the R2 values for the GWR models. Negative binomial regression analyses were performed using STATA ver. 17.0 (Stata Corp., College Station, TX, USA), and GWR analyses were performed using R ver. 4.3.1 (The R Foundation for Statistical Computing, Vienna, Austria). This study used an ecological design to analyze data from publicly available databases. Ethical approval was not required because no human participants were involved.
RESULTS
Table 1 summarizes the characteristics of the study region from 2016 to 2020. The mean density of physicians in primary care facilities increased from 58.1 per 100,000 individuals in 2016 to 66.32 per 100,000 individuals. The mean change in the density of physicians in primary care facilities between 2016 and 2020 was 19.59%. The mean density of primary care physicians increased from 21.05 per 100,000 people in 2016 to 23.91 per 100,000 people in 2020. The growth in the mean density of specialists was higher than that of primary care physicians, which was 37.05 per 100,000 people in 2016 and 42.41 per 100,000 people in 2020. The mean density of physicians in FPCs was slightly higher than that of primary care physicians (24 per 100,000 people in 2016, 26.22 per 100,000 people in 2020). The mean density of active physicians increased from 176.55 per 100,000 people in 2016 to 188.89 per 100,000 people in 2020. As of 2020, 47% of all physicians were working in primary care facilities and 36% of all physicians in primary care facilities were primary care physicians (not shown in the table) [12]. In the order of the number of physicians with specialties working in primary care facilities was internal medicine, family medicine, pediatrics, obstetrics and gynecology, otolaryngology, orthopedics, general surgery, ophthalmology, anesthesia and pain medicine, and dermatology [12].
The age-adjusted all-cause mortality rate per 100,000 people exhibited a decreasing trend from 358.09 in 2016 to 320.05 in 2020, with an average change of 10.53%. Among the cause-specific mortality rates, some categories showed a decline (cardiovascular disease, cancer, and respiratory tract disease), while others demonstrated mixed trends (infectious disease, traffic accidents, suicide, and falls). In 2020, the outbreak of the coronavirus disease 2019 pandemic increased the mortality rate due to infectious diseases.
Table 2 presents the results of standard Negative Binomial regression. We investigated the association between the age-adjusted allcause mortality rate per 100,000 people and density of physicians from 2016 to 2020. In model 1, the IRR for the density of primary care physicians was significantly less than 1, indicating that a higher density of primary care physicians was associated with a lower mortality rate (IRR, 0.9980; 95% CI, 0.9975–0.9985). In model 2, which included aggregate income tax per person as a covariate and was analyzed from 2018 to 2020, an increase in the number of primary care physicians per 100,000 population was significantly associated with a 0.11% decrease in all-cause mortality (IRR, 0.9989; 95% CI, 0.9983–0.9995). The density of physicians in FPCs per 100,000 people was significantly associated with the all-cause mortality rate (IRR, 0.9991; 95% CI, 0.9984–0.9997) in model 1. However, this association was not significant in model 2 (IRR, 0.9997; 95% CI, 0.9989–1.0005) when fully adjusted. Similarly, in model 1, the density of specialists in primary care facilities per 100,000 people showed a significant negative association with the all-cause mortality rate (IRR, 0.9994; 95% CI, 0.9992–0.9996). However, this association became non-significant in model 2 (IRR, 0.9998; 95% CI, 0.9996–1.0000). Model 1 revealed a significant negative association between the density of active physicians per 100,000 people and the allcause mortality rate (IRR, 0.9999; 95% CI, 0.9998–0.9999). This association remained significant in model 2 (IRR, 0.9999; 95% CI, 0.9999–1.0000). Population size was negatively associated with all-cause mortality rate in all models, indicating that larger population sizes were associated with lower mortality rates (model 1: IRR, 0.9929; 95% CI, 0.9894–0.9964; model 2: IRR, 0.9931; 95% CI, 0.9887–0.9974). The number of beds per 1,000 people showed a positive association with all-cause mortality rate in all models (model 1: IRR, 1.0037; 95% CI, 1.0030–1.0045; model 2: IRR, 1.0031; 95% CI, 1.0021–1.0041). Aggregate income tax per person was also significantly associated with all-cause mortality rate in model 2 (IRR, 0.9951; 95% CI, 0.9938–0.9964).
We employed a pseudo-panel approach to further investigate the lagged effect of the mortality rate in a region. Table 3 presents the results of negative binomial regression analysis using a pseudo-panel approach. The lagged mortality rate showed a significant positive association with the current mortality rate in all models (model 1: IRR, 1.0021; 95% CI, 1.0019–1.0023; model 2: IRR, 1.0021; 95% CI, 1.0019– 1.0023). Regarding the density of physicians, model 1 showed a significant negative association between the density of primary care physicians per 100,000 population and the all-cause mortality rate (IRR, 0.9994; 95% CI, 0.9990–0.9998). After full adjustment in model 2 (IRR, 0.9997; 95% CI, 0.9992–1.0001), the association lost its statistical significance, whereas the IRR remained below 1. The density of physicians in FPCs per 100,000 population did not show a significant association with the all-cause mortality rate in either model 1 or model 2 (model 1: IRR, 0.9997; 95% CI, 0.9991–1.0002; model 2: IRR, 0.9997; 95% CI, 0.9991–1.0004). The density of specialists in primary care facilities per 100,000 people showed a significant association with the mortality rate in model 1 (IRR, 0.9998; 95% CI, 0.9996–1.0000). This association became non-significant in model 2 (IRR, 1.0000; 95% CI, 0.9998–1.0001). In terms of the density of active physicians per 100,000 people, there was a significant association with the mortality rate in models 1 and 2 (model 1: IRR, 1.0000; 95% CI, 0.9999–1.0000; model 2: IRR, 1.0000; 95% CI, 0.9999–1.0000).
Table 4 presents the results of the regression analyses of the association between the age-adjusted cause-specific mortality rate per 100,000 people and the density of primary care physicians. The results of model 1 showed a significant negative association between the density of primary care physicians and mortality rates for cardiovascular disease (IRR, 0.9976; 95% CI, 0.9967–0.9985), cancer (IRR, 0.9989; 95% CI, 0.9982–0.9995), respiratory tract disease (IRR, 0.9958; 95% CI, 0.9947–0.9970), infectious disease (IRR, 0.9980; 95% CI, 0.9963–0.9997), traffic accidents (IRR, 0.9910; 95% CI, 0.9884–0.9936), and suicide (IRR, 0.9985; 95% CI, 0.9972–0.9997). In model 2, an increase in the number of primary care physicians per 100,000 population was significantly associated with a 0.21% decrease in cardiovascular disease mortality rate (IRR, 0.9979; 95% CI, 0.9967–0.9991), a 0.28% decrease in respiratory tract disease mortality rate (IRR, 0.9972; 95% CI, 0.9957–0.9987), and a 0.64% decrease in traffic accident mortality rate (IRR, 0.9936; 95% CI, 0.9902–0.9970). For the cardiovascular disease mortality rate, the density of active physicians showed a negative association in both models (model 1: IRR, 0.9999; 95% CI, 0.9998–0.9999; model 2: IRR, 0.9999; 95% CI, 0.9998–1.0000). The density of specialists in primary care facilities (model 1: IRR, 0.9995; 95% CI, 0.9994–0.9996; model 2: IRR, 0.9996; 95% CI, 0.9995–0.9998) and active physicians (model 1: IRR, 0.9996; 95% CI, 0.9996–0.9997; model 2: IRR, 0.9997; 95% CI, 0.9996–0.9998) was negatively associated with respiratory tract disease mortality rates in both models. The density of physicians in FPCs showed a negative association only with the traffic accident mortality rate (model 1: IRR, 0.9938; 95% CI, 0.9905–0.9970; model 2: IRR, 0.9942; 95% CI, 0.9900–0.9984), which also had a significant association with the density of primary care physicians, specialists in primary care facilities, and active physicians.
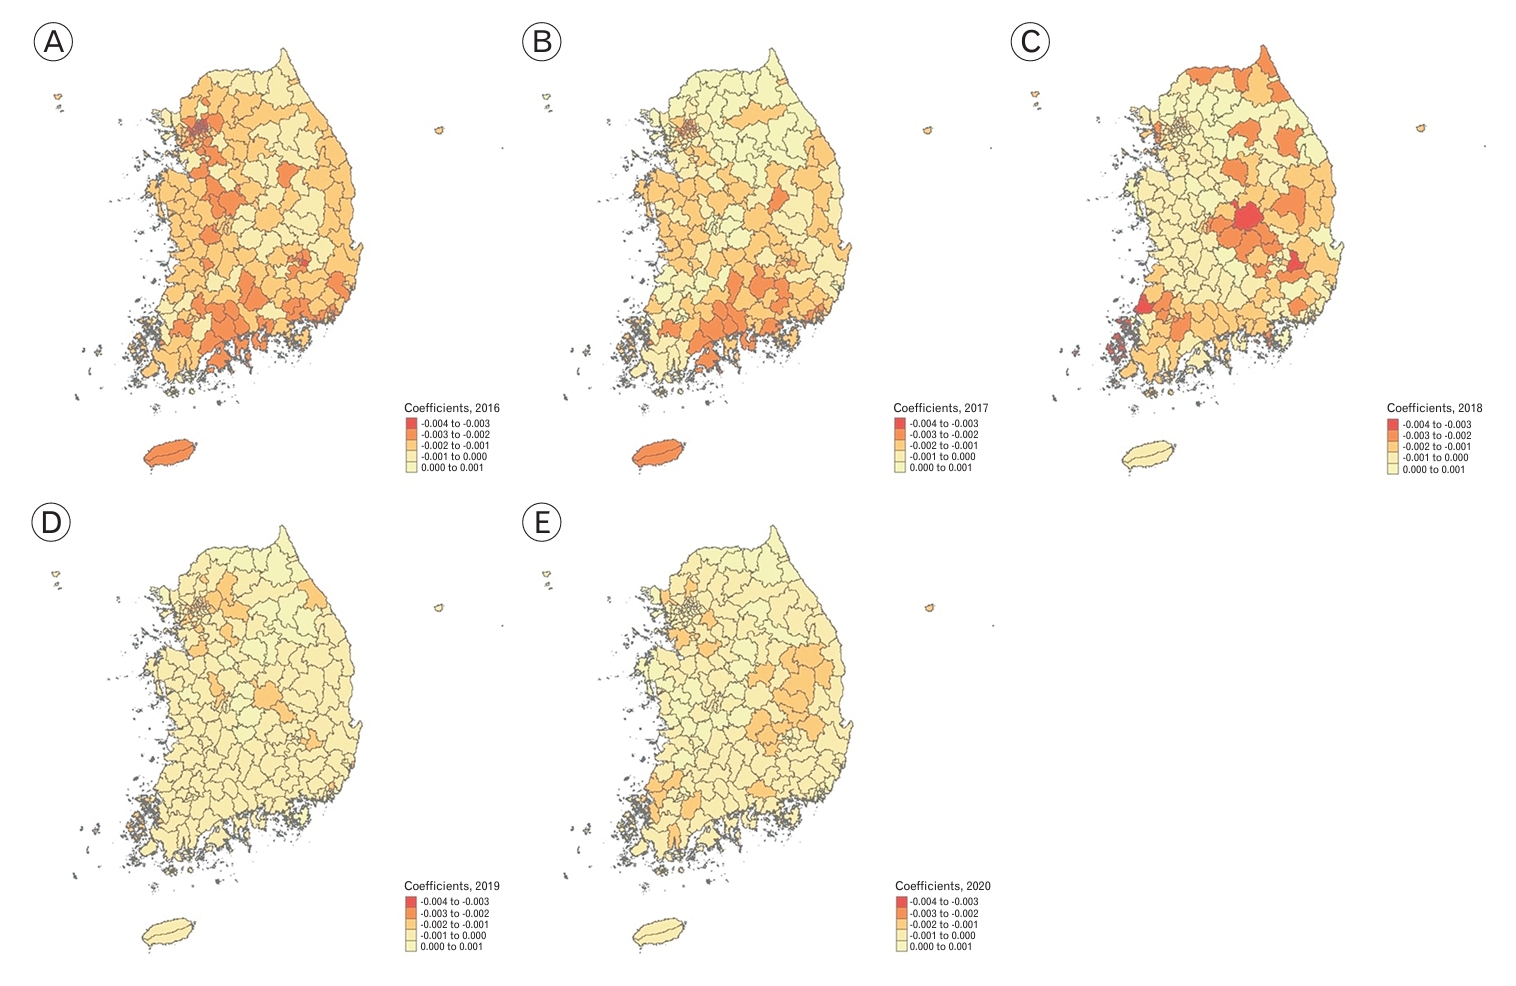
Analyses using the GWR revealed a similar association between the primary care physician supply and all-cause mortality (Table 5). Figure 1 illustrates the spatial variation in the regression coefficients across different regions as estimated by the GWR model. The log-transformed density of primary care physicians per 100,000 individuals was negatively associated with all-cause mortality. The R2 values ranged from 0.67 to 0.83, indicating that the GWR models explained a substantial proportion of the spatial variation in mortality rates.
DISCUSSION
Our findings suggest that the availability of primary care physicians is associated with a lower all-cause mortality rate, which is an important health outcome. The active physician supply showed a similar association at a statistically significant level. However, the level of influence on mortality did not appear to be substantially important. The densities of physicians in FPCs and specialists in care facilities showed similar associations. However, their significance levels varied when an additional covariate was included or when another analysis method was utilized.
Our study clearly demonstrated the association between primary care supply and mortality rate in comparison to a previous study in South Korea [11]. Our research outcomes are consistent with those of previous studies conducted in other countries [4-10]. In addition, the results showed that primary care supply was associated with lower mortality rates due to cardiovascular diseases, respiratory tract diseases, and traffic accidents.
Given their role in providing accessible, accountable, comprehensive, coordinated, family centered, and longitudinal care, it can be hypothesized that primary care physicians contribute to reducing the mortality rate [9,20]. Preventive care by primary care physicians can help reduce preventable deaths while improving referral, coordination, and continuity of care, further aiding in this reduction [9].) The association between mortality rate of cardiovascular disease and primary care physician supply has been presented in prior research [4,6,21]. Some studies suggest that primary care contributes to the control of the risk factors of cardiovascular disease, such as hypertension, diabetes, and high cholesterol levels [22,23]. This suggests that primary care physicians may provide preventive care for cardiovascular risk factors, leading to the inference that they can potentially reduce mortality rates associated with cardiovascular diseases. Several studies have demonstrated an association between the supply of primary care physicians and respiratory disease mortality rates [4,9]. Primary care physicians play a role in the assessment, education, acute exacerbation management, and regular medication prescription for chronic respiratory conditions [24]. Furthermore, their involvement in preventive measures, such as influenza and pneumococcal vaccination, can reduce respiratory disease-related mortality [25,26]. The relationship between traffic accident-related mortality rate and primary care physician supply has not been sufficiently established to our knowledge, suggesting the need for further research in the future. Previous studies have shown an association between cancer-related mortality and primary care physicians [4,10,21]. However, when additional adjustments were made in this study, the association was found to be non-significant. This could be attributed to the fact that national cancer screening programs in South Korea are more likely to be conducted directly at secondary or tertiary hospitals rather than in primary care. Since 1999, South Korea has been offering cost-free cancer screening for five cancer types: stomach, colorectal, liver, breast, and cervical. While the cancer mortality rate may have decreased through the national cancer screening program, it may not have been directly related to the primary care physician supply[ 27].
One of the differences between our study and other studies is that we compared primary care physicians with specialists in primary care facilities. In South Korea, approximately 64% of all physicians in primary care facilities were specialists in 2020 [12]. Many specialists, such as otolaryngologists, orthopedic surgeons, general surgeons, and ophthalmologists, practice in primary care facilities [12]. In models controlling for aggregate income tax per person, the association between specialists in primary care facilities and mortality rates became non-significant. Specialists in primary care settings may have advantages in terms of accessibility to specialized care. Nevertheless, they mainly provide treatment for their specialized subjects rather than comprehensive care, which may have little influence on mortality rates.
Although overlapping with primary care physicians is a novel concept, physicians in FPCs appear to have little association with mortality rates. While physicians in FPCs supply are defined through quantitative indicators, the primary care physician supply is based on specialist qualifications. According to this definition, physicians in FPCs may provide comprehensive services. However, they may have limitations in terms of first-contact accessibility, coordination function, and longitudinal care [13]. It can be inferred that qualitative indicators are more important than quantitative indicators because they have more negative associations with mortality rates. Under the fee-for-service reimbursement system, numerous physicians in South Korea engage in the practice of medicine in cosmetic clinics, clinics specializing in obesity, and related domains. There are no data on physicians practicing in such areas; therefore, some of the physicians defined as primary care physicians in our study may not function as primary care physicians. In South Korea, the boundaries among primary, secondary, and tertiary care are obscure. In addition, some physicians provide primary care in secondary and tertiary hospitals. Therefore, the variable primary care physicians used in our study may not represent all primary care physicians in South Korea. If there was an indicator reflecting the quality of primary care, the association with the mortality rate may have been more significant. To the best of our knowledge, only a single study conducted in South Korea has examined the relationship between continuity of care and population mortality [28]. To enhance clarity in defining primary care within the Korean context, efforts have been made to include dimensions such as first contact, comprehensiveness, coordination, personalized care, and consideration of family and community contexts [29]. Based on the definition of Korean primary care, a Korean primary care assessment tool was developed [30]. Further research may use this tool to explore the relationship between the quality of primary care and health outcomes.
The relatively compact size of si-gun-gu in Korea, coupled with advancements in transportation, facilitates convenient travel between these areas. Consequently, individuals often traverse regional boundaries to access specialized and capital-based healthcare facilities, thereby blurring the demarcation lines between regions. Therefore, analyzing the data based on the si-gun-gu may not represent the characteristics of the regions. The availability of data on the “living population” pertaining to a specific area at a particular point in time would offer a distinct advantage when conducting analyses.
Recently, in Korean society, there has been a growing recognition of the utmost significance of matters concerning the emergency medical system and critical care medicine. Conversely, primary care was perceived as relatively insignificant. In 2015, the average number of primary care physicians in the United States was 41.4 per 100,000 individuals [4]. In contrast, by 2020, South Korea had an average density of 23.91. This density was approximately 60% of that in the United States. Considering the variations in healthcare systems, the observed disparities emerged as significant. Despite long-standing concerns regarding the deterioration of primary care, adequate measures and reforms have yet to be implemented. Although the immediate consequences of inadequate primary care may not be readily apparent, the findings of this study elucidated a significant association between primary care in the South Korean context and mortality, which is one of the most important health outcomes.
1. Limitation
Our study has several limitations. First, it adopts an ecological design that precludes causal inference. Nevertheless, lacking individual-level data, we adjusted for relevant sociodemographic characteristics to comprehensively assess population-level effects. These results align with prior literature, which indicates enhanced health outcomes with a greater number of primary care physicians. Second, it should be noted that within the group of primary care physicians that we accounted for, certain individuals may not meet the quality criteria, and some may have been inadvertently omitted. Thus, obtaining data on the primary care physician supply while considering quality factors is imperative. Third, we could not include physicians without specialty in our analysis. Fourth, several significant covariates such as health status, poverty rates, education levels, access to transportation, and unemployment rates were not included in the analysis because of a lack of available data. Because numerous factors can influence the mortality rate, it is important to acknowledge that the study results may be less stable without accounting for these potential confounding variables. Finally, preventable hospitalization and avoidable mortality are the pivotal objectives of primary care. However, the current context in South Korea requires further evidence regarding these aspects. Therefore, future studies should investigate these themes to bridge this knowledge gap and inform healthcare policies and practices.